Island reversal
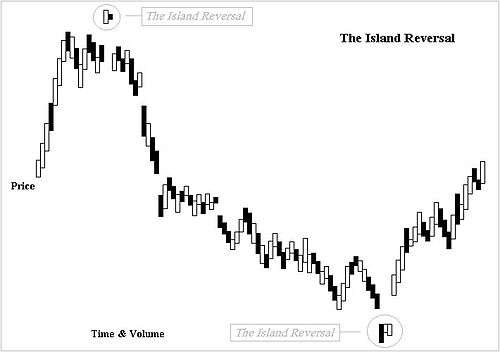
In stock trading and technical analysis, an island reversal is a candlestick pattern with compact trading activity within a range of prices, separated from the move preceding it. This separation is said to be caused by an exhaustion gap and the subsequent move in the opposite direction occurs as a result of a breakaway gap.
Formation
Close scrutiny of island reversal formations shows that the island reversal consists of an exhaustion gap and the subsequent move is followed by a breakaway gap. Uncommonly, the breakaway gap that completes the island is filled in a few days by a pull back as a result of the reaction. The island reversal can occur also, inversely, at the peak or the reverse of head and shoulders formations.
For example, assume that the price in a rising trend closes at its high of $84.00 and opens at $86.00 the following day and then does not fall below its opening. Near the end of the day, it moves up further and touches $88.00 but closes at $87.60 however. Observation thus shows a gap of $2.00 which is not filled. On the following day market price open at $87.40, touches high of $88.90 and closes at $87.00. A few days later or the very next day, market price opens at $84.00 and closes at $82.90, keeping itself below the area of $86.00 and $84.00. All the trading above $86.00 will appear on the technical analysis chart to be isolated and is known as, an island reversal.
An example of a bearish island reversal pattern was identified by Kenneth Gruneisen and published via CANSLIM.net when ITT Educational Services (ESI) topped in January 2009. ESI fell from $120 to $12 in the 4 years that followed. http://premium.canslim.net/CSNNews/templates/OPENARCHIVES.aspx?a=16266
Characteristics
- The occurrence of an island reversal is rather rare.
- It consists of a minor move.
- It is not, in itself of major significance.
- It can occur at the top as well as at the bottom.
- The gaps at either end occur at almost the same price level.
- It has a compact trading activity that is separated from the subsequent move which is in the opposite direction.
- It is an extremely good indicator of a reversal of primary or intermediate trend.
- As soon as it appears, it indicates that an extreme change in the sentiment has occurred.
- High volume is expected in that compact trading area.
- The trading activity may last for only a single day or a couple of days. When this arrangement occurs for only a single day, it is known as "one day reversal".