Technical analysis
| Financial markets |
|---|
 |
| Bond market |
| Stock market |
| Other markets |
| Over-the-counter (off-exchange) |
| Trading |
| Related areas |
In finance, technical analysis is a security analysis methodology for forecasting the direction of prices through the study of past market data, primarily price and volume.[1] Behavioral economics and quantitative analysis use many of the same tools of technical analysis,[2][3][4][5] which, being an aspect of active management, stands in contradiction to much of modern portfolio theory. The efficacy of both technical and fundamental analysis is disputed by the efficient-market hypothesis which states that stock market prices are essentially unpredictable.[6]
History
The principles of technical analysis are derived from hundreds of years of financial market data.[7] Some aspects of technical analysis began to appear in Joseph de la Vega's accounts of the Dutch markets in the 17th century. In Asia, technical analysis is said to be a method developed by Homma Munehisa during the early 18th century which evolved into the use of candlestick techniques, and is today a technical analysis charting tool.[8][9] In the 1920s and 1930s Richard W. Schabacker published several books which continued the work of Charles Dow and William Peter Hamilton in their books Stock Market Theory and Practice and Technical Market Analysis. In 1948 Robert D. Edwards and John Magee published Technical Analysis of Stock Trends which is widely considered to be one of the seminal works of the discipline. It is exclusively concerned with trend analysis and chart patterns and remains in use to the present. Early technical analysis was almost exclusively the analysis of charts, because the processing power of computers was not available for the modern degree of statistical analysis. Charles Dow reportedly originated a form of point and figure chart analysis.
Dow theory is based on the collected writings of Dow Jones co-founder and editor Charles Dow, and inspired the use and development of modern technical analysis at the end of the 19th century. Other pioneers of analysis techniques include Ralph Nelson Elliott, William Delbert Gann and Richard Wyckoff who developed their respective techniques in the early 20th century. More technical tools and theories have been developed and enhanced in recent decades, with an increasing emphasis on computer-assisted techniques using specially designed computer software.
General description
Fundamental analysts examine earnings, dividends, assets, quality, ratio, new products, research and the like. Technicians employ many methods, tools and techniques as well, one of which is the use of charts. Using charts, technical analysts seek to identify price patterns and market trends in financial markets and attempt to exploit those patterns.[10]
Technicians using charts search for archetypal price chart patterns, such as the well-known head and shoulders [11] or double top/bottom reversal patterns, study technical indicators, moving averages, and look for forms such as lines of support, resistance, channels, and more obscure formations such as flags, pennants, balance days and cup and handle patterns.[12]
Technical analysts also widely use market indicators of many sorts, some of which are mathematical transformations of price, often including up and down volume, advance/decline data and other inputs. These indicators are used to help assess whether an asset is trending, and if it is, the probability of its direction and of continuation. Technicians also look for relationships between price/volume indices and market indicators. Examples include the moving average, relative strength index, and MACD. Other avenues of study include correlations between changes in Options (implied volatility) and put/call ratios with price. Also important are sentiment indicators such as Put/Call ratios, bull/bear ratios, short interest, Implied Volatility, etc.
There are many techniques in technical analysis. Adherents of different techniques (for example, candlestick charting, Dow theory, and Elliott wave theory) may ignore the other approaches, yet many traders combine elements from more than one technique. Some technical analysts use subjective judgment to decide which pattern(s) a particular instrument reflects at a given time and what the interpretation of that pattern should be. Others employ a strictly mechanical or systematic approach to pattern identification and interpretation.
Contrasting with technical analysis is fundamental analysis, the study of economic factors that influence the way investors price financial markets. Technical analysis holds that prices already reflect all the underlying fundamental factors. Uncovering the trends is what technical indicators are designed to do, although neither technical nor fundamental indicators are perfect. Some traders use technical or fundamental analysis exclusively, while others use both types to make trading decisions.[13]
Characteristics
Technical analysis employs models and trading rules based on price and volume transformations, such as the relative strength index, moving averages, regressions, inter-market and intra-market price correlations, business cycles, stock market cycles or, classically, through recognition of chart patterns.
Technical analysis stands in contrast to the fundamental analysis approach to security and stock analysis. In the fundamental equation M = P/E technical analysis is the examination of M (multiple). Multiple encompases the psychology generally abounding, i.e. the extent of willingness to buy/sell. Also in M is the ability to pay as, for instance, a spent-out bull can't make the market go higher and a well-heeled bear won't. Technical analysis analyzes price, volume, psychology, money flow and other market information, whereas fundamental analysis looks at the facts of the company, market, currency or commodity. Most large brokerage, trading group, or financial institutions will typically have both a technical analysis and fundamental analysis team.
Technical analysis is widely used among traders and financial professionals and is very often used by active day traders, market makers and pit traders. In the 1960s and 1970s it was widely dismissed by academics. In a recent review, Irwin and Park[14] reported that 56 of 95 modern studies found that it produces positive results but noted that many of the positive results were rendered dubious by issues such as data snooping, so that the evidence in support of technical analysis was inconclusive; it is still considered by many academics to be pseudoscience.[15] Academics such as Eugene Fama say the evidence for technical analysis is sparse and is inconsistent with the weak form of the efficient-market hypothesis.[16][17] Users hold that even if technical analysis cannot predict the future, it helps to identify trading opportunities.[18]
In the foreign exchange markets, its use may be more widespread than fundamental analysis.[19][20] This does not mean technical analysis is more applicable to foreign markets, but that technical analysis is more recognized as to its efficacy there than elsewhere. While some isolated studies have indicated that technical trading rules might lead to consistent returns in the period prior to 1987,[21][22][23][24] most academic work has focused on the nature of the anomalous position of the foreign exchange market.[25] It is speculated that this anomaly is due to central bank intervention, which obviously technical analysis is not designed to predict.[26] Recent research suggests that combining various trading signals into a Combined Signal Approach may be able to increase profitability and reduce dependence on any single rule.[27]
Principles
A fundamental principle of technical analysis is that a market's price reflects all relevant information, so their analysis looks at the history of a security's trading pattern rather than external drivers such as economic, fundamental and news events. Therefore, price action tends to repeat itself due to investors collectively tending toward patterned behavior – hence technical analysis focuses on identifiable trends and conditions.[28][29]
Market action discounts everything
Based on the premise that all relevant information is already reflected by prices, technical analysts believe it is important to understand what investors think of that information, known and perceived.
Prices move in trends
Technical analysts believe that prices trend directionally, i.e., up, down, or sideways (flat) or some combination. The basic definition of a price trend was originally put forward by Dow theory.[10]
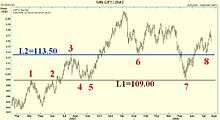
An example of a security that had an apparent trend is AOL from November 2001 through August 2002. A technical analyst or trend follower recognizing this trend would look for opportunities to sell this security. AOL consistently moves downward in price. Each time the stock rose, sellers would enter the market and sell the stock; hence the "zig-zag" movement in the price. The series of "lower highs" and "lower lows" is a tell tale sign of a stock in a down trend.[30] In other words, each time the stock moved lower, it fell below its previous relative low price. Each time the stock moved higher, it could not reach the level of its previous relative high price.
Note that the sequence of lower lows and lower highs did not begin until August. Then AOL makes a low price that does not pierce the relative low set earlier in the month. Later in the same month, the stock makes a relative high equal to the most recent relative high. In this a technician sees strong indications that the down trend is at least pausing and possibly ending, and would likely stop actively selling the stock at that point.
History tends to repeat itself
Technical analysts believe that investors collectively repeat the behavior of the investors that preceded them. To a technician, the emotions in the market may be irrational, but they exist. Because investor behavior repeats itself so often, technicians believe that recognizable (and predictable) price patterns will develop on a chart.[10] Recognition of these patterns can allow the technician to select trades that have a higher probability of success.[31]
Technical analysis is not limited to charting, but it always considers price trends.[1] For example, many technicians monitor surveys of investor sentiment. These surveys gauge the attitude of market participants, specifically whether they are bearish or bullish. Technicians use these surveys to help determine whether a trend will continue or if a reversal could develop; they are most likely to anticipate a change when the surveys report extreme investor sentiment.[32] Surveys that show overwhelming bullishness, for example, are evidence that an uptrend may reverse; the premise being that if most investors are bullish they have already bought the market (anticipating higher prices). And because most investors are bullish and invested, one assumes that few buyers remain. This leaves more potential sellers than buyers, despite the bullish sentiment. This suggests that prices will trend down, and is an example of contrarian trading.[33]
Recently, Kim Man Lui, Lun Hu, and Keith C.C. Chan have suggested that there is statistical evidence of association relationships between some of the index composite stocks whereas there is no evidence for such a relationship between some index composite others. They show that the price behavior of these Hang Seng index composite stocks is easier to understand than that of the index.[34]
Industry
The industry is globally represented by the International Federation of Technical Analysts(IFTA), which is a federation of regional and national organizations . In the United States, the industry is represented by both the Market Technicians Association (MTA) and the American Association of Professional Technical Analysts (AAPTA). The United States is also represented by the Technical Security Analysts Association of San Francisco (TSAASF). In the United Kingdom, the industry is represented by the Society of Technical Analysts (STA). In Canada the industry is represented by the Canadian Society of Technical Analysts.[35] In Australia, the industry is represented by the Australian Technical Analysts Association (ATAA),[36] (which is affiliated to IFTA) and the Australian Professional Technical Analysts (APTA) Inc.[37]
Professional technical analysis societies have worked on creating a body of knowledge that describes the field of Technical Analysis. A body of knowledge is central to the field as a way of defining how and why technical analysis may work. It can then be used by academia, as well as regulatory bodies, in developing proper research and standards for the field.[38] The Market Technicians Association (MTA) has published a body of knowledge, which is the structure for the MTA's Chartered Market Technician (CMT) exam.[39]
Systematic trading
Neural networks
Since the early 1990s when the first practically usable types emerged, artificial neural networks (ANNs) have rapidly grown in popularity. They are artificial intelligence adaptive software systems that have been inspired by how biological neural networks work. They are used because they can learn to detect complex patterns in data. In mathematical terms, they are universal function approximators,[40][41] meaning that given the right data and configured correctly, they can capture and model any input-output relationships. This not only removes the need for human interpretation of charts or the series of rules for generating entry/exit signals, but also provides a bridge to fundamental analysis, as the variables used in fundamental analysis can be used as input.
As ANNs are essentially non-linear statistical models, their accuracy and prediction capabilities can be both mathematically and empirically tested. In various studies, authors have claimed that neural networks used for generating trading signals given various technical and fundamental inputs have significantly outperformed buy-hold strategies as well as traditional linear technical analysis methods when combined with rule-based expert systems.[42][43][44]
While the advanced mathematical nature of such adaptive systems has kept neural networks for financial analysis mostly within academic research circles, in recent years more user friendly neural network software has made the technology more accessible to traders. However, large-scale application is problematic because of the problem of matching the correct neural topology to the market being studied.
Backtesting
Systematic trading is most often employed after testing an investment strategy on historic data. This is known as backtesting. Backtesting is most often performed for technical indicators, but can be applied to most investment strategies (e.g. fundamental analysis). While traditional backtesting was done by hand, this was usually only performed on human-selected stocks, and was thus prone to prior knowledge in stock selection. With the advent of computers, backtesting can be performed on entire exchanges over decades of historic data in very short amounts of time.
The use of computers does have its drawbacks, being limited to algorithms that a computer can perform. Several trading strategies rely on human interpretation,[45] and are unsuitable for computer processing.[46] Only technical indicators which are entirely algorithmic can be programmed for computerised automated backtesting.
Combination with other market forecast methods
John Murphy states that the principal sources of information available to technicians are price, volume and open interest.[10] Other data, such as indicators and sentiment analysis, are considered secondary.
However, many technical analysts reach outside pure technical analysis, combining other market forecast methods with their technical work. One advocate for this approach is John Bollinger, who coined the term rational analysis in the middle 1980s for the intersection of technical analysis and fundamental analysis.[47] Another such approach, fusion analysis, overlays fundamental analysis with technical, in an attempt to improve portfolio manager performance.
Technical analysis is also often combined with quantitative analysis and economics. For example, neural networks may be used to help identify intermarket relationships.[48]
Investor and newsletter polls, and magazine cover sentiment indicators, are also used by technical analysts.[49]
Empirical evidence
Whether technical analysis actually works is a matter of controversy. Methods vary greatly, and different technical analysts can sometimes make contradictory predictions from the same data. Many investors claim that they experience positive returns, but academic appraisals often find that it has little predictive power.[50] Of 95 modern studies, 56 concluded that technical analysis had positive results, although data-snooping bias and other problems make the analysis difficult.[14] Nonlinear prediction using neural networks occasionally produces statistically significant prediction results.[51] A Federal Reserve working paper[22] regarding support and resistance levels in short-term foreign exchange rates "offers strong evidence that the levels help to predict intraday trend interruptions," although the "predictive power" of those levels was "found to vary across the exchange rates and firms examined".
Technical trading strategies were found to be effective in the Chinese marketplace by a recent study that states, "Finally, we find significant positive returns on buy trades generated by the contrarian version of the moving-average crossover rule, the channel breakout rule, and the Bollinger band trading rule, after accounting for transaction costs of 0.50 percent."[52]
An influential 1992 study by Brock et al. which appeared to find support for technical trading rules was tested for data snooping and other problems in 1999;[53] the sample covered by Brock et al. was robust to data snooping.
Subsequently, a comprehensive study of the question by Amsterdam economist Gerwin Griffioen concludes that: "for the U.S., Japanese and most Western European stock market indices the recursive out-of-sample forecasting procedure does not show to be profitable, after implementing little transaction costs. Moreover, for sufficiently high transaction costs it is found, by estimating CAPMs, that technical trading shows no statistically significant risk-corrected out-of-sample forecasting power for almost all of the stock market indices."[17] Transaction costs are particularly applicable to "momentum strategies"; a comprehensive 1996 review of the data and studies concluded that even small transaction costs would lead to an inability to capture any excess from such strategies.[54]
In a paper published in the Journal of Finance, Dr. Andrew W. Lo, director MIT Laboratory for Financial Engineering, working with Harry Mamaysky and Jiang Wang found that:
Technical analysis, also known as "charting", has been a part of financial practice for many decades, but this discipline has not received the same level of academic scrutiny and acceptance as more traditional approaches such as fundamental analysis. One of the main obstacles is the highly subjective nature of technical analysis – the presence of geometric shapes in historical price charts is often in the eyes of the beholder. In this paper, we propose a systematic and automatic approach to technical pattern recognition using nonparametric kernel regression, and apply this method to a large number of U.S. stocks from 1962 to 1996 to evaluate the effectiveness of technical analysis. By comparing the unconditional empirical distribution of daily stock returns to the conditional distribution – conditioned on specific technical indicators such as head-and-shoulders or double-bottoms – we find that over the 31-year sample period, several technical indicators do provide incremental information and may have some practical value.[55]
In that same paper Dr. Lo wrote that "several academic studies suggest that ... technical analysis may well be an effective means for extracting useful information from market prices."[56] Some techniques such as Drummond Geometry attempt to overcome the past data bias by projecting support and resistance levels from differing time frames into the near-term future and combining that with reversion to the mean techniques.[57]
Thomas DeMark's indicators enjoy a remarkable endorsement in the financial industry. A recent work [58] has investigated the predictive power of three DeMark indicators (Sequential, Combo and Setup Trend), over 21 commodity futures markets and 10 years of data. Market entry signals have been tested by comparing conditional returns (i.e. conditioned on the entry signals) to unconditional returns. For the period from Jan. 2004 to Jan. 2014, the tests suggest statistically significant predictive power on a wide range of commodity futures.
Efficient market hypothesis
The efficient-market hypothesis (EMH) contradicts the basic tenets of technical analysis by stating that past prices cannot be used to profitably predict future prices. Thus it holds that technical analysis cannot be effective. Economist Eugene Fama published the seminal paper on the EMH in the Journal of Finance in 1970, and said "In short, the evidence in support of the efficient markets model is extensive, and (somewhat uniquely in economics) contradictory evidence is sparse."[59]
Technicians say that EMH ignores the way markets work, in that many investors base their expectations on past earnings or track record, for example. Because future stock prices can be strongly influenced by investor expectations, technicians claim it only follows that past prices influence future prices.[60] They also point to research in the field of behavioral finance, specifically that people are not the rational participants EMH makes them out to be. Technicians have long said that irrational human behavior influences stock prices, and that this behavior leads to predictable outcomes.[61] Author David Aronson says that the theory of behavioral finance blends with the practice of technical analysis:
By considering the impact of emotions, cognitive errors, irrational preferences, and the dynamics of group behavior, behavioral finance offers succinct explanations of excess market volatility as well as the excess returns earned by stale information strategies.... cognitive errors may also explain the existence of market inefficiencies that spawn the systematic price movements that allow objective TA [technical analysis] methods to work.[60]
EMH advocates reply that while individual market participants do not always act rationally (or have complete information), their aggregate decisions balance each other, resulting in a rational outcome (optimists who buy stock and bid the price higher are countered by pessimists who sell their stock, which keeps the price in equilibrium).[62] Likewise, complete information is reflected in the price because all market participants bring their own individual, but incomplete, knowledge together in the market.[62]
Random walk hypothesis
The random walk hypothesis may be derived from the weak-form efficient markets hypothesis, which is based on the assumption that market participants take full account of any information contained in past price movements (but not necessarily other public information). In his book A Random Walk Down Wall Street, Princeton economist Burton Malkiel said that technical forecasting tools such as pattern analysis must ultimately be self-defeating: "The problem is that once such a regularity is known to market participants, people will act in such a way that prevents it from happening in the future."[63] Malkiel has stated that while momentum may explain some stock price movements, there is not enough momentum to make excess profits. Malkiel has compared technical analysis to "astrology".[64]
In the late 1980s, professors Andrew Lo and Craig McKinlay published a paper which cast doubt on the random walk hypothesis. In a 1999 response to Malkiel, Lo and McKinlay collected empirical papers that questioned the hypothesis' applicability[65] that suggested a non-random and possibly predictive component to stock price movement, though they were careful to point out that rejecting random walk does not necessarily invalidate EMH, which is an entirely separate concept from RWH. In a 2000 paper, Andrew Lo back-analyzed data from U.S. from 1962 to 1996 and found that "several technical indicators do provide incremental information and may have some practical value".[56] Burton Malkiel dismissed the irregularities mentioned by Lo and McKinlay as being too small to profit from.[64]
Technicians say that the EMH and random walk theories both ignore the realities of markets, in that participants are not completely rational and that current price moves are not independent of previous moves.[30][66] Some signal processing researchers negate the random walk hypothesis that stock market prices resemble Wiener processes, because the statistical moments of such processes and real stock data vary significantly with respect to window size and similarity measure.[67] They argue that feature transformations used for the description of audio and biosignals can also be used to predict stock market prices successfully which would contradict the random walk hypothesis.
The random walk index (RWI) is a technical indicator that attempts to determine if a stock’s price movement is random in nature or a result of a statistically significant trend. The random walk index attempts to determine when the market is in a strong uptrend or downtrend by measuring price ranges over N and how it differs from what would be expected by a random walk (randomly going up or down). The greater the range suggests a stronger trend.[68]
Scientific technical analysis
Caginalp and Balenovich in 1994[69] used their asset-flow differential equations model to show that the major patterns of technical analysis could be generated with some basic assumptions. Some of the patterns such as a triangle continuation or reversal pattern can be generated with the assumption of two distinct groups of investors with different assessments of valuation.The major assumptions of the models are that the finiteness of assets and the use of trend as well as valuation in decision making. Many of the patterns follow as mathematically logical consequences of these assumptions.
One of the problems with conventional technical analysis has been the difficulty of specifying the patterns in a manner that permits objective testing.
Japanese candlestick patterns involve patterns of a few days that are within an uptrend or downtrend. Caginalp and Laurent[70] were the first to perform a successful large scale test of patterns. A mathematically precise set of criteria were tested by first using a definition of a short term trend by smoothing the data and allowing for one deviation in the smoothed trend. They then considered eight major three-day candlestick reversal patterns in a non-parametric manner and defined the patterns as a set of inequalities. The results were positive with an overwhelming statistical confidence for each of the patterns using the data set of all S&P 500 stocks daily for the five-year period 1992-1996.
Among the most basic ideas of conventional technical analysis is that a trend, once established, tends to continue. However, testing for this trend has often led researchers to conclude that stocks are a random walk. One study, performed by Poterba and Summers,[71] found a small trend effect that was too small to be of trading value. As Fisher Black noted,[72] "noise" in trading price data makes it difficult to test hypotheses.
One method for avoiding this noise was discovered in 1995 by Caginalp and Constantine[73] who used a ratio of two essentially identical closed-end funds to eliminate any changes in valuation. A closed-end fund (unlike an open-end fund) trades independently of its net asset value and its shares cannot be redeemed, but only traded among investors as any other stock on the exchanges. In this study, the authors found that the best estimate of tomorrow's price is not yesterday's price (as the efficient market hypothesis would indicate), nor is it the pure momentum price (namely, the same relative price change from yesterday to today continues from today to tomorrow). But rather it is almost exactly halfway between the two.
Starting from the characterization of the past time evolution of market prices in terms of price velocity and price acceleration, an attempt towards a general framework for technical analysis has been developed, with the goal of establishing a principled classification of the possible patterns characterizing the deviation or defects from the random walk market state and its time translational invariant properties.[74] The classification relies on two dimensionless parameters, the Froude number characterizing the relative strength of the acceleration with respect to the velocity and the time horizon forecast dimensionalized to the training period. Trend-following and contrarian patterns are found to coexist and depend on the dimensionless time horizon. Using a renormalisation group approach, the probabilistic based scenario approach exhibits statistically signifificant predictive power in essentially all tested market phases.
A survey of modern studies by Park and Irwin[75] showed that most found a positive result from technical analysis.
In 2011, Caginalp and DeSantis[76] have used large data sets of closed-end funds, where comparison with valuation is possible, in order to determine quantitatively whether key aspects of technical analysis such as trend and resistance have scientific validity. Using data sets of over 100,000 points they demonstrate that trend has an effect that is at least half as important as valuation. The effects of volume and volatility, which are smaller, are also evident and statistically significant. An important aspect of their work involves the nonlinear effect of trend. Positive trends that occur within approximately 3.7 standard deviations have a positive effect. For stronger uptrends, there is a negative effect on returns, suggesting that profit taking occurs as the magnitude of the uptrend increases. For downtrends the situation is similar except that the "buying on dips" does not take place until the downtrend is a 4.6 standard deviation event. These methods can be used to examine investor behavior and compare the underlying strategies among different asset classes.
In 2013, Kim Man Lui and T Chong pointed out that the past findings on technical analysis mostly reported the profitability of specific trading rules for a given set of historical data. These past studies had not taken the human trader into consideration as no real-world trader would mechanically adopt signals from any technical analysis method. Therefore, to unveil the truth of technical analysis, we should get back to understand the performance between experienced and novice traders. If the market really walks randomly, there will be no difference between these two kinds of traders. However, it is found by experiment that traders who are more knowledgeable on technical analysis significantly outperform those who are less knowledgeable.[77]
Ticker-tape reading
Until the mid-1960s, "tape reading" was a popular form of technical analysis. It consisted of reading market information such as price, volume, order size, and so on from a paper strip which ran through a machine called a stock ticker. Market data was sent to brokerage houses and to the homes and offices of the most active speculators. This system fell into disuse with the advent of electronic information panels in the late 60's, and later computers, which allow for the easy preparation of charts.
Quotation board
Another form of technical analysis used so far was via interpretation of stock market data contained in quotation boards, that in the times before electronic screens, were huge chalkboards located in the stock exchanges, with data of the main financial assets listed on exchanges for analysis of their movements.[78] It was manually updated with chalk, with the updates regarding some of these data being transmitted to environments outside of exchanges (such as brokerage houses, bucket shops, etc.) via the aforementioned tape, telegraph, telephone and later telex.[79]
This analysis tool was used both, on the spot, mainly by market professionals for day trading and scalping, as well as by general public through the printed versions in newspapers showing the data of the negotiations of the previous day, for swing and position trades.[80]
Despite to continue appearing in print in newspapers, as well as computerized versions in some websites, analysis via quotation board is another form of technical analysis that has fallen into disuse by the majority.
Charting terms and indicators
Concepts
- Average true range – averaged daily trading range, adjusted for price gaps.
- Breakout – the concept whereby prices forcefully penetrate an area of prior support or resistance, usually, but not always, accompanied by an increase in volume.
- Chart pattern – distinctive pattern created by the movement of security prices on a chart
- Cycles – time targets for potential change in price action (price only moves up, down, or sideways)
- Dead cat bounce – the phenomenon whereby a spectacular decline in the price of a stock is immediately followed by a moderate and temporary rise before resuming its downward movement
- Elliott wave principle and the golden ratio to calculate successive price movements and retracements
- Fibonacci ratios – used as a guide to determine support and resistance
- Momentum – the rate of price change
- Point and figure analysis – A priced-based analytical approach employing numerical filters which may incorporate time references, though ignores time entirely in its construction
- Resistance – a price level that may prompt a net increase of selling activity
- Support – a price level that may prompt a net increase of buying activity
- Trending – the phenomenon by which price movement tends to persist in one direction for an extended period of time
Types of charts
- Candlestick chart – Of Japanese origin and similar to OHLC, candlesticks widen and fill the interval between the open and close prices to emphasize the open/close relationship. In the West, often black or red candle bodies represent a close lower than the open, while white, green or blue candles represent a close higher than the open price.
- Line chart – Connects the closing price values with line segments.
- Open-high-low-close chart – OHLC charts, also known as bar charts, plot the span between the high and low prices of a trading period as a vertical line segment at the trading time, and the open and close prices with horizontal tick marks on the range line, usually a tick to the left for the open price and a tick to the right for the closing price.
- Point and figure chart – a chart type employing numerical filters with only passing references to time, and which ignores time entirely in its construction.
Overlays
Overlays are generally superimposed over the main price chart.
- Bollinger bands – a range of price volatility
- Channel – a pair of parallel trend lines
- Ichimoku kinko hyo – a moving average-based system that factors in time and the average point between a candle's high and low
- Moving average – an average over a window of time before and after a given time point that is repeated at each time point in the given chart. A moving average can be thought of as a kind of dynamic trend-line.
- Parabolic SAR – Wilder's trailing stop based on prices tending to stay within a parabolic curve during a strong trend
- Pivot point – derived by calculating the numerical average of a particular currency's or stock's high, low and closing prices
- Resistance – a price level that may act as a ceiling above price
- Support – a price level that may act as a floor below price
- Trend line – a sloping line described by at least two peaks or two troughs
- Zig Zag – This chart overlay that shows filtered price movements that are greater than a given percentage.
Breadth indicators
These indicators are based on statistics derived from the broad market.
- Advance–decline line – a popular indicator of market breadth.
- McClellan Oscillator - a popular closed-form indicator of breadth.
- McClellan Summation Index - a popular open-form indicator of breadth.
Price-based indicators
These indicators are generally shown below or above the main price chart.
- %C – denotes current markets environment as range expansion or a range contraction, it also forecast when extremes in trend or choppiness are being reached, so the trader can expect change.
- Average directional index – a widely used indicator of trend strength.
- Commodity Channel Index – identifies cyclical trends.
- MACD – moving average convergence/divergence.
- Momentum – the rate of price change.
- Relative strength index (RSI) – oscillator showing price strength.
- Relative Vigor Index (RVI) – oscillator measures the conviction of a recent price action and the likelihood that it will continue.
- Stochastic oscillator – close position within recent trading range.
- Trix – an oscillator showing the slope of a triple-smoothed exponential moving average.
Volume-based indicators
- Accumulation/distribution index – based on the close within the day's range.
- Money Flow – the amount of stock traded on days the price went up.
- On-balance volume – the momentum of buying and selling stocks.
Trading with Mixing Indicators
- MACD & Average directional index
- MACD & Super Trend
- MACD & Moving average
See also
- Algorithmic trading
- Behavioral finance
- Chartered Market Technician
- Market analysis
- Market timing
- Mathematical finance
- Multimedia information retrieval
- Price action trading
Notes
- 1 2 Kirkpatrick & Dahlquist (2006), p. 3
- ↑ Akston, Dr. Hugh (13 January 2009). "Beating the Quants at Their Own Game".
- ↑ http://www.capco.com/sites/all/files/journal-32_article-10.pdf
- ↑ Mizrach, Bruce; Weerts, Susan (27 November 2007). "Highs and Lows: A Behavioral and Technical Analysis" – via papers.ssrn.com.
- ↑ Paul V. Azzopardi (2010). Behavioural Technical Analysis: An introduction to behavioural finance and its role in technical analysis. Harriman House. ISBN 1905641419.
- ↑ Andrew W. Lo; Jasmina Hasanhodzic (2010). The Evolution of Technical Analysis: Financial Prediction from Babylonian Tablets to Bloomberg Terminals. Bloomberg Press. p. 150. ISBN 1576603490. Retrieved 8 August 2011.
- ↑ Joseph de la Vega, Confusión de Confusiones, 1688
- ↑ Nison, Steve (1991). Japanese Candlestick Charting Techniques. pp. 15–18. ISBN 0-13-931650-7.
- ↑ Nison, Steve (1994). Beyond Candlesticks: New Japanese Charting Techniques Revealed, John Wiley and Sons, p. 14. ISBN 0-471-00720-X
- 1 2 3 4 Murphy, John J. Technical Analysis of the Financial Markets. New York Institute of Finance, 1999, pp. 1-5, 24-31. ISBN 0-7352-0066-1
- ↑ PrimePair.com Head and Shoulders Pattern
- ↑ Elder (1993), Part III: Classical Chart Analysis
- ↑ Elder (1993), Part II: "Mass Psychology"; Chapter 17: "Managing versus Forecasting", pp. 65–68
- 1 2 Irwin, Scott H. and Park, Cheol-Ho. (2007). "What Do We Know About the Profitability of Technical Analysis?" Journal of Economic Surveys, Vol. 21, No. 4, pp. 786-826. Available at SSRN. doi:10.1111/j.1467-6419.2007.00519.x.
- ↑ Paulos, J.A. (2003). A Mathematician Plays the Stock Market. Basic Books.
- ↑ Fama, Eugene (May 1970). To be a science there need to be rules. The many books on technical analysis witness the existance of rules. To get a CMT deignation, one needs to prove knowledge of these rules by passing three exams. Also it should be noted there are two types of sciences: exact and inexact. Technical analysis is an inexact science, like meteorology. "Efficient Capital Markets: A Review of Theory and Empirical Work," The Journal of Finance, v. 25 (2), pp. 383-417.
- 1 2 Griffioen, Technical Analysis in Financial Markets
- ↑ Schwager, Jack D. Getting Started in Technical Analysis. Wiley, 1999, p. 2. ISBN 0-471-29542-6
- ↑ Taylor, Mark P.; Allen, Helen (1992). "The Use of Technical Analysis in the Foreign Exchange Market". Journal of International Money and Finance. 11 (3): 304–314. doi:10.1016/0261-5606(92)90048-3.
- ↑ Cross, Sam Y. (1998). All About the Foreign Exchange Market in the United States, Federal Reserve Bank of New York chapter 11, pp. 113-115.
- ↑ Brock, William; Lakonishok, Josef; Lebaron, Blake (1992). "Simple Technical Trading Rules and the Stochastic Properties of Stock Returns". The Journal of Finance. 47 (5): 1731–1764. doi:10.2307/2328994. JSTOR 2328994.
- 1 2 Osler, Karen (July 2000). "Support for Resistance: Technical Analysis and Intraday Exchange Rates," FRBNY Economic Policy Review (abstract and paper here).
- ↑ Neely, Christopher J., and Paul A. Weller (2001). "Technical analysis and Central Bank Intervention," Journal of International Money and Finance, 20 (7), 949–70 (abstract and paper here)
- ↑ Taylor, M.P.; Allen, H. (1992). "The use of technical analysis in the foreign exchange market". Journal of International Money and Finance. 11 (3): 304–314. doi:10.1016/0261-5606(92)90048-3. Retrieved 2008-03-29.
- ↑ Frankel, J.A.; Froot, K.A. (1990). "Chartists, Fundamentalists, and Trading in the Foreign Exchange Market". The American Economic Review. 80 (2): 181–185. JSTOR 2006566.
- ↑ Neely, C.J (1998). "Technical Analysis and the Profitability of US Foreign Exchange Intervention". Federal Reserve Bank of St. Louis Review. 80 (4): 3–17. Retrieved 2008-03-29.
- ↑ Lento, Camillo (2008). "A Combined Signal Approach to Technical Analysis on the S&P 500". Journal of Business & Economics Research. 6 (8): 41–51.
- ↑ Elder (2008), Chapter 1 - section "Trend vs Counter-Trending Trading"
- ↑ "Beware of the Stock Market as a Self-Fulfilling Prophecy".
- 1 2 Kahn, Michael N. (2006). Technical Analysis Plain and Simple: Charting the Markets in Your Language, Financial Times Press, Upper Saddle River, New Jersey, p. 80. ISBN 0-13-134597-4.
- ↑ Baiynd, Anne-Marie (2011). The Trading Book: A Complete Solution to Mastering Technical Systems and Trading Psychology. McGraw-Hill. p. 272. ISBN 9780071766494. Retrieved 2013-04-30.
- ↑ Kirkpatrick & Dahlquist (2006), p. 87
- ↑ Kirkpatrick & Dahlquist (2006), p. 86
- ↑ Kim Man Lui, Lun Hu, and Keith C.C. Chan. "Discovering Pattern Associations in Hang Seng Index Constituent Stocks", International Journal of Economics and Finance, Vol. 2, No. 2 (2010)
- ↑ Technical Analysis: The Complete Resource for Financial Market Technicians, p. 7
- ↑ "Home - Australian Technical Analysts Association".
- ↑ http://www.apta.org.au
- ↑ "Market Technicians Association - Advancing the Discipline of Technical Analysis for Over 40 Years".
- ↑ http://www3.finra.org/web/groups/industry/@ip/@reg/@notice/documents/notices/p013390.pdf
- ↑ K. Funahashi, On the approximate realization of continuous mappings by neural networks, Neural Networks vol 2, 1989
- ↑ K. Hornik, Multilayer feed-forward networks are universal approximators, Neural Networks, vol 2, 1989
- ↑ R. Lawrence. Using Neural Networks to Forecast Stock Market Prices
- ↑ B.Egeli et al. Stock Market Prediction Using Artificial Neural Networks
- ↑ M. Zekić. Neural Network Applications in Stock Market Predictions - A Methodology Analysis
- ↑ Elder (1993), pp. 54, 116–118
- ↑ Elder (1993)
- ↑ ltd, Research and Markets. "The Capital Growth Letter - Research and Markets".
- ↑ http://www.iijournals.com/JOT/default.asp?Page=2&ISS=22278&SID=644085
- ↑ "SFO".
- ↑ Browning, E.S. (July 31, 2007). "Reading market tea leaves". The Wall Street Journal Europe. Dow Jones. pp. 17–18.
- ↑ Skabar, Cloete, Networks, Financial Trading and the Efficient Markets Hypothesis
- ↑ Nauzer J. Balsara, Gary Chen and Lin Zheng "The Chinese Stock Market: An Examination of the Random Walk Model and Technical Trading Rules" The Quarterly Journal of Business and Economics, Spring 2007
- ↑ Sullivan, R.; Timmermann, A.; White, H. (1999). "Data-Snooping, Technical Trading Rule Performance, and the Bootstrap". The Journal of Finance. 54 (5): 1647–1691. doi:10.1111/0022-1082.00163.
- ↑ Chan, L.K.C.; Jegadeesh, N.; Lakonishok, J. (1996). "Momentum Strategies". The Journal of Finance. The Journal of Finance, Vol. 51, No. 5. 51 (5): 1681–1713. doi:10.2307/2329534. JSTOR 2329534.
- ↑ Foundations of Technical Analysis: Computational Algorithms, Statistical Inference, and Empirical Implementation, with Harry Mamaysky and Jiang Wang, Journal of Finance 55(2000), 1705-1765.
- 1 2 Lo, Andrew W.; Mamaysky, Harry; Wang, Jiang (2000). "Foundations of Technical Analysis: Computational Algorithms, Statistical Inference, and Empirical Implementation". Journal of Finance. 55 (4): 1705–1765. doi:10.1111/0022-1082.00265.
- ↑ David Keller, "Breakthroughs in Technical Analysis; New Thinking from the World's Top Minds," New York, Bloomberg Press, 2007, ISBN 978-1-57660-242-3 pp.1-19
- ↑ Marco Lissandrin, Donnacha Daly and Didier Sornette, Statistical Testing of DeMark Technical Indicators on Commodity Futures, ETH Zurich working paper (http://ssrn.com/abstract=2696155)
- ↑ Eugene Fama, "Efficient Capital Markets: A Review of Theory and Empirical Work," The Journal of Finance, volume 25, issue 2 (May 1970), pp. 383-417.
- 1 2 Aronson, David R. (2006). Evidence-Based Technical Analysis, Hoboken, New Jersey: John Wiley and Sons, pages 357, 355-356, 342. ISBN 978-0-470-00874-4.
- ↑ Prechter, Robert R, Jr; Parker, Wayne D (2007). "The Financial/Economic Dichotomy in Social Behavioral Dynamics: The Socionomic Perspective". Journal of Behavioral Finance. 8 (2): 84–108. doi:10.1080/15427560701381028.
- 1 2 Clarke, J., T. Jandik, and Gershon Mandelker (2001). "The efficient markets hypothesis," Expert Financial Planning: Advice from Industry Leaders, ed. R. Arffa, 126-141. New York: Wiley & Sons.
- ↑ Burton Malkiel, A Random Walk Down Wall Street, W. W. Norton & Company (April 2003) p. 168.
- 1 2 Robert Huebscher. Burton Malkiel Talks the Random Walk. July 7, 2009.
- ↑ Lo, Andrew; MacKinlay, Craig. A Non-Random Walk Down Wall Street, Princeton University Press, 1999. ISBN 978-0-691-05774-3
- ↑ Poser, Steven W. (2003). Applying Elliott Wave Theory Profitably, John Wiley and Sons, p. 71. ISBN 0-471-42007-7.
- ↑ Eidenberger, Horst (2011). "Fundamental Media Understanding" Atpress. ISBN 978-3-8423-7917-6.
- ↑ "AsiaPacFinance.com Trading Indicator Glossary".
- ↑ Gunduz Caginalp & Donald Balenovich (2003). "A theoretical foundation for technical analysis" (PDF). Journal of Technical Analysis. 59: 5–22.
- ↑ G. Caginalp and H. Laurent, "The Predictive Power of Price Patterns." Applied Mathematical Finance, Vol. 5, pp. 181-206, 1998.
- ↑ J.M. Poterba and L.H. Summers, "Mean reversion in stock prices: Evidence and Implications," Journal of Financial Economics 22, 27-59, 1988.
- ↑ Black, F. 1986. Noise. Journal of Finance 41:529-43.
- ↑ G. Caginalp and G. Constantine, "Statistical inference and modeling of momentum in stock prices," Applied Mathematical Finance 2, 225-242, 1995.
- ↑ J. V. Andersen, S. Gluzman and D. Sornette, Fundamental Framework for Technical Analysis, European Physical Journal B 14, 579-601 (2000)
- ↑ C-H Park and S.H. Irwin, "The Profitability of Technical Analysis: A Review" AgMAS Project Research Report No. 2004-04
- ↑ G. Caginalp and M. DeSantis, "Nonlinearity in the dynamics of financial markets," Nonlinear Analysis: Real World Applications, 12(2), 1140-1151, 2011.
- ↑ K.M. Lui and T.T.L Chong, "Do Technical Analysts Outperform Novice Traders: Experimental Evidence" Economics Bulletin. 33(4), 3080-3087, 2013.
- ↑ Lefèvre (2000), pp. 1, 18
- ↑ Lefèvre (2000), p. 17
- ↑ Livermore; Jesse "How to Trade in Stocks" Duell, Sloan & Pearce NY 1940, pp. 17-18
Bibliography
- Elder, Alexander (1993). Trading for a Living; Psychology, Trading Tactics, Money Management. John Wiley & Sons. ISBN 0-47159224-2.
- Kirkpatrick, Charles D.; Dahlquist, Julie R. (2006). Technical Analysis: The Complete Resource for Financial Market Technicians. Financial Times Press. ISBN 0-13-153113-1.
- Lefèvre, Edwin (2000) [1923]. Reminiscences of a Stock Operator: With new Commentary and Insights on the Life and Times of Jesse Livermore. John Wiley & Sons. ISBN 9780470481592.
Further reading
- Colby, Robert W. The Encyclopedia of Technical Market Indicators. 2nd Edition. McGraw Hill, 2003. ISBN 0-07-012057-9
- Covel, Michael. The Complete Turtle Trader. HarperCollins, 2007. ISBN 9780061241703
- Douglas, Mark. The Disciplined Trader. New York Institute of Finance, 1990. ISBN 0-13-215757-8
- Edwards, Robert D.; Magee, John; Bassetti, W.H.C. Technical Analysis of Stock Trends, 9th Edition (Hardcover). American Management Association, 2007. ISBN 0-8493-3772-0
- Fox, Justin. The Myth of the Rational Market. HarperCollings, 2009. ISBN 9780060598990
- Hurst, J. M. The Profit Magic of Stock Transaction Timing. Prentice-Hall, 1972. ISBN 0-13-726018-0
- Neill, Humphrey B. Tape Reading & Market Tactics. First edition of 1931. Market Place 2007 reprint ISBN 1592802621
- Neill, Humphrey B. The Art of Contrary Thinking. Caxton Press 1954.
- Pring, Martin J. Technical Analysis Explained: The Successful Investor's Guide to Spotting Investment Trends and Turning Points. McGraw Hill, 2002. ISBN 0-07-138193-7
- Raschke, Linda Bradford; Connors, Lawrence A. Street Smarts: High Probability Short-Term Trading Strategies. M. Gordon Publishing Group, 1995. ISBN 0-9650461-0-9
- Rollo Tape & Wyckoff, Richard D. Studies in Tape Reading The Ticker Publishing Co. NY 1910.
- Tharp, Van K. Definitive Guide to Position Sizing International Institute of Trading Mastery, 2008. ISBN 0935219099
- Wilder, J. Welles. New Concepts in Technical Trading Systems. Trend Research, 1978. ISBN 0-89459-027-8
- Ladis Konecny, Stocks and Exchange – the only Book you need, 2013, ISBN 9783848220656, technical analysis = chapter 8.
External links
- International and national organizations
- International Federation of Technical Analysts
- New Zealand: Society of Technical Analysts of New Zealand
- Singapore: Technical Analysts Society (Singapore)