Hemel Hempstead (UK Parliament constituency)
| Hemel Hempstead | |
|---|---|
|
County constituency for the House of Commons | |
|
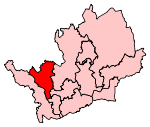
Boundary of Hemel Hempstead in Hertfordshire. | |
|
Location of Hertfordshire within England. | |
| County | Hertfordshire |
| Electorate | 72,561 (December 2010)[1] |
| Major settlements | Hemel Hempstead |
| Current constituency | |
| Created | 1997 |
| Member of parliament | Mike Penning (Conservative) |
| Number of members | One |
| Created from | West Hertfordshire |
| 1918–1983 | |
| Number of members | One |
| Type of constituency | County constituency |
| Replaced by | Hertfordshire West and Hertfordshire South West[2] |
| Overlaps | |
| European Parliament constituency | East of England |

Hemel Hempstead is a constituency represented in the House of Commons of the Parliament of the United Kingdom. It elects one Member of Parliament (MP) by the first past the post system of election.
Boundaries
1918-1950: The Municipal Borough of Hemel Hempstead, the Urban Districts of Berkhamsted, Harpenden, and Tring, the Rural Districts of Berkhamsted and Hemel Hempstead, in the Rural District of St Albans the civil parishes of Harpenden Rural, Redbourn, and Wheathampstead, and in the Rural District of Watford the civil parishes of Abbots Langley and Sarratt.
1950-1974: The Municipal Borough of Hemel Hempstead, the Urban Districts of Berkhamsted, Harpenden, and Tring, the Rural Districts of Berkhamsted and Hemel Hempstead, and in the Rural District of St Albans the civil parishes of Harpenden Rural and Redbourn.
1974-1983: The Municipal Borough of Hemel Hempstead, the Urban Districts of Berkhamsted and Tring, and the Rural Districts of Berkhamsted and Hemel Hempstead.
1997-2010: The District of Dacorum wards of Adeyfield East, Adeyfield West, Ashridge, Bennetts End, Boxmoor, Central, Chaulden, Crabtree, Cupid Green, Flamstead and Markyate, Gadebridge, Grove Hill, Highfield, Kings Langley, Leverstock Green, Nash Mills, South, and Warners End.
2010-present: The District of Dacorum wards of Adeyfield East, Adeyfield West, Apsley, Ashridge, Bennetts End, Boxmoor, Chaulden and Shrubhill, Corner Hall, Gadebridge, Grove Hill, Hemel Hempstead Central, Highfield and St Paul's, Kings Langley, Leverstock Green, Nash Mills, Warners End, Watling, and Woodhall.
For the 1997 general election, the former Hertfordshire West constituency was reduced in area and renamed "Hemel Hempstead". This reflected the growing population around the edge of London and the decision of the Boundary Commission for England to create an extra seat in the county of Hertfordshire.
Members of Parliament
MPs 1918-1983
MPs 1997-present
| Election | Member[3] | Party | |
|---|---|---|---|
| 1997 | Tony McWalter | Labour Co-operative | |
| 2005 | Mike Penning | Conservative | |
Elections
Elections in the 2010s
| Party | Candidate | Votes | % | ± | |
|---|---|---|---|---|---|
| Conservative | Mike Penning | 26,245 | 52.9 | +2.9 | |
| Labour | Tony Breslin | 11,825 | 23.8 | +3.0 | |
| UKIP | Howard Koch | 7,249 | 14.6 | +12.1 | |
| Liberal Democrat | Rabi Martins | 2,402 | 4.8 | −18.0 | |
| Green | Alan Borgars | 1,660 | 3.3 | N/A | |
| Independent | Brian Hall | 252 | 0.5 | N/A | |
| Majority | 14,420 | 29.1 | +2 | ||
| Turnout | 49,633 | 66.5 | -1.5 | ||
| Conservative hold | Swing | ||||
| Party | Candidate | Votes | % | ± | |
|---|---|---|---|---|---|
| Conservative | Mike Penning | 24,721 | 50.0 | +9.9 | |
| Liberal Democrat | Richard Grayson | 11,315 | 22.9 | +6.0 | |
| Labour | Ayfer Orhan | 10,295 | 20.8 | −18.9 | |
| BNP | Janet Price | 1,615 | 3.3 | N/A | |
| UKIP | David Alexander | 1,254 | 2.5 | −0.7 | |
| Independent | Mick Young | 271 | 0.5 | N/A | |
| Majority | 13,406 | 27.1 | +26.7 | ||
| Turnout | 49,471 | 68.0 | +3.7 | ||
| Conservative hold | Swing | +14.4 | |||
This was the highest swing from Labour to Conservative in the 2010 general election.
Elections in the 2000s
| Party | Candidate | Votes | % | ± | |
|---|---|---|---|---|---|
| Conservative | Mike Penning | 19,000 | 40.3 | +1.8 | |
| Labour Co-op | Tony McWalter | 18,501 | 39.3 | −7.3 | |
| Liberal Democrat | Richard Sean Grayson | 8,089 | 17.2 | +4.4 | |
| UKIP | Barry Newton | 1,518 | 3.2 | +1.1 | |
| Majority | 499 | 1.1 | |||
| Turnout | 47,108 | 64.4 | +2.1 | ||
| Conservative gain from Labour Co-op | Swing | +4.6 | |||
| Party | Candidate | Votes | % | ± | |
|---|---|---|---|---|---|
| Labour Co-op | Tony McWalter | 21,389 | 46.6 | +0.9 | |
| Conservative | Paul Crago Ivey | 17,647 | 38.5 | −0.6 | |
| Liberal Democrat | Neil Stuart | 5,877 | 12.8 | +0.5 | |
| UKIP | Barry Newton | 970 | 2.1 | N/A | |
| Majority | 3,742 | 8.1 | |||
| Turnout | 45,883 | 62.3 | −14.3 | ||
| Labour Co-op hold | Swing | ||||
Elections in the 1990s
| Party | Candidate | Votes | % | ± | |
|---|---|---|---|---|---|
| Labour Co-op | Tony McWalter | 25,175 | 45.7 | ||
| Conservative | Robert Brannock Jones | 21,539 | 39.1 | ||
| Liberal Democrat | Mrs. Patricia Lindsley | 6,789 | 12.3 | ||
| Referendum | Peter Such | 1,327 | 2.4 | ||
| Natural Law | Mrs. Diana M. Harding | 262 | 0.5 | ||
| Majority | 3,636 | 6.6 | |||
| Turnout | 55,092 | 76.6 | |||
| Labour gain from Conservative | Swing | ||||
Elections in the 1970s
| Party | Candidate | Votes | % | ± | |
|---|---|---|---|---|---|
| Conservative | Nicholas Lyell | 37,953 | 48.73 | ||
| Labour | Robin Corbett | 32,964 | 42.33 | ||
| Liberal | D Penwarden | 6,314 | 8.11 | ||
| National Front | T Walters | 649 | 0.83 | ||
| Majority | 4,989 | 6.41 | |||
| Turnout | 84.80 | ||||
| Conservative gain from Labour | Swing | ||||
| Party | Candidate | Votes | % | ± | |
|---|---|---|---|---|---|
| Labour | Robin Corbett | 29,223 | 42.69 | ||
| Conservative | James Harry Allason | 28,738 | 41.98 | ||
| Liberal | CAM Baron | 10,497 | 15.33 | ||
| Majority | 485 | 0.71 | |||
| Turnout | 81.70 | ||||
| Labour gain from Conservative | Swing | ||||
| Party | Candidate | Votes | % | ± | |
|---|---|---|---|---|---|
| Conservative | James Harry Allason | 27,572 | 39.03 | ||
| Labour | Robin Corbett | 27,385 | 38.77 | ||
| Liberal | CAM Baron | 15,682 | 22.20 | ||
| Majority | 187 | 0.26 | |||
| Turnout | 85.23 | ||||
| Conservative hold | Swing | ||||
| Party | Candidate | Votes | % | ± | |
|---|---|---|---|---|---|
| Conservative | James Harry Allason | 40,417 | 51.98 | ||
| Labour | Peter A. Fletcher | 28,067 | 36.10 | ||
| Liberal | A. John Wilson | 9,274 | 11.93 | ||
| Majority | 12,350 | 15.88 | |||
| Turnout | 78.10 | ||||
| Conservative hold | Swing | ||||
Elections in the 1960s
| Party | Candidate | Votes | % | ± | |
|---|---|---|---|---|---|
| Conservative | James Harry Allason | 31,742 | 44.45 | ||
| Labour | Robin Corbett | 29,704 | 41.59 | ||
| Liberal | A. John Whiteside | 9,970 | 13.96 | ||
| Majority | 2,038 | 2.85 | |||
| Turnout | 84.71 | ||||
| Conservative hold | Swing | ||||
| Party | Candidate | Votes | % | ± | |
|---|---|---|---|---|---|
| Conservative | James Harry Allason | 31,119 | 44.85 | ||
| Labour | Gilbert D. Hitchcock | 26,273 | 37.87 | ||
| Liberal | A. John Whiteside | 11,986 | 17.28 | ||
| Majority | 4,846 | 6.98 | |||
| Turnout | 84.52 | ||||
| Conservative hold | Swing | ||||
Elections in the 1950s
| Party | Candidate | Votes | % | ± | |
|---|---|---|---|---|---|
| Conservative | James Harry Allason | 30,189 | 49.90 | ||
| Labour | Bernard Francis Castle Floud | 21,954 | 36.29 | ||
| Liberal | Miss Margaret Neilson | 8,358 | 13.81 | ||
| Majority | 8,235 | 13.61 | |||
| Turnout | 85.26 | ||||
| Conservative hold | Swing | ||||
| Party | Candidate | Votes | % | ± | |
|---|---|---|---|---|---|
| Conservative | The Viscountess Davidson | 25,648 | 51.02 | ||
| Labour | Norman Ian MacKenzie | 19,512 | 38.81 | ||
| Liberal | Edwin Saich | 5,111 | 10.17 | ||
| Majority | 6,136 | 12.21 | |||
| Turnout | 83.77 | ||||
| Conservative hold | Swing | ||||
| Party | Candidate | Votes | % | ± | |
|---|---|---|---|---|---|
| Conservative | The Viscountess Davidson | 25,620 | 58.44 | ||
| Labour | Norman Ian MacKenzie | 18,220 | 41.56 | ||
| Majority | 7,400 | 16.88 | |||
| Turnout | 83.80 | ||||
| Conservative hold | Swing | ||||
| Party | Candidate | Votes | % | ± | |
|---|---|---|---|---|---|
| Conservative | The Viscountess Davidson | 22,022 | 50.18 | ||
| Labour | Reginald Moss | 15,165 | 34.56 | ||
| Liberal | Peter Arthur Stevens | 6,696 | 15.26 | ||
| Majority | 6,857 | 15.63 | |||
| Turnout | 85.07 | ||||
| Conservative hold | Swing | ||||
Elections in the 1940s
| Party | Candidate | Votes | % | ± | |
|---|---|---|---|---|---|
| Conservative | Viscountess Frances Joan Davidson | 19,536 | 44.2 | -13.5 | |
| Labour | Miss DW Mobbs | 14,426 | 32.6 | +18.6 | |
| Liberal | Thomas Alfred Trotter | 10,219 | 23.1 | -5.2 | |
| Majority | 5,110 | 11.6 | -17.8 | ||
| Turnout | 71.0 | +16.0 | |||
| Conservative hold | Swing | -16.0 | |||
General Election 1939/40: Another general election was required to take place before the end of 1940. The political parties had been making preparations for an election to take place from 1939 and by the end of this year, the following candidates had been selected;
- Conservative: Viscountess Davidson
- Liberal: Ian Davidson[11]
- Labour: A W Harper[12]
Elections in the 1930s
| Party | Candidate | Votes | % | ± | |
|---|---|---|---|---|---|
| Conservative | Viscountess Frances Joan Davidson | 14,992 | 57.7 | -4.8 | |
| Liberal | Margery Irene Corbett Ashby | 7,347 | 28.3 | +6.3 | |
| Labour | Charles William James | 3,651 | 14.0 | -1.4 | |
| Majority | 7,645 | 29.4 | -11.2 | ||
| Turnout | 55.0 | -14.3 | |||
| Conservative hold | Swing | -5.6 | |||
| Party | Candidate | Votes | % | ± | |
|---|---|---|---|---|---|
| Conservative | Rt Hon. Sir John Colin Campbell Davidson | 20,074 | 62.5 | -4.7 | |
| Liberal | Margery Irene Corbett Ashby | 7,078 | 22.0 | -2.6 | |
| Labour | Charles William James | 4,951 | 15.4 | +7.2 | |
| Majority | 12,996 | 40.6 | -2.0 | ||
| Turnout | 69.3 | -7.9 | |||
| Conservative hold | Swing | -1.1 | |||
| Party | Candidate | Votes | % | ± | |
|---|---|---|---|---|---|
| Conservative | Rt Hon. John Colin Campbell Davidson | 21,946 | 67.2 | + | |
| Liberal | Charles Thomas Le Quesne | 8,021 | 24.6 | ||
| Labour | Albert E.R. Millar | 2,677 | 8.2 | ||
| Majority | 13,925 | 42.7 | |||
| Turnout | 77.2 | ||||
| Conservative hold | Swing | ||||
Elections in the 1920s
| Party | Candidate | Votes | % | ± | |
|---|---|---|---|---|---|
| Unionist | Rt Hon. John Colin Campbell Davidson | 15,145 | 49.8 | -7.8 | |
| Liberal | Charles Thomas Le Quesne | 11,631 | 38.3 | +2.8 | |
| Labour | Albert E.R. Millar | 3,624 | 11.9 | +5.0 | |
| Majority | 3,514 | 11.5 | -10.6 | ||
| Turnout | 78.0 | -2.2 | |||
| Unionist hold | Swing | -5.3 | |||
| Party | Candidate | Votes | % | ± | |
|---|---|---|---|---|---|
| Unionist | Rt Hon. John Colin Campbell Davidson | 12,985 | 57.6 | ||
| Liberal | John Freeman Dunn | 7,994 | 35.5 | ||
| Labour | Amy Sayle | 1,553 | 6.9 | ||
| Majority | 4,991 | 22.1 | |||
| Turnout | 80.2 | ||||
| Unionist gain from Liberal | Swing | ||||
| Party | Candidate | Votes | % | ± | |
|---|---|---|---|---|---|
| Liberal | John Freeman Dunn | 8,892 | 50.0 | n/a | |
| Unionist | Rt Hon. John Colin Campbell Davidson | 8,875 | 50.0 | -17.4 | |
| Majority | 17 | 0.0 | -34.8 | ||
| Turnout | 65.8 | -0.2 | |||
| Liberal gain from Unionist | Swing | n/a | |||
| Party | Candidate | Votes | % | ± | |
|---|---|---|---|---|---|
| Unionist | John Colin Campbell Davidson | 11,847 | 67.4 | n/a | |
| Labour | John Harper Clynes | 5,726 | 32.6 | n/a | |
| Majority | 6,121 | 34.8 | n/a | ||
| Turnout | 66.0 | n/a | |||
| Unionist hold | Swing | n/a | |||
| Party | Candidate | Votes | % | ± | |
|---|---|---|---|---|---|
| Unionist | John Colin Campbell Davidson | unopposed | n/a | n/a | |
| Unionist hold | Swing | n/a | |||
Elections in the 1910s
| Party | Candidate | Votes | % | ± | |
|---|---|---|---|---|---|
| Unionist | 10,070 | 77.6 | |||
| Labour | Jesse Hawkes | 2,913 | 22.4 | ||
| Majority | 7,157 | 55.2 | |||
| Turnout | 50.4 | ||||
| Unionist hold | Swing | ||||
- endorsed by the Coalition Government
See also
Notes and references
Craig, F. W. S. (1983). British parliamentary election results 1918-1949 (3 ed.). Chichester: Parliamentary Research Services. ISBN 0-900178-06-X.
- ↑ "Electorate Figures - Boundary Commission for England". 2011 Electorate Figures. Boundary Commission for England. 4 March 2011. Retrieved 13 March 2011.
- ↑ "'Hemel Hempstead', Feb 1974 - May 1983". ElectionWeb Project. Cognitive Computing Limited. Retrieved 22 March 2016.
- 1 2 Leigh Rayment's Historical List of MPs – Constituencies beginning with "H" (part 2)
- ↑ "Election Data 2015". Electoral Calculus. Archived from the original on 17 October 2015. Retrieved 17 October 2015.
- ↑ "Statement Of Persons Nominated And Notice Of Poll" (PDF). Acting Returning Officer. 9 April 2015. Retrieved 14 April 2015.
- ↑ "Election Data 2010". Electoral Calculus. Archived from the original on 17 October 2015. Retrieved 17 October 2015.
- ↑ "Election Data 2005". Electoral Calculus. Archived from the original on 15 October 2011. Retrieved 18 October 2015.
- ↑ "Election Data 2001". Electoral Calculus. Archived from the original on 15 October 2011. Retrieved 18 October 2015.
- ↑ "Election Data 1997". Electoral Calculus. Archived from the original on 15 October 2011. Retrieved 18 October 2015.
- 1 2 3 4 5 6 7 8 9 10 British parliamentary election results 1918-1949, Craig, F. W. S.
- ↑ Report of the Annual Conference of the Labour Party, 1939
- ↑ The Liberal Magazine, 1939
Sources
- Craig, F. W. S. (1983) [1969]. British parliamentary election results 1918-1949 (3rd ed.). Chichester: Parliamentary Research Services. ISBN 0-900178-06-X.