North West Norfolk (UK Parliament constituency)
| North West Norfolk | |
|---|---|
|
County constituency for the House of Commons | |
|
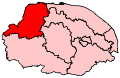
Boundary of North West Norfolk in Norfolk. | |
|
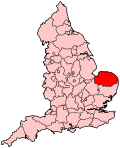
Location of Norfolk within England. | |
| County | Norfolk |
| Electorate | 73,269 (December 2010)[1] |
| Major settlements | Kings Lynn and Hunstanton |
| Current constituency | |
| Created | 1974 |
| Member of parliament | Henry Bellingham (Conservative) |
| Number of members | One |
| Created from | King's Lynn |
| 1885–1918 | |
| Number of members | One |
| Replaced by | King's Lynn |
| Overlaps | |
| European Parliament constituency | East of England |
North West Norfolk is a constituency[n 1] represented in the House of Commons of the UK Parliament since 2001 by Henry Bellingham, a Conservative.[n 2]
History
The constituency was created under the Redistribution of Seats Act 1885 for the 1885 general election, and abolished for the 1918 general election. It was re-established for the February 1974 general election, replacing the former King's Lynn constituency.
The first MP had gained almost exactly the same wards (in the old seat) in 1970, before which Lynn was held by one of Harold Wilson's government colleagues in the Labour Party, largely as a bellwether. Christopher Brocklebank-Fowler therefore effectively held the seat in the two 1974 elections and in 1979 however by March 1981 he became distanced from the Conservatives and defected to the newly formed Social Democratic Party shortly before the 1983 Conservative Landslide where Brocklebank-Fowler lost his seat to the replacement Conservative candidate Henry Bellingham.
Bellingham increased his precarious lead over Brocklebank-Fowler at the 1987 general election who therefore in the following election chose to contest another area[n 3] and at which Labour's candidate regained second place, almost doubling their share of the vote. Labour gained the seat at the 1997 general election but Bellingham regained the seat at the 2001 general election and increased his majority subsequently in both 2005 and 2010 but fell slightly in 2015.
The 2010 election saw political party infighting when the Labour candidate for North West Norfolk, Manish Sood[n 4][2] stated in an interview with the local newspaper Lynn News that Gordon Brown was
"the worst prime minister we have had in this country."
This gained national attention and resulted in Labour disowning their candidate. Sood did not attend the count and stated he would watch it from his home in Leicester,[3] only to finish third, behind Bellingham and the Liberal Democrat candidate William Summers, whose party received their best ever result in the constituency,[4] with an 18.3% swing from Labour to the others.[5][6][7]
Boundaries
1885-1918: The Municipal Borough of King's Lynn, and the Sessional Divisions of Brothercross, Freebridge Lynn, Freebridge Marshall, and Gallow and Smithdon.
1974-1983: The Municipal Borough of King's Lynn, the Urban Districts of Hunstanton and Wells-next-the-Sea, and the Rural Districts of Docking, Freebridge Lynn, Marshland, and Walsingham.
1983-2010: The Borough of King's Lynn and West Norfolk wards of Burnham, Chase, Clenchwarton, Creake, Dersingham, Docking, Gayton, Gaywood Central, Gaywood North, Gaywood South, Grimston, Heacham, Hunstanton, Lynn Central, Lynn North, Lynn South West, Mershe Lande, Middleton, North Coast, Priory, Rudham, St Lawrence, St Margaret's, Snettisham, Spellowfields, The Walpoles, The Woottons, Valley Hill, West Walton, West Winch, and Wiggenhall.
2010–present: The Borough of King's Lynn and West Norfolk wards of Brancaster, Burnham, Clenchwarton, Dersingham, Docking, Fairstead, Gayton, Gaywood Chase, Gaywood North Bank, Grimston, Heacham, Hunstanton, North Lynn, North Wootton, Old Gaywood, Priory, Rudham, St Margaret's with St Nicholas, Snettisham, South and West Lynn, South Wootton, Spellowfields, Springwood, Valley Hill, Walpole, and West Winch.
The present constituency includes two former borough constituencies, those of Castle Rising, which was abolished as a 'rotten borough' in 1832, and King's Lynn, abolished in 1918.
Constituency profile
Norfolk North West constituency covers an extensive hinterland in the far corner of East Anglia - remote from London, but close to Lincolnshire and the East Midlands, with which the area shares more economic links.
A minority of King's Lynn contain severe poverty marked by unemployment,[8] social housing dependency and social problems - within relatively affluent East Anglia, only Jaywick and Great Yarmouth from 2001-2004 scored higher in deprivation indices. Contrasted with this is the bulk of the area: the tourist resort Hunstanton, retail, military, public sector and commercial activity of Kings Lynn and the royal estate at Sandringham, along with many small villages and more than 50% undulating cultivated farmland — incomes and types of dwelling are close to the national average. The most frequent result has been of a fairly marginal but not negligible majority for a Conservative.
Labour's share of the vote has fallen from a winning 43.8% in the 1997 election to just 13.3% in 2010, marking the steepest decline from the start to end of the Blair–Brown government.[9]
Members of Parliament
MPs 1885–1918
| Election | Member[10] | Party | |
|---|---|---|---|
| 1885 | Joseph Arch | Liberal | |
| 1886 | Lord Henry Cavendish-Bentinck | Conservative | |
| 1892 | Joseph Arch | Liberal | |
| 1900 | Sir George White | Liberal | |
| 1912 by-election | Edward George Hemmerde | Liberal | |
| 1918 | constituency abolished: see King's Lynn | ||
MPs since 1974
| Election | Member[10] | Party | |
|---|---|---|---|
| Feb. 1974 | Christopher Brocklebank-Fowler | Conservative | |
| 1981 | SDP | ||
| 1983 | Henry Bellingham | Conservative | |
| 1997 | George Turner | Labour | |
| 2001 | Sir Henry Bellingham | Conservative | |
Elections
Elections in the 2010s
| Party | Candidate | Votes | % | ± | |
|---|---|---|---|---|---|
| Conservative | Henry Bellingham[12] | 24,727 | 52.2 | -2.0 | |
| Labour | Joanne Rust | 10,779 | 22.8 | +9.5 | |
| UKIP | Richard Toby Coke[12] | 8,412 | 17.8 | +13.9 | |
| Green | Michael de Whalley[13] | 1,780 | 3.8 | +2.2 | |
| Liberal Democrat | Hugh Lanham[14] | 1,673 | 3.5 | -19.7 | |
| Majority | 13,948 | 29.4 | -1.6 | ||
| Turnout | 47,597 | 65.4 | +0.1 | ||
| Conservative hold | Swing | -3.75 | |||
| Party | Candidate | Votes | % | ± | |
|---|---|---|---|---|---|
| Conservative | Henry Bellingham | 25,916 | 54.2 | +4.3 | |
| Liberal Democrat | William Summers | 11,106 | 23.2 | +8.5 | |
| Labour | Manish Sood | 6,353 | 13.3 | -18.3 | |
| UKIP | John William Gray | 1,841 | 3.9 | +0.2 | |
| BNP | David Fleming | 1,839 | 3.8 | +3.8 | |
| Green | Mike de Whalley | 745 | 1.6 | +1.6 | |
| Majority | 14,810 | 31.0 | +12.9 | ||
| Turnout | 47,800 | 65.3 | +3.7 | ||
| Conservative hold | Swing | -2.1 | |||
Elections in the 2000s
| Party | Candidate | Votes | % | ± | |
|---|---|---|---|---|---|
| Conservative | Henry Bellingham | 25,471 | 50.3 | +1.8 | |
| Labour | Damien Welfare | 16,291 | 32.2 | -9.5 | |
| Liberal Democrat | Simon Higginson | 7,026 | 13.9 | +5.5 | |
| UKIP | Michael Stone | 1,861 | 3.7 | +2.3 | |
| Majority | 9,180 | 18.1 | +11.3 | ||
| Turnout | 50,649 | 61.6 | -3.5 | ||
| Conservative hold | Swing | +5.7 | |||
| Party | Candidate | Votes | % | ± | |
|---|---|---|---|---|---|
| Conservative | Henry Bellingham | 24,846 | 48.5 | +7.0 | |
| Labour | George Turner | 21,361 | 41.7 | -2.1 | |
| Liberal Democrat | Ian Mack | 4,292 | 8.4 | -1.2 | |
| UKIP | Ian Durrant | 704 | 1.4 | N/A | |
| Majority | 3,485 | 6.8 | |||
| Turnout | 51,203 | 65.1 | -9.7 | ||
| Conservative gain from Labour | Swing | ||||
Elections in the 1990s
| Party | Candidate | Votes | % | ± | |
|---|---|---|---|---|---|
| Labour | George Turner | 25,250 | 43.8 | +10.2 | |
| Conservative | Henry Bellingham | 23,911 | 41.5 | -10.6 | |
| Liberal Democrat | Evelyn Knowles | 5,513 | 9.6 | -4.2 | |
| Referendum | Roger Percival | 2,923 | 5.1 | N/A | |
| Majority | 1,339 | 2.3 | |||
| Turnout | 74.7 | -6.0 | |||
| Labour gain from Conservative | Swing | 10.4 | |||
| Party | Candidate | Votes | % | ± | |
|---|---|---|---|---|---|
| Conservative | Henry Bellingham | 32,554 | 52.1 | +1.6 | |
| Labour | George Turner | 20,990 | 33.6 | +16.1 | |
| Liberal Democrat | AM Waterman | 8,599 | 13.8 | −18.2 | |
| Natural Law | SRA Pink | 330 | 0.5 | N/A | |
| Majority | 11,564 | 18.5 | −0.1 | ||
| Turnout | 62,473 | 80.7 | +1.8 | ||
| Conservative hold | Swing | −7.3 | |||
Elections in the 1980s
| Party | Candidate | Votes | % | ± | |
|---|---|---|---|---|---|
| Conservative | Henry Bellingham | 29,393 | 50.55 | ||
| Social Democratic | Christopher Brocklebank-Fowler | 18,568 | 31.93 | ||
| Labour | Frank Dignan | 10,184 | 17.51 | ||
| Majority | 10,825 | 18.62 | |||
| Turnout | 78.85 | ||||
| Conservative hold | Swing | ||||
| Party | Candidate | Votes | % | ± | |
|---|---|---|---|---|---|
| Conservative | Henry Bellingham | 23,358 | 43.49 | ||
| Social Democratic | Christopher Brocklebank-Fowler | 20,211 | 37.63 | ||
| Labour | Mike Tilbury | 10,139 | 18.88 | ||
| Majority | 3,147 | 5.86 | |||
| Turnout | 77.63 | ||||
| Conservative hold | Swing | ||||
Elections in the 1970s
| Party | Candidate | Votes | % | ± | |
|---|---|---|---|---|---|
| Conservative | Christopher Brocklebank-Fowler | 33,796 | 51.01 | ||
| Labour | RL Williams | 25,868 | 39.04 | ||
| Liberal | M Mynott | 6,588 | 9.94 | ||
| Majority | 7,928 | 11.97 | |||
| Turnout | 79.15 | ||||
| Conservative hold | Swing | ||||
| Party | Candidate | Votes | % | ± | |
|---|---|---|---|---|---|
| Conservative | Christopher Brocklebank-Fowler | 27,513 | 43.99 | ||
| Labour | RL Williams | 26,170 | 41.84 | ||
| Liberal | RA Walker | 8,862 | 14.17 | ||
| Majority | 1,343 | 2.15 | |||
| Turnout | 78.43 | ||||
| Conservative hold | Swing | ||||
| Party | Candidate | Votes | % | ± | |
|---|---|---|---|---|---|
| Conservative | Christopher Brocklebank-Fowler | 27,823 | 42.35 | ||
| Labour | John Derek Page | 27,020 | 41.13 | ||
| Liberal | RA Walker | 10,852 | 16.52 | ||
| Majority | 803 | 1.22 | |||
| Turnout | 83.07 | ||||
| Conservative win (new seat) | |||||
Elections in the 1910s
| Party | Candidate | Votes | % | ± | |
|---|---|---|---|---|---|
| Liberal | Edward George Hemmerde | 5,613 | 53.1 | -2.8 | |
| Conservative | Neville Paul Jodrell | 4,965 | 46.9 | +2.8 | |
| Majority | 648 | 6.2 | 5.6 | ||
| Turnout | 10,578 | 87.7 | +4.4 | ||
| Liberal hold | Swing | -2.8 | |||
| Party | Candidate | Votes | % | ± | |
|---|---|---|---|---|---|
| Liberal | Sir George White | 5,407 | 55.9 | -0.1 | |
| Conservative | Neville Paul Jodrell | 4,264 | 44.1 | +0.1 | |
| Majority | 1,143 | 11.8 | -0.2 | ||
| Turnout | 83.3 | -2.7 | |||
| Liberal hold | Swing | -0.1 | |||
| Party | Candidate | Votes | % | ± | |
|---|---|---|---|---|---|
| Liberal | Sir George White | 5,596 | 56.0 | ||
| Conservative | Neville Paul Jodrell | 4,388 | 44.0 | ||
| Majority | 1,208 | 12.0 | |||
| Turnout | 9,984 | 86.0 | |||
| Liberal hold | Swing | ||||
Elections in the 1900s
| Party | Candidate | Votes | % | ± | |
|---|---|---|---|---|---|
| Liberal | George White | 5,772 | 66.0 | ||
| Conservative | William John Lancaster | 2,972 | 34.0 | ||
| Majority | 2,800 | 32.0 | |||
| Turnout | 8,744 | 78.8 | |||
| Liberal hold | Swing | ||||
| Party | Candidate | Votes | % | ± | |
|---|---|---|---|---|---|
| Liberal | George White | 4,287 | 52.9 | ||
| Liberal Unionist | Sir William Howell Browne Ffolkes | 3,811 | 47.1 | ||
| Majority | 476 | 5.8 | |||
| Turnout | 8,098 | 74.9 | |||
| Liberal hold | Swing | ||||
See also
Notes and references
- Notes
- ↑ A county constituency (for the purposes of election expenses and type of returning officer)
- ↑ As with all constituencies, the constituency elects one Member of Parliament (MP) by the first past the post system of election at least every five years.
- ↑ South Norfolk constituency
- ↑ At the time a Leicester councillor
- References
- ↑ "Electorate Figures - Boundary Commission for England". 2011 Electorate Figures. Boundary Commission for England. 4 March 2011. Retrieved 13 March 2011.
- ↑ "Thousands celebrate Diwali event". BBC News. 28 October 2008. Retrieved 5 May 2010.
- ↑ PM attack Labour candidate stayed at home Diss Express 6 May 2010
- ↑ Chris Bishop (8 May 2010). "Henry Bellingham increases his NW Norfolk majority". Norwich Evening News.
- ↑ "Election 2010: Brown worst PM says Labour candidate". BBC News. 2010-04-16. Retrieved 5 May 2010.
- ↑ "Brown is 'worst PM ever'". BBC News. 2010-04-16. Retrieved 5 May 2010.
- ↑ Mason, Trevor (4 May 2010). "Disowned candidate Manish Sood unrepentant over PM blast". The Independent. Retrieved 5 May 2010.
- ↑ Unemployment claimants by constituency The Guardian
- 1 2 Election results 1992-2005, Guardian
- 1 2 Leigh Rayment's Historical List of MPs – Constituencies beginning with "N" (part 2)
- ↑ "Election Data 2015". Electoral Calculus. Archived from the original on 17 October 2015. Retrieved 17 October 2015.
- 1 2 http://electionresults.blogspot.co.uk/2013/05/norfolk-north-west-2015.html
- ↑ http://www.lynnnews.co.uk/news/local/latest-local-news/west-norfolk-greens-hold-agm-1-6551267
- ↑ http://www.libdems.org.uk/general_election_candidates#East of England
- ↑ "Election Data 2010". Electoral Calculus. Archived from the original on 26 July 2013. Retrieved 17 October 2015.
- ↑ "Election Data 2005". Electoral Calculus. Archived from the original on 15 October 2011. Retrieved 18 October 2015.
- ↑ "Election Data 2001". Electoral Calculus. Archived from the original on 15 October 2011. Retrieved 18 October 2015.
- ↑ "Election Data 1997". Electoral Calculus. Archived from the original on 15 October 2011. Retrieved 18 October 2015.
- ↑ "Election Data 1992". Electoral Calculus. Archived from the original on 15 October 2011. Retrieved 18 October 2015.
- ↑ "Politics Resources". Election 1992. Politics Resources. 9 April 1992. Retrieved 2010-12-06.
- ↑ "Election Data 1987". Electoral Calculus. Archived from the original on 15 October 2011. Retrieved 18 October 2015.
- ↑ "Election Data 1983". Electoral Calculus. Archived from the original on 15 October 2011. Retrieved 18 October 2015.
- 1 2 3 4 5 British parliamentary election results, 1885-1918 (Craig)