Norwich North (UK Parliament constituency)
| Norwich North | |
|---|---|
|
Borough constituency for the House of Commons | |
|
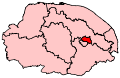
Boundary of Norwich North in Norfolk. | |
|
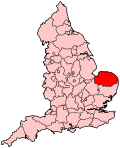
Location of Norfolk within England. | |
| County | Norfolk |
| Electorate | 64,982 (December 2010)[1] |
| Current constituency | |
| Created | 1950 |
| Member of parliament | Chloe Smith (Conservative) |
| Number of members | One |
| Created from | Norwich |
| Overlaps | |
| European Parliament constituency | East of England |
Norwich North is a constituency[n 1] represented in the House of Commons of the UK Parliament since 2009 by Chloe Smith, a Conservative.[n 2]
Boundaries
1950-1955: The County Borough of Norwich wards of Catton, Coslany, Fye Bridge, Heigham, Hellesdon, Mousehold, Thorpe, and Westwick.
1955-1974: The County Borough of Norwich wards of Catton, Coslany, Fye Bridge, Heigham, Hellesdon, Mousehold, Thorpe, and Westwick, the part of the civil parish of Thorpe-next-Norwich in the Rural District of Blofield and Flegg, and the part of the civil parish of Sprowston in the Rural District of St Faiths and Aylsham added to the County Borough of Norwich by the Norwich Extension Act 1950.
1974-1983: The County Borough of Norwich wards of Catton, Coslany, Crome, Heigham, Hellesdon, Mousehold, Thorpe, and Westwick.
1983-1997: The District of Broadland wards of Catton, Hellesdon North, Hellesdon South East, Hellesdon West, Sprowston Central, Sprowston East, Sprowston South, Sprowston West, Thorpe St Andrew North East, Thorpe St Andrew North West, and Thorpe St Andrew South, and the City of Norwich wards of Catton Grove, Coslany, Crome, Mile Cross, and Mousehold.
1997-2010: The District of Broadland wards of Catton, Drayton, Hellesdon North, Hellesdon South East, Hellesdon West, Sprowston Central, Sprowston East, Sprowston South, Sprowston West, Taverham, Thorpe St Andrew North East, Thorpe St Andrew North West, and Thorpe St Andrew South, and the City of Norwich wards of Catton Grove, Coslany, Crome, Mile Cross, and Mousehold.
2010-present: The District of Broadland wards of Hellesdon North West, Hellesdon South East, Old Catton and Sprowston West, Sprowston Central, Sprowston East, Thorpe St Andrew North West, and Thorpe St Andrew South East, and the City of Norwich wards of Catton Grove, Crome, Mile Cross, and Sewell.
The constituency includes parts of two local government areas, Norwich and Broadland with the majority of the electorate in Broadland.
History
The constituency was created at the 1950 general election, when the former two-seat constituency of Norwich was divided into two single-member seats, Norwich North and Norwich South.
It has been a Labour Party seat for most of its history, although it was held by the Conservatives for fourteen years, demonstrating its marginality. The Labour member from 1997 to 2009 was Dr Ian Gibson, who resigned as an MP with immediate effect on 5 June 2009 after being implicated in the expenses scandal. A by-election was held to replace him on 23 July 2009,[2] which was won comprehensively by the Conservative Chloe Smith.
Members of Parliament
Elections
Elections in the 2010s
| Party | Candidate | Votes | % | ± | |
|---|---|---|---|---|---|
| Conservative | Chloe Smith | 19,052 | 43.7 | +3.1 | |
| Labour | Jessica Asato | 14,589 | 33.5 | +2.0 | |
| UKIP | Glenn Tingle | 5,986 | 13.7 | +9.3 | |
| Green | Adrian Holmes | 1,939 | 4.4 | +1.5 | |
| Liberal Democrat | James Wright | 1,894 | 4.3 | -13.9 | |
| Independent | Mick Hardy[5] | 132 | 0.3 | +0.3 | |
| Majority | 4,463 | 10.2 | |||
| Turnout | 43,592 | 66.9 | +1.7 | ||
| Conservative hold | Swing | +0.6 | |||
| Party | Candidate | Votes | % | ± | |
|---|---|---|---|---|---|
| Conservative | Chloe Smith | 17,280 | 40.6 | +10.1 | |
| Labour Co-op | John Cook | 13,379 | 31.4 | −15.7 | |
| Liberal Democrat | David Stephen | 7,783 | 18.3 | +2.2 | |
| UKIP | Glenn Tingle | 1,878 | 4.4 | +2.1 | |
| Green | Jess Goldfinch | 1,245 | 2.9 | −0.3 | |
| BNP | Thomas Richardson | 747 | 1.8 | ||
| Independent | Bill Holden | 143 | 0.3 | ||
| Christian | Andrew Holland | 118 | 0.3 | ||
| Majority | 3,901 | 9.2 | |||
| Turnout | 42,573 | 65.2 | |||
| Conservative hold | Swing | +12.9 | |||
Elections in the 2000s
| Party | Candidate | Votes | % | ± | |
|---|---|---|---|---|---|
| Conservative | Chloe Smith | 13,591 | 39.5 | +6.3 | |
| Labour | Chris Ostrowski | 6,243 | 18.2 | −26.7 | |
| Liberal Democrat | April Pond | 4,803 | 14.0 | −2.2 | |
| UKIP | Glenn Tingle | 4,068 | 11.8 | +9.4 | |
| Green | Rupert Read | 3,350 | 9.7 | +7.0 | |
| Put an Honest Man into Parliament | Craig Murray | 953 | 2.8 | N/A | |
| BNP | Robert West | 941 | 2.7 | N/A | |
| Independent | Bill Holden | 166 | 0.5 | −0.2 | |
| Monster Raving Loony | Alan Hope | 144 | 0.4 | N/A | |
| NOTA | Anne Fryatt | 59 | 0.2 | N/A | |
| Libertarian | Thomas Burridge | 36 | 0.1 | N/A | |
| Independent | Peter Baggs | 23 | 0.1 | N/A | |
| Majority | 7,348 | 21.3 | +9.8 | ||
| Turnout | 34,377 | 45.9[7] | −15.2 | ||
| Conservative gain from Labour | Swing | 16.5 | |||
| Party | Candidate | Votes | % | ± | |
|---|---|---|---|---|---|
| Labour | Ian Gibson | 21,097 | 44.9 | −2.5 | |
| Conservative | James Tumbridge | 15,638 | 33.2 | −1.4 | |
| Liberal Democrat | Robin Whitmore | 7,616 | 16.2 | +1.4 | |
| Green | Adrian Holmes | 1,252 | 2.7 | +1.0 | |
| UKIP | John Youles | 1,122 | 2.4 | +1.4 | |
| Independent | Bill Holden | 308 | 0.7 | N/A | |
| Majority | 5,459 | 11.6 | |||
| Turnout | 47,033 | 61.1 | +2.0 | ||
| Labour hold | Swing | −0.6 | |||
| Party | Candidate | Votes | % | ± | |
|---|---|---|---|---|---|
| Labour | Ian Gibson | 21,624 | 47.4 | −2.3 | |
| Conservative | Kay Mason | 15,761 | 34.6 | +2.1 | |
| Liberal Democrat | Moira Toye | 6,750 | 14.8 | +2.2 | |
| Green | Rob Tinch | 797 | 1.7 | N/A | |
| UKIP | Guy Cheyney | 471 | 1.0 | N/A | |
| Independent | Michael Betts | 211 | 0.5 | N/A | |
| Majority | 5,863 | 12.8 | |||
| Turnout | 45,614 | 59.1 | −16.6 | ||
| Labour hold | Swing | −2.2 | |||
Elections in the 1990s
| Party | Candidate | Votes | % | ± | |
|---|---|---|---|---|---|
| Labour | Ian Gibson | 27,346 | 49.7 | +6.9 | |
| Conservative | Robert Kinghorn | 17,876 | 32.5 | −10.8 | |
| Liberal Democrat | Paul Young | 6,951 | 12.6 | −0.3 | |
| Referendum | Tony Bailey-Smith | 1,777 | 3.2 | N/A | |
| Legalise Cannabis | Howard Marks | 512 | 0.9 | N/A | |
| Socialist Labour | James Hood | 495 | 0.9 | N/A | |
| Natural Law | Diana Mills | 100 | 0.2 | 0.0 | |
| Majority | 9,470 | 17.2 | |||
| Turnout | 55,057 | 75.9 | −5.9 | ||
| Labour gain from Conservative | Swing | +8.8 | |||
| Party | Candidate | Votes | % | ± | |
|---|---|---|---|---|---|
| Conservative | Patrick Thompson | 22,419 | 43.3 | −2.5 | |
| Labour | Ian Gibson | 22,153 | 42.8 | +12.6 | |
| Liberal Democrat | David Harrison | 6,706 | 12.9 | −11.1 | |
| Green | Lou Betts | 433 | 0.8 | N/A | |
| Natural Law | R. Arnold | 93 | 0.2 | N/A | |
| Majority | 266 | 0.5 | −15.2 | ||
| Turnout | 51,804 | 81.8 | +2.6 | ||
| Conservative hold | Swing | −7.6 | |||
Elections in the 1980s
| Party | Candidate | Votes | % | ± | |
|---|---|---|---|---|---|
| Conservative | Patrick Thompson | 22,772 | 45.8 | +1.1 | |
| Labour | Mary Honeyball | 14,996 | 30.2 | −2.2 | |
| Liberal | Paul Thomas Nicholls | 11,922 | 24.0 | +1.4 | |
| Majority | 7,776 | 15.7 | +3.4 | ||
| Turnout | 49,690 | 79.2 | +3.0 | ||
| Conservative hold | Swing | +1.7 | |||
| Party | Candidate | Votes | % | ± | |
|---|---|---|---|---|---|
| Conservative | Patrick Thompson | 21,355 | 44.7 | +9.7 | |
| Labour | David Ennals | 15,476 | 32.4 | −18.4 | |
| Liberal | G. Jones | 10,796 | 22.6 | +10.5 | |
| Workers Revolutionary | F. Cairns | 194 | 0.4 | +0.1 | |
| Majority | 5,879 | 12.3 | |||
| Turnout | 47,821 | 76.2 | +0.6 | ||
| Conservative gain from Labour | Swing | +14.1 | |||
Elections in the 1970s
| Party | Candidate | Votes | % | ± | |
|---|---|---|---|---|---|
| Labour | David Ennals | 15,927 | 50.8 | −5.2 | |
| Conservative | P. H. Rippon | 12,336 | 35.0 | +7.7 | |
| Liberal | P. Moore | 4,253 | 12.1 | −4.7 | |
| Ecology | G. Hannah | 334 | 1.0 | N/A | |
| National Front | L. Goold | 250 | 0.7 | N/A | |
| Communist | A. Panes | 106 | 0.3 | N/A | |
| Workers Revolutionary | S. Colling | 92 | 0.3 | N/A | |
| Majority | 3,591 | 15.8 | −12.9 | ||
| Turnout | 33,298 | 75.6 | +4.4 | ||
| Labour hold | Swing | -6.5 | |||
| Party | Candidate | Votes | % | ± | |
|---|---|---|---|---|---|
| Labour | David Ennals | 17,958 | 56.0 | +7.4 | |
| Conservative | T. P. Doe | 8,754 | 27.3 | −0.6 | |
| Liberal | E. M. Wheeler | 5,378 | 16.8 | −5.3 | |
| Majority | 9,204 | 28.7 | +8.0 | ||
| Turnout | 32,090 | 71.2 | −7.7 | ||
| Labour hold | Swing | +4.0 | |||
| Party | Candidate | Votes | % | ± | |
|---|---|---|---|---|---|
| Labour | David Ennals | 17,111 | 48.6 | −10.1 | |
| Conservative | T. P. Doe | 9,817 | 27.9 | −10.3 | |
| Liberal | E. M. Wheeler | 7,773 | 22.1 | N/A | |
| National Front | G. Goold | 544 | 1.5 | N/A | |
| Majority | 7,294 | 20.7 | −0.8 | ||
| Turnout | 35,245 | 78.9 | +7.6 | ||
| Labour hold | Swing | +0.1 | |||
| Party | Candidate | Votes | % | ± | |
|---|---|---|---|---|---|
| Labour | George Wallace | 18,564 | 59.7 | −5.9 | |
| Conservative | Amédée Turner | 11,868 | 38.2 | +3.8 | |
| Independent Progressive | C. C. Fairhead | 658 | 2.1 | N/A | |
| Majority | 6,696 | 21.5 | −9.7 | ||
| Turnout | 31,090 | 71.3 | −2.9 | ||
| Labour hold | Swing | −4.9 | |||
Elections in the 1960s
| Party | Candidate | Votes | % | ± | |
|---|---|---|---|---|---|
| Labour | George Wallace | 18,777 | 65.6 | +4.7 | |
| Conservative | Amédée Turner | 9,851 | 34.4 | −4.7 | |
| Majority | 8,926 | 31.2 | +9.4 | ||
| Turnout | 28,628 | 74.2 | −0.3 | ||
| Labour hold | Swing | +4.7 | |||
| Party | Candidate | Votes | % | ± | |
|---|---|---|---|---|---|
| Labour | George Wallace | 18,111 | 60.9 | +0.7 | |
| Conservative | Amédée Turner | 11,620 | 39.1 | −0.7 | |
| Majority | 6,491 | 21.8 | +1.3 | ||
| Turnout | 29,731 | 74.5 | −2.4 | ||
| Labour hold | Swing | +0.7 | |||
Elections in the 1950s
| Party | Candidate | Votes | % | ± | |
|---|---|---|---|---|---|
| Labour | John Paton | 19,092 | 60.2 | −0.5 | |
| Conservative | D. R. Chance | 12,609 | 39.8 | +0.5 | |
| Majority | 6,483 | 20.5 | −0.9 | ||
| Turnout | 31,701 | 76.9 | +1.6 | ||
| Labour hold | Swing | −0.5 | |||
| Party | Candidate | Votes | % | ± | |
|---|---|---|---|---|---|
| Labour | John Paton | 18,682 | 60.7 | −2.0 | |
| Conservative | T. C. Eaton | 12,087 | 39.3 | +2.0 | |
| Majority | 6,595 | 21.4 | −10.1 | ||
| Turnout | 30,769 | 75.3 | −8.8 | ||
| Labour hold | Swing | −2.0 | |||
| Party | Candidate | Votes | % | ± | |
|---|---|---|---|---|---|
| Labour | John Paton | 22,880 | 62.7 | +3.5 | |
| Conservative | T. C. Eaton | 13,587 | 37.3 | +13.8 | |
| Majority | 9,293 | 25.5 | −10.2 | ||
| Turnout | 36,467 | 84.1 | −2.1 | ||
| Labour hold | Swing | −5.2 | |||
| Party | Candidate | Votes | % | ± | |
|---|---|---|---|---|---|
| Labour | John Paton | 21,898 | 59.2 | N/A | |
| Conservative | V. R. Rees | 8,704 | 23.5 | N/A | |
| Liberal | Don Bennett | 6,376 | 17.2 | N/A | |
| Majority | 13,194 | 35.7 | N/A | ||
| Turnout | 36,978 | 86.2 | N/A | ||
| Labour win (new seat) | |||||
See also
Notes and references
- Notes
- ↑ A county constituency (for the purposes of election expenses and type of returning officer)
- ↑ As with all constituencies, the constituency elects one Member of Parliament (MP) by the first past the post system of election at least every five years.
- References
- ↑ "Electorate Figures - Boundary Commission for England". 2011 Electorate Figures. Boundary Commission for England. 4 March 2011. Retrieved 13 March 2011.
- ↑ "MP quitting to force by-election". BBC News. 5 June 2009.
- ↑ Leigh Rayment's Historical List of MPs – Constituencies beginning with "N" (part 3)
- ↑ "Election Data 2015". Electoral Calculus. Archived from the original on 17 October 2015. Retrieved 17 October 2015.
- ↑ "Norwich_North_Statement_Notice_of_Poll.pdf" (PDF). Retrieved 11 April 2015.
- ↑ "Election Data 2010". Electoral Calculus. Archived from the original on 17 October 2015. Retrieved 17 October 2015.
- ↑ Sparrow, Andrew (24 July 2009). "Norwich North byelection results – live". The Guardian. London.
- ↑ "Election Data 2005". Electoral Calculus. Archived from the original on 15 October 2011. Retrieved 18 October 2015.
- ↑ "Election Data 2001". Electoral Calculus. Archived from the original on 15 October 2011. Retrieved 18 October 2015.
- ↑ "Election Data 1997". Electoral Calculus. Archived from the original on 15 October 2011. Retrieved 18 October 2015.
- ↑ "Election Data 1992". Electoral Calculus. Archived from the original on 15 October 2011. Retrieved 18 October 2015.
- ↑ Norwich North: Constituency, guardian.co.uk
- ↑ "UK General Election results April 1992". Richard Kimber's Political Science Resources. Politics Resources. 9 April 1992. Retrieved 2010-12-06.
- ↑ "Election Data 1987". Electoral Calculus. Archived from the original on 15 October 2011. Retrieved 18 October 2015.
- ↑ UK General Election results: June 1987
- ↑ "Election Data 1983". Electoral Calculus. Archived from the original on 15 October 2011. Retrieved 18 October 2015.
- ↑ UK General Election results: June 1983
- ↑ UK General Election results: May 1979
- ↑ UK General Election results: October 1974
- ↑ UK General Election results: February 1974
- ↑ UK General Election results: 1970
- ↑ UK General Election results: March 1966
- ↑ UK General Election results: October 1964
- ↑ UK General Election results: October 1959
- ↑ UK General Election results: May 1955
- ↑ UK General Election results: October 1951
- ↑ UK General Election results: February 1950
Coordinates: 52°39′N 1°18′E / 52.65°N 1.30°E