Norwich South (UK Parliament constituency)
| Norwich South | |
|---|---|
|
Borough constituency for the House of Commons | |
|
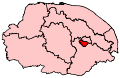
Boundary of Norwich South in Norfolk. | |
|
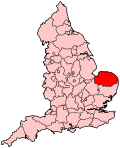
Location of Norfolk within England. | |
| County | Norfolk |
| Electorate | 73,569 (December 2010)[1] |
| Current constituency | |
| Created | 1950 |
| Member of parliament | Clive Lewis (Labour) |
| Number of members | One |
| Created from | Norwich |
| Overlaps | |
| European Parliament constituency | East of England |
Norwich South is a constituency in Norfolk represented in the House of Commons of the Parliament of the United Kingdom.[n 1] It elects one Member of Parliament (MP) by the first past the post system of election, and was created for the 1950 general election.
The constituency is currently represented by Clive Lewis of the Labour Party.[2]
Boundaries
1950-1974: The County Borough of Norwich wards of Ber Street, Conesford, Earlham, Eaton, Lakenham, Nelson, St Stephen, and Town Close.
1974-1983: The County Borough of Norwich wards of Bowthorpe, Earlham, Eaton, Lakenham, Mancroft, Nelson, St Stephen, and Town Close.
1983-1997: The City of Norwich wards of Bowthorpe, Eaton, Heigham, Henderson, Lakenham, Mancroft, Nelson, St Stephen, Thorpe Hamlet, Town Close, and University.
1997-2010: The City of Norwich wards of Bowthorpe, Eaton, Heigham, Henderson, Lakenham, Mancroft, Nelson, St Stephen, Thorpe Hamlet, Town Close, and University; the District of Broadland ward of Brundall; and the District of South Norfolk wards of Cringleford and Colney, and New Costessey.
2010–present: The City of Norwich wards of Bowthorpe, Eaton, Lakenham, Mancroft, Nelson, Thorpe Hamlet, Town Close, University, and Wensum, and the District of South Norfolk ward of New Costessey.
The constituency is one of two covering the city of Norwich, the other being Norwich North.
- 2010 Changes
Following their review of parliamentary constituencies in Norfolk that concluded in 2004, the Boundary Commission for England created a slightly modified Norwich South constituency. The changes took effect at the 2010 general election.
Changes were necessary in order to re-align the constituency boundaries with the new local government ward boundaries introduced in South Norfolk and Norwich in 2003 and 2004 respectively. Norfolk also received an additional, ninth constituency, by the Boundary Commission. The part of the Crome ward around Morse Road became part of Norwich North, while the area around Mousehold Street in Thorpe Hamlet moved into Norwich South. The villages of Cringleford and Colney were lost to South Norfolk constituency. Brundall ward, which was from 1997 to 2010 within the boundaries of this constituency, went to the new seat of Broadland.
History
The constituency was created for the 1950 general election, when the 2-seat Norwich constituency was divided into Norwich North and Norwich South. The Labour MP for this seat from 1997 to 2010 was Charles Clarke who served in cabinet for five years from 2001 to 2006, first as Minister without Portfolio, then as Secretary of State for Education and Skills and latterly as Home Secretary.
Norwich South was by far Labour's safest seat in Norfolk throughout the Thatcher years and up until 2005. Although it was lost to the Conservatives in 1983, it was regained by Labour in 1987 and was the only Labour seat in Norfolk until 1997. In 2005 the Labour majority was cut by over 5000 leaving Norwich North as the safest Labour seat in the county.
The seat was considered a true three way marginal in the 2010 election between the incumbent Labour party the Liberal Democrats and the Conservatives. The seat was also targeted by the Green Party. The seat was won by the Liberal Democrats with the lowest percentage share of the vote in a constituency in the 2010 election. The loss was considered to be an embarrassment for the Labour Party as it was the seat of a former Home Secretary.
In the 2015 election, Norwich South was the Green Party's number one target seat, and due to the tiny majority of just 310 votes for the Liberal Democrat Simon Wright over Labour in the previous election, was a key Labour target. In the event, Wright came fourth with under half his 2010 vote, behind the Greens, Conservatives and Labour, whose left-wing candidate Clive Lewis won the seat with a 10.6% swing from the Liberal Democrats to Labour. The Green Party share of the vote actually fell by 1% compared to 2010, with the Conservative vote slightly increasing.
Members of Parliament
Elections
Elections in the 2010s
| Party | Candidate | Votes | % | ± | |
|---|---|---|---|---|---|
| Labour | Clive Lewis | 19,033 | 39.3 | +10.6 | |
| Conservative | Lisa Townsend | 11,379 | 23.5 | +0.6 | |
| Green | Lesley Grahame | 6,749 | 13.9 | -1.0 | |
| Liberal Democrat | Simon Wright | 6,607 | 13.6 | -15.7 | |
| UKIP | Steve Emmens[5] | 4,539 | 9.4 | +7.0 | |
| Class War | David Peel | 96 | 0.2 | N/A | |
| Independent | Cengiz Ceker | 60 | 0.1 | N/A | |
| Majority | 7,654 | 15.8 | |||
| Turnout | 48,463 | 64.7 | +0.1 | ||
| Labour gain from Liberal Democrat | Swing | +5.0 | |||
| Party | Candidate | Votes | % | ± | |
|---|---|---|---|---|---|
| Liberal Democrat | Simon Wright | 13,960 | 29.4 | −0.6 | |
| Labour | Charles Clarke | 13,650 | 28.7 | −8.7 | |
| Conservative | Antony D. Little | 10,902 | 22.9 | +1.1 | |
| Green | Adrian Ramsay | 7,095 | 14.9 | +7.5 | |
| UKIP | Stephen Emmens | 1,145 | 2.4 | +0.9 | |
| BNP | Len Heather | 697 | 1.5 | N/A | |
| Workers Revolutionary | Gabriel Polley | 102 | 0.2 | 0.0 | |
| Majority | 310 | 0.7 | |||
| Turnout | 47,551 | 64.6 | +5.6 | ||
| Liberal Democrat gain from Labour | Swing | 4.0 | |||
*NB changes in vote share from 2005 are notional due to boundary changes.
Elections in the 2000s
| Party | Candidate | Votes | % | ± | |
|---|---|---|---|---|---|
| Labour | Charles Clarke | 15,904 | 37.7 | −7.8 | |
| Liberal Democrat | Andrew P. Aalders-Dunthorne | 12,251 | 29.0 | +6.4 | |
| Conservative | Antony D. Little | 9,567 | 22.7 | −2.1 | |
| Green | Adrian Ramsay | 3,101 | 7.4 | +4.0 | |
| UKIP | Miss Vandra S. Ahlstrom | 597 | 1.4 | +0.3 | |
| English Democrat | Mrs. Christine Constable | 466 | 1.1 | N/A | |
| Legalise Cannabis | Don E. Barnard | 219 | 0.5 | −1.0 | |
| Workers Revolutionary | Roger A. Blackwell | 85 | 0.2 | N/A | |
| Majority | 3,653 | 8.7 | |||
| Turnout | 42,190 | 65.0 | +5.2 | ||
| Labour hold | Swing | −7.1 | |||
| Party | Candidate | Votes | % | ± | |
|---|---|---|---|---|---|
| Labour | Charles Clarke | 19,367 | 45.5 | −6.2 | |
| Conservative | Andrew John French | 10,551 | 24.8 | +1.1 | |
| Liberal Democrat | Andrew Paul Aalders-Dunthorne | 9,640 | 22.6 | +4.0 | |
| Green | Adrian St. J. Holmes | 1,434 | 3.4 | +1.9 | |
| Legalise Cannabis | Alun Buffrey | 620 | 1.5 | 0.0 | |
| Socialist Alliance | Edward David Manningham | 507 | 1.2 | N/A | |
| UKIP | Tarquin Alexander Graham Mills | 473 | 1.1 | N/A | |
| Majority | 8,816 | 20.7 | |||
| Turnout | 42,592 | 59.8 | −12.8 | ||
| Labour hold | Swing | ||||
Elections in the 1990s
| Party | Candidate | Votes | % | ± | |
|---|---|---|---|---|---|
| Labour | Charles Clarke | 26,267 | 51.7 | +3.0 | |
| Conservative | Bashir Khanbhai | 12,028 | 23.7 | −12.9 | |
| Liberal Democrat | Andrew P. Aalders-Dunthorne | 9,457 | 18.6 | +5.7 | |
| Referendum | David K. Holdsworth | 1,464 | 2.9 | N/A | |
| Legalise Cannabis | Howard Marks | 765 | 1.5 | N/A | |
| Green | Adrian St. J. Holmes | 736 | 1.4 | −0.2 | |
| Natural Law | Bryan A. Parsons | 84 | 0.2 | 0.0 | |
| Majority | 14,239 | 28.0 | |||
| Turnout | 50,801 | 72.6 | −8.0 | ||
| Labour hold | Swing | +8.0 | |||
| Party | Candidate | Votes | % | ± | |
|---|---|---|---|---|---|
| Labour | John Garrett | 24,965 | 48.7 | +10.8 | |
| Conservative | David S. Baxter | 18,784 | 36.6 | −0.6 | |
| Liberal Democrat | Christopher Thomas | 6,609 | 12.9 | −12.0 | |
| Green | Adrian St. J. Holmes | 803 | 1.6 | N/A | |
| Natural Law | Bryan A. Parsons | 104 | 0.2 | N/A | |
| Majority | 6,181 | 12.1 | +11.4 | ||
| Turnout | 51,265 | 80.6 | +0.0 | ||
| Labour hold | Swing | +5.7 | |||
Elections in the 1980s
| Party | Candidate | Votes | % | ± | |
|---|---|---|---|---|---|
| Labour | John Garrett | 19,666 | 37.9 | +2.6 | |
| Conservative | John Powley | 19,330 | 37.3 | −1.5 | |
| Social Democratic | Charles Jeremy Mawdesley Hardie | 12,896 | 24.9 | +0.4 | |
| Majority | 336 | 0.7 | |||
| Turnout | 51,892 | 80.6 | +4.2 | ||
| Labour gain from Conservative | Swing | +2.1 | |||
| Party | Candidate | Votes | % | ± | |
|---|---|---|---|---|---|
| Conservative | John Powley | 18,998 | 38.8 | −2.8 | |
| Labour | John Garrett | 17,286 | 35.3 | −9.6 | |
| Social Democratic | Charles Jeremy Mawdesley Hardie | 11,968 | 24.5 | N/A | |
| Ecology | Antony D. Carter | 468 | 1.0 | N/A | |
| National Front | Peter C. Williams | 145 | 0.3 | −0.4 | |
| Independent | Jon C. Ward | 91 | 0.2 | N/A | |
| Majority | 1,712 | 3.5 | |||
| Turnout | 48,956 | 76.4 | −3.8 | ||
| Conservative gain from Labour | Swing | +3.4 | |||
Elections in the 1970s
| Party | Candidate | Votes | % | ± | |
|---|---|---|---|---|---|
| Labour | John Garrett | 16,240 | 44.9 | −2.2 | |
| Conservative | I. Coutts | 15,042 | 41.6 | +4.1 | |
| Liberal | P. Mackintosh | 4,618 | 12.8 | −2.6 | |
| National Front | Andrew Fountaine | 264 | 0.7 | N/A | |
| Majority | 1,198 | 3.3 | |||
| Turnout | 36,164 | 80.2 | +1.7 | ||
| Labour hold | Swing | −3.2 | |||
| Party | Candidate | Votes | % | ± | |
|---|---|---|---|---|---|
| Labour | John Garrett | 16,590 | 47.1 | +5.8 | |
| Conservative | M. Tomison | 13,185 | 37.5 | −2.0 | |
| Liberal | P.G. Smith | 5,429 | 15.4 | −3.9 | |
| Majority | 3,405 | 9.7 | |||
| Turnout | 35,204 | 78.5 | −5.5 | ||
| Labour hold | Swing | +3.9 | |||
| Party | Candidate | Votes | % | ± | |
|---|---|---|---|---|---|
| Labour | John Garrett | 15,393 | 41.3 | −3.4 | |
| Conservative | Thomas Stuttaford | 14,741 | 39.5 | −7.5 | |
| Liberal | L. Parker | 7,183 | 19.3 | +11.0 | |
| Majority | 652 | 1.8 | |||
| Turnout | 37,317 | 84.0 | +5.8 | ||
| Labour gain from Conservative | Swing | +2.1 | |||
| Party | Candidate | Votes | % | ± | |
|---|---|---|---|---|---|
| Conservative | Thomas Stuttaford | 17,067 | 47.0 | +1.8 | |
| Labour | C.F. Ascher | 16,241 | 44.7 | −10.1 | |
| Liberal | L. Parker | 3,031 | 8.3 | N/A | |
| Majority | 826 | 2.3 | |||
| Turnout | 36,339 | 78.2 | −5.0 | ||
| Conservative gain from Labour | Swing | +6.0 | |||
Elections in the 1960s
| Party | Candidate | Votes | % | ± | |
|---|---|---|---|---|---|
| Labour | Christopher Norwood | 19,163 | 54.8 | +3.9 | |
| Conservative | A.R. Gurney | 15,808 | 45.2 | −3.9 | |
| Majority | 3,355 | 9.6 | |||
| Turnout | 34,971 | 83.2 | +3.9 | ||
| Labour hold | Swing | +3.9 | |||
| Party | Candidate | Votes | % | ± | |
|---|---|---|---|---|---|
| Labour | Christopher Norwood | 17,973 | 50.9 | +4.0 | |
| Conservative | Geoffrey Rippon | 17,362 | 49.1 | −4.0 | |
| Majority | 611 | 1.7 | |||
| Turnout | 35,335 | 82.7 | +3.9 | ||
| Labour gain from Conservative | Swing | +4.0 | |||
Elections in the 1950s
| Party | Candidate | Votes | % | ± | |
|---|---|---|---|---|---|
| Conservative | Geoffrey Rippon | 19,128 | 53.1 | +0.6 | |
| Labour | George Wallace | 16,884 | 46.9 | −0.6 | |
| Majority | 2,244 | 6.2 | |||
| Turnout | 36,012 | 82.2 | +3.9 | ||
| Conservative hold | Swing | +0.6 | |||
| Party | Candidate | Votes | % | ± | |
|---|---|---|---|---|---|
| Conservative | Geoffrey Rippon | 18,659 | 52.5 | +0.0 | |
| Labour | M.P. Tylecote | 16,901 | 47.5 | +0.0 | |
| Majority | 1,758 | 4.9 | |||
| Turnout | 35,560 | 78.3 | −6.0 | ||
| Conservative hold | Swing | +0.0 | |||
| Party | Candidate | Votes | % | ± | |
|---|---|---|---|---|---|
| Conservative | Henry Strauss | 19,082 | 52.5 | −0.8 | |
| Labour | M.P. Tylecote | 17,234 | 47.5 | +0.8 | |
| Majority | 1,848 | 5.1 | |||
| Turnout | 36,316 | 84.3 | −0.7 | ||
| Conservative hold | Swing | −0.8 | |||
| Party | Candidate | Votes | % | ± | |
|---|---|---|---|---|---|
| Conservative | Henry Strauss | 18,693 | 53.3 | N/A | |
| Labour | M.P. Tylecote | 16,368 | 46.7 | N/A | |
| Majority | 2,325 | 6.6 | N/A | ||
| Turnout | 35,061 | 85.0 | N/A | ||
| Conservative win (new seat) | |||||
See also
- List of Parliamentary constituencies in Norfolk
- Opinion polling for the next United Kingdom general election in individual constituencies
Notes
- ↑ A borough constituency (for the purposes of election expenses and type of returning officer)
References
- ↑ "Electorate Figures - Boundary Commission for England". 2011 Electorate Figures. Boundary Commission for England. 4 March 2011. Retrieved 13 March 2011.
- ↑ "Norwich South". BBC News. Retrieved 8 May 2015.
- ↑ Leigh Rayment's Historical List of MPs – Constituencies beginning with "N" (part 3)
- ↑ "Election Data 2015". Electoral Calculus. Archived from the original on 17 October 2015. Retrieved 17 October 2015.
- ↑ http://ukpollingreport.co.uk/2015guide/norwichsouth/
- ↑ "Election Data 2010". Electoral Calculus. Archived from the original on 17 October 2015. Retrieved 17 October 2015.
- ↑ "Election Data 2005". Electoral Calculus. Archived from the original on 15 October 2011. Retrieved 18 October 2015.
- ↑ "Election Data 2001". Electoral Calculus. Archived from the original on 15 October 2011. Retrieved 18 October 2015.
- ↑ "Election Data 1997". Electoral Calculus. Archived from the original on 15 October 2011. Retrieved 18 October 2015.
- ↑ "Norwich South". guardian.co.uk.
- ↑ "Election Data 1992". Electoral Calculus. Archived from the original on 15 October 2011. Retrieved 18 October 2015.
- ↑ "UK General Election results April 1992". Richard Kimber's Political Science Resources. Politics Resources. 9 April 1992. Retrieved 2010-12-06.
- ↑ "Election Data 1987". Electoral Calculus. Archived from the original on 15 October 2011. Retrieved 18 October 2015.
- ↑ "Election Data 1983". Electoral Calculus. Archived from the original on 15 October 2011. Retrieved 18 October 2015.
Coordinates: 52°37′N 1°16′E / 52.62°N 1.27°E