South West Bedfordshire (UK Parliament constituency)
Coordinates: 51°57′29″N 0°29′28″W / 51.958°N 0.491°W
| South West Bedfordshire | |
|---|---|
|
County constituency for the House of Commons | |
|
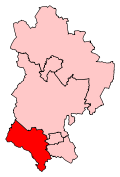
Boundary of South West Bedfordshire in Bedfordshire. | |
|
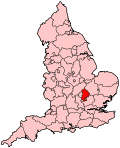
Location of Bedfordshire within England. | |
| County | Bedfordshire |
| Electorate | 76,178 (December 2010)[1] |
| Major settlements | Dunstable, Leighton Buzzard and Houghton Regis |
| Current constituency | |
| Created | 1983 |
| Member of parliament | Andrew Selous (Conservative) |
| Number of members | One |
| Created from | South Bedfordshire |
| Overlaps | |
| European Parliament constituency | East of England |
South West Bedfordshire is a constituency represented in the House of Commons of the UK Parliament.[n 1] As with all constituencies of the UK Parliament, it elects one Member of Parliament by the first past the post system of election.
The serving Member since 2001 is Conservative Andrew Selous, who succeeded Conservative David Madel. Selous has been re-elected three times: in 2005, 2010, and 2015.
History
The constituency was created in 1983, mostly from the former seat of South Bedfordshire. It was represented by Sir David Madel, a Conservative, from its creation until his retirement in 2001; he almost suffered one of the biggest upsets of the 1997 general election, when the Labour Party's candidate spectacularly cut his majority from 21,273 to just 132.
The present Conservative MP for the seat is Andrew Selous; he won the seat in 2001, when he managed to increase the party's majority, but only just: this increased somewhat more substantially each time in 2005 and 2010, ultimately to more than 16,000. The 2010 election also saw the second-placed candidate's party change, to the Liberal Democrats, similar to the results of 1983 and 1987, when this was the joint platform for R. Byfield and J.R. Burrow respectively, the (SDP-Liberal Alliance).
Boundaries
1983-1997: The District of South Bedfordshire wards of Beaudesert, Brooklands, Dunstable Central, Eaton Bray, Heath and Reach, Hockliffe, Houghton Central, Houghton East, Houghton South, Icknield, Kensworth, Linslade, Northfields, Plantation, Priory, Southcott, Stanbridge, Studham, Totternhoe, and Watling, and the District of Mid Bedfordshire wards of Aspley, Cranfield, Marston, and Woburn.
1997-2010: The District of South Bedfordshire wards of Beaudesert, Brooklands, Dunstable Central, Eaton Bray, Heath and Reach, Hockliffe, Houghton Central, Houghton East, Houghton South, Icknield, Kensworth, Linslade, Northfields, Plantation, Priory, Southcott, Stanbridge, Studham, Totternhoe, and Watling.
2010-present: The District of South Bedfordshire wards of All Saints, Chiltern, Dunstable Central, Eaton Bray, Grovebury, Heath and Reach, Houghton Hall, Icknield, Kensworth and Totternhoe, Linslade, Manshead, Northfields, Parkside, Planets, Plantation, Southcott, Stanbridge, Tithe Farm, and Watling.
Constituency profile
At the time of the 2011 Census, the population of the constituency of South West Bedfordshire was recorded as 102,031 persons, of whom 50,277 were male, and 51,754 were female.[2] 74.30% of usual residents aged 16-74 are economically active, including 4.22% unemployed. A further 13.27% of the population are retired (lower than both the regional average of 14.4% and national average of 13.7%), and 3.75% are students.[3] A statistical compilation by The Guardian showed unemployment benefits claimants in the constituency for April 2013 were 3.3% of the population, lower than the regional average of 3.6%.[4]
Turnout at the 2015 General Election was 51,304, or 64.4% of those eligible to vote; lower than the national turnout of 66.4%.[5][6]
Members of Parliament
| Election | Member[7] | Party | |
|---|---|---|---|
| 1983 | Sir David Madel | Conservative | |
| 2001 | Andrew Selous | Conservative | |
Elections
Elections in the 2010s
| Party | Candidate | Votes | % | ± | |
|---|---|---|---|---|---|
| Conservative | Andrew Selous [9] | 28,212 | 55.0 | +2.2 | |
| Labour | Daniel Scott [9] | 10,399 | 20.3 | +0.7 | |
| UKIP | John van Weenen [10] | 7,941 | 15.5 | +11.3 | |
| Liberal Democrat | Stephen Rutherford [11] | 2,646 | 5.2 | −14.9 | |
| Green | Emily Lawrence [12] | 2,106 | 4.1 | N/A | |
| Majority | 17,813 | 34.7 | |||
| Turnout | 51,304 | 64.4 | |||
| Conservative hold | Swing | ||||
| Party | Candidate | Votes | % | ± | |
|---|---|---|---|---|---|
| Conservative | Andrew Selous | 26,815 | 52.8 | +4.5 | |
| Liberal Democrat | Rod Cantrill | 10,166 | 20.0 | +3.2 | |
| Labour | Jenny Bone | 9,948 | 19.6 | −10.6 | |
| UKIP | Martin Newman | 2,142 | 4.2 | +0.0 | |
| BNP | Mark Tolman | 1,703 | 3.4 | N/A | |
| Majority | 16,649 | 32.8 | |||
| Turnout | 50,774 | 66.3 | +3.5 | ||
| Conservative hold | Swing | +0.7 | |||
Elections in the 2000s
| Party | Candidate | Votes | % | ± | |
|---|---|---|---|---|---|
| Conservative | Andrew Selous | 22,114 | 48.3 | +6.2 | |
| Labour | Joyce Edna Still | 13,837 | 30.2 | −10.2 | |
| Liberal Democrat | Andrew Mark Strange | 7,723 | 16.9 | +2.1 | |
| UKIP | Tom Wise | 1,923 | 4.2 | +1.5 | |
| Open-Forum | Kenson Felix Francis Gurney | 217 | 0.5 | N/A | |
| Majority | 8,277 | 18.1 | |||
| Turnout | 61.8 | ||||
| Conservative hold | Swing | ||||
| Party | Candidate | Votes | % | ± | |
|---|---|---|---|---|---|
| Conservative | Andrew Selous | 18,477 | 42.1 | +1.4 | |
| Labour | Andrew Richard Date | 17,701 | 40.4 | −0.1 | |
| Liberal Democrat | Martin James Pantling | 6,473 | 14.8 | +0.5 | |
| UKIP | Tom Wise | 1,203 | 2.7 | +1.9 | |
| Majority | 776 | 1.7 | |||
| Turnout | 43,854 | 62.1 | −13.7 | ||
| Conservative hold | Swing | +0.7 | |||
Elections in the 1990s
| Party | Candidate | Votes | % | ± | |
|---|---|---|---|---|---|
| Conservative | David Madel | 21,534 | 40.7 | −15.5 | |
| Labour | Andrew Richard Date | 21,402 | 40.5 | +14.7 | |
| Liberal Democrat | Stephen Henry Martin Owen | 7,559 | 14.3 | −2.3 | |
| Referendum | Mrs. Rosalind Hill | 1,761 | 3.3 | N/A | |
| UKIP | Tom Wise | 446 | 0.8 | N/A | |
| Natural Law | Alexander Le Carpentier | 162 | 0.3 | −0.1 | |
| Majority | 132 | 0.2 | |||
| Turnout | 52,864 | 75.8 | |||
| Conservative hold | Swing | −16.1 | |||
| Party | Candidate | Votes | % | ± | |
|---|---|---|---|---|---|
| Conservative | David Madel | 37,498 | 57.1 | −1.0 | |
| Labour | Barry Edward Elliott | 16,225 | 24.7 | +6.5 | |
| Liberal Democrat | Mark John Freeman | 10,988 | 16.7 | −5.5 | |
| Green | Peter John Rollings | 689 | 1.0 | −0.3 | |
| Natural Law | John Dobie Gilmour | 239 | 0.4 | N/A | |
| Majority | 21,273 | 32.4 | −3.5 | ||
| Turnout | 65,639 | 81.9 | +3.6 | ||
| Conservative hold | Swing | −3.7 | |||
Elections in the 1980s
| Party | Candidate | Votes | % | ± | |
|---|---|---|---|---|---|
| Conservative | David Madel | 36,140 | 58.2 | +3.2 | |
| Social Democratic | John Richard Burrow | 13,835 | 22.3 | −5.5 | |
| Labour | Paul Howard Dimoldenberg | 11,352 | 18.3 | +1.1 | |
| Green | Peter John Rollings | 822 | 1.3 | N/A | |
| Majority | 22,305 | 35.9 | |||
| Turnout | 62,149 | 78.7 | |||
| Conservative hold | Swing | ||||
| Party | Candidate | Votes | % | ± | |
|---|---|---|---|---|---|
| Conservative | David Madel | 31,767 | 55.0 | N/A | |
| Social Democratic | Richard Byfield | 16,036 | 27.8 | N/A | |
| Labour | William Cochrane | 9,899 | 17.2 | N/A | |
| Majority | 15,731 | 27.2 | N/A | ||
| Turnout | 57,702 | 75.6 | N/A | ||
| Conservative win (new seat) | |||||
See also
Notes and references
Notes
- ↑ South West Bedfordshire is a county constituency (for the purposes of election expenses and type of returning officer).
References
- ↑ "Electorate Figures - Boundary Commission for England". 2011 Electorate Figures. Boundary Commission for England. 4 March 2011. Archived from the original on November 6, 2010. Retrieved 13 March 2011.
- ↑ "Key Figures for 2011 Census: Key Statistics". Office for National Statistics. Retrieved 22 May 2016.
- ↑ "Key Figures for 2011 Census: Economic Activity". Office for National Statistics. Retrieved 24 May 2016.
- ↑ "Unemployment: the key UK data and benefit claimants for every constituency". The Guardian. Retrieved 24 May 2016.
- 1 2 "Statement Of Persons Nominated And Notice Of Poll" (PDF). Acting Returning Officer. 9 April 2015. Retrieved 14 April 2015.
- ↑ "The May 2015 UK elections: Report on the administration of the 7 May 2015 elections, including the UK Parliamentary general election" (PDF). p. 3.
- ↑ Leigh Rayment's Historical List of MPs – Constituencies beginning with "B" (part 2)
- ↑ "Election Data 2015". Electoral Calculus. Archived from the original on 17 October 2015. Retrieved 17 October 2015.
- 1 2 "UK ELECTION RESULTS". electionresults.blogspot.co.uk.
- ↑ "2015 Parliamentary Adopted Candidates". myukip.com. Retrieved 27 March 2015.
- ↑ "List of selected candidates". Liberal Democrats.
- ↑ "Bedfordshire South West parliamentary constituency - Election 2015 - BBC News". bbc.co.uk. Retrieved 13 April 2015.
- ↑ "Election Data 2010". Electoral Calculus. Archived from the original on 17 October 2015. Retrieved 17 October 2015.
- ↑ http://www.centralbedfordshire.gov.uk/images/South%20Beds%20Statement%20of%20Nomination_tcm5-27595.pdf
- ↑ "Election Data 2005". Electoral Calculus. Archived from the original on 15 October 2011. Retrieved 18 October 2015.
- ↑ "Election Data 2001". Electoral Calculus. Archived from the original on 15 October 2011. Retrieved 18 October 2015.
- ↑ "Election Data 1997". Electoral Calculus. Archived from the original on 15 October 2011. Retrieved 18 October 2015.
- ↑ "Bedfordshire South West". politicsresources.net.
- ↑ "Election Data 1992". Electoral Calculus. Archived from the original on 15 October 2011. Retrieved 18 October 2015.
- ↑ "Politics Resources". Election 1992. Politics Resources. 9 April 1992. Retrieved 6 Dec 2010.
- ↑ "Election Data 1987". Electoral Calculus. Archived from the original on 15 October 2011. Retrieved 18 October 2015.
- ↑ "UK General Election results: June 1987 [Archive]". politicsresources.net.
- ↑ "Election Data 1983". Electoral Calculus. Archived from the original on 15 October 2011. Retrieved 18 October 2015.
- ↑ "UK General Election results: June 1983 [Archive]". politicsresources.net.