Glenn County, California
| Glenn County, California | |||||
|---|---|---|---|---|---|
| County | |||||
| County of Glenn | |||||
Images, from top down, left to right: A view from Interstate 5 in Glenn County, a scene in Willows, Gianella Bridge | |||||
| |||||
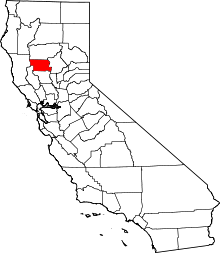 Location in the U.S. state of California | |||||
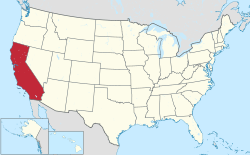 California's location in the United States | |||||
| Country |
| ||||
| State |
| ||||
| Region | Sacramento Valley | ||||
| Incorporated | 1891 | ||||
| County seat | Willows | ||||
| Largest city | Orland | ||||
| Area | |||||
| • Total | 1,327 sq mi (3,440 km2) | ||||
| • Land | 1,314 sq mi (3,400 km2) | ||||
| • Water | 13 sq mi (30 km2) | ||||
| Highest elevation[1] | 7,451 ft (2,271 m) | ||||
| Population (April 1, 2010)[2] | |||||
| • Total | 28,122 | ||||
| • Estimate (2015)[2] | 28,017 | ||||
| • Density | 21/sq mi (8.2/km2) | ||||
| Time zone | Pacific Standard Time (UTC-8) | ||||
| • Summer (DST) | Pacific Daylight Time (UTC-7) | ||||
| Area code | 530 | ||||
| FIPS code | 06-021 | ||||
| GNIS feature ID | 277275 | ||||
| Website | Glenn County, California | ||||


.jpg)
Glenn County is a county in the U.S. state of California. As of the 2010 census, the population was 28,122.[2] The county seat is Willows.[3] It is located in the California Central Valley.
History
Glenn County was formed in 1891 from parts of Colusa County. It was named for Hugh J. Glenn, who was the largest wheat farmer in the state during his lifetime, and a man of great prominence in political and commercial life in California.[4][5]
Geography
According to the U.S. Census Bureau, the county has a total area of 1,327 square miles (3,440 km2), of which 1,314 square miles (3,400 km2) is land and 13 square miles (34 km2) (1.0%) is water.[6]
Adjacent counties
- Colusa County - south
- Lake County - southwest
- Mendocino County - west
- Tehama County - north
- Butte County - east
National protected areas
- Mendocino National Forest (part)
- Sacramento National Wildlife Refuge (part)
- Sacramento River National Wildlife Refuge (part)
Demographics
2011
| Population, race, and income | |||||
|---|---|---|---|---|---|
| Total population[7] | 28,027 | ||||
| White[7] | 21,943 | 78.3% | |||
| Black or African American[7] | 261 | 0.9% | |||
| American Indian or Alaska Native[7] | 768 | 2.7% | |||
| Asian[7] | 645 | 2.3% | |||
| Native Hawaiian or other Pacific Islander[7] | 9 | 0.0% | |||
| Some other race[7] | 3,460 | 12.3% | |||
| Two or more races[7] | 941 | 3.4% | |||
| Hispanic or Latino (of any race)[8] | 10,270 | 36.6% | |||
| Per capita income[9] | $21,254 | ||||
| Median household income[10] | $43,239 | ||||
| Median family income[11] | $51,067 | ||||
Places by population, race, and income
| Places by population and race | ||||||||
|---|---|---|---|---|---|---|---|---|
| Place | Type[12] | Population[7] | White[7] | Other[7] [note 1] |
Asian[7] | Black or African American[7] |
Native American[7] [note 2] |
Hispanic or Latino (of any race)[8] |
| Artois | CDP | 189 | 87.8% | 12.2% | 0.0% | 0.0% | 0.0% | 12.2% |
| Elk Creek | CDP | 89 | 93.3% | 3.4% | 0.0% | 0.0% | 3.4% | 3.4% |
| Hamilton City | CDP | 1,992 | 66.1% | 32.4% | 0.0% | 1.5% | 0.0% | 91.1% |
| Orland | City | 7,214 | 79.6% | 18.0% | 1.1% | 0.1% | 1.2% | 43.2% |
| Willows | City | 6,190 | 76.5% | 12.7% | 4.8% | 2.2% | 3.8% | 27.4% |
| Places by population and income | |||||
|---|---|---|---|---|---|
| Place | Type[12] | Population[13] | Per capita income[9] | Median household income[10] | Median family income[11] |
| Artois | CDP | 189 | $27,344 | $70,288 | $70,288 |
| Elk Creek | CDP | 89 | $19,307 | $28,333 | $56,250 |
| Hamilton City | CDP | 1,992 | $11,825 | $29,458 | $30,669 |
| Orland | City | 7,214 | $17,372 | $45,186 | $51,577 |
| Willows | City | 6,190 | $20,484 | $43,493 | $50,694 |
2010
| Historical population | |||
|---|---|---|---|
| Census | Pop. | %± | |
| 1900 | 5,150 | — | |
| 1910 | 7,172 | 39.3% | |
| 1920 | 11,853 | 65.3% | |
| 1930 | 10,935 | −7.7% | |
| 1940 | 12,195 | 11.5% | |
| 1950 | 15,448 | 26.7% | |
| 1960 | 17,245 | 11.6% | |
| 1970 | 17,521 | 1.6% | |
| 1980 | 21,350 | 21.9% | |
| 1990 | 24,798 | 16.1% | |
| 2000 | 26,453 | 6.7% | |
| 2010 | 28,122 | 6.3% | |
| Est. 2015 | 28,017 | [14] | −0.4% |
| U.S. Decennial Census[15] 1790–1960[16] 1900–1990[17] 1990–2000[18] 2010–2015[2] | |||
The 2010 United States Census reported that Glenn County had a population of 28,122. The racial makeup of Glenn County was 19,990 (71.1%) White, 231 (0.8%) African American, 619 (2.2%) Native American, 722 (2.6%) Asian, 24 (0.1%) Pacific Islander, 5,522 (19.6%) from other races, and 1,014 (3.6%) from two or more races. Hispanic or Latino of any race were 10,539 persons (37.5%).[19]
| Population reported at 2010 United States Census | |||||||||
|---|---|---|---|---|---|---|---|---|---|
Population | American | American | | Islander | races | more races | or Latino (of any race) | ||
| Glenn County | 28,122 | 19,990 | 231 | 619 | 722 | 24 | 5,522 | 1,014 | 10,539 |
cities | Population | American | American | | Islander | races | more races | or Latino (of any race) | |
| Orland | 7,291 | 4,828 | 37 | 122 | 208 | 1 | 1,833 | 262 | 3,269 |
| Willows | 6,166 | 4,304 | 78 | 138 | 312 | 11 | 1,099 | 224 | 2,020 |
places | Population | American | American | | Islander | races | more races | or Latino (of any race) | |
| Artois | 295 | 245 | 0 | 8 | 3 | 0 | 25 | 14 | 54 |
| Elk Creek | 163 | 144 | 0 | 7 | 1 | 0 | 8 | 3 | 8 |
| Hamilton City | 1,759 | 834 | 18 | 23 | 15 | 0 | 804 | 65 | 1,489 |
communities | Population | American | American | | Islander | races | more races | or Latino (of any race) | |
| All others not CDPs (combined) | 12,448 | 9,635 | 98 | 321 | 183 | 12 | 1,753 | 446 | 3,699 |
2000
As of the census[20] of 2000, there were 26,453 people, 9,172 households, and 6,732 families residing in the county. The population density was 20 people per square mile (8/km²). There were 9,982 housing units at an average density of 8 per square mile (3/km²). The racial makeup of the county was 71.8% White, 0.6% Black or African American, 2.1% Native American, 3.4% Asian, 0.1% Pacific Islander, 18.2% from other races, and 3.9% from two or more races. 29.6% of the population were Hispanic or Latino of any race. 10.8% were of German, 9.4% American, 6.2% English and 5.9% Irish ancestry according to Census 2000. 69.5% spoke English, 27.0% Spanish and 2.1% Hmong as their first language.
There were 9,172 households out of which 38.1% had children under the age of 18 living with them, 56.7% were married couples living together, 10.9% had a female householder with no husband present, and 26.6% were non-families. 22.0% of all households were made up of individuals and 10.7% had someone living alone who was 65 years of age or older. The average household size was 2.84 and the average family size was 3.33.
In the county the population was spread out with 30.8% under the age of 18, 8.7% from 18 to 24, 26.8% from 25 to 44, 20.7% from 45 to 64, and 13.0% who were 65 years of age or older. The median age was 34 years. For every 100 females there were 102.2 males. For every 100 females age 18 and over, there were 99.5 males.
The median income for a household in the county was $32,107, and the median income for a family was $37,023. Males had a median income of $29,480 versus $21,766 for females. The per capita income for the county was $14,069. About 12.5% of families and 18.1% of the population were below the poverty line, including 26.3% of those under age 18 and 7.6% of those age 65 or over.
Politics
Voter registration
| Population and registered voters | ||
|---|---|---|
| Total population[7] | 28,027 | |
| Registered voters[21][note 3] | 12,266 | 43.8% |
| Democratic[21] | 3,761 | 30.7% |
| Republican[21] | 5,534 | 45.1% |
| Democratic–Republican spread[21] | -1,773 | -14.4% |
| Independent[21] | 461 | 3.8% |
| Green[21] | 41 | 0.3% |
| Libertarian[21] | 74 | 0.6% |
| Peace and Freedom[21] | 45 | 0.4% |
| Americans Elect[21] | 0 | 0.0% |
| Other[21] | 31 | 0.3% |
| No party preference[21] | 2,319 | 18.9% |
Cities by population and voter registration
| Cities by population and voter registration | |||||||
|---|---|---|---|---|---|---|---|
| City | Population[7] | Registered voters[21] [note 3] |
Democratic[21] | Republican[21] | D–R spread[21] | Other[21] | No party preference[21] |
| Orland | 7,214 | 40.6% | 33.5% | 40.3% | -6.8% | 8.2% | 21.3% |
| Willows | 6,190 | 40.4% | 32.0% | 41.4% | -9.4% | 10.6% | 20.4% |
Overview
| Year | GOP | DEM | Others |
|---|---|---|---|
| 2012 | 61.0% 5,632 | 35.7% 3,301 | 3.3% 305 |
| 2008 | 59.8% 5,910 | 37.8% 3,734 | 2.4% 235 |
| 2004 | 66.7% 6,308 | 31.7% 2,995 | 1.6% 151 |
| 2000 | 66.5% 5,795 | 28.7% 2,498 | 4.8% 418 |
| 1996 | 56.9% 5,041 | 32.0% 2,841 | 11.1% 984 |
| 1992 | 43.2% 3,812 | 30.2% 2,666 | 25.8% 2,278 |
| 1988 | 62.1% 4,944 | 36.3% 2,894 | 1.6% 128 |
| 1984 | 69.7% 6,020 | 28.8% 2,488 | 1.4% 124 |
| 1980 | 64.8% 5,386 | 26.8% 2,227 | 8.4% 699 |
| 1976 | 52.7% 4,094 | 45.0% 3,501 | 2.3% 178 |
| 1972 | 59.0% 4,569 | 34.6% 2,681 | 6.4% 493 |
| 1968 | 53.9% 3,848 | 34.6% 2,466 | 11.5% 824 |
| 1964 | 46.0% 3,351 | 54.0% 3,937 | 0.0% 2 |
| 1960 | 53.2% 3,911 | 46.4% 3,410 | 0.5% 35 |
| 1956 | 52.0% 3,463 | 47.9% 3,192 | 0.2% 10 |
| 1952 | 64.5% 4,454 | 35.1% 2,422 | 0.5% 35 |
| 1948 | 51.0% 2,819 | 46.6% 2,578 | 2.4% 131 |
| 1944 | 49.3% 2,409 | 50.2% 2,452 | 0.5% 23 |
| 1940 | 43.9% 2,473 | 55.0% 3,095 | 1.1% 63 |
| 1936 | 32.5% 1,620 | 66.0% 3,288 | 1.5% 76 |
| 1932 | 31.3% 1,432 | 65.1% 2,973 | 3.6% 164 |
| 1928 | 65.0% 2,466 | 34.2% 1,297 | 0.8% 29 |
| 1924 | 44.8% 1,444 | 11.4% 367 | 43.8% 1,409 |
| 1920 | 64.2% 1,916 | 30.2% 902 | 5.6% 167 |
Glenn is a strongly Republican county in Presidential and congressional elections. The last Democrat to win a majority in the county was Lyndon Johnson in 1964.
Glenn County is split between California's 1st and 3rd congressional districts, represented by Doug LaMalfa (R–Richvale) and John Garamendi (D–Walnut Grove), respectively.[22]
In the State Assembly, Glenn County is in the 3rd Assembly District, represented by Republican James Gallagher.[23] In the State Senate, the county is in the 4th Senate District, represented by Republican Jim Nielsen.[24]
On November 4, 2008 Glenn County voted 73.3% for Proposition 8 which amended the California Constitution to ban same-sex marriages.
| Election results from statewide races | ||
|---|---|---|
| Year | Office | Results |
| 2010 | Governor | Whitman 61.1 - 30.4% |
| Lieutenant Governor | Maldonado 59.3 - 26.1% | |
| Secretary of State | Dunn 56.6 - 32.9% | |
| Controller | Strickland 52.1 - 34.5% | |
| Treasurer | Walters 54.5 - 36.6% | |
| Attorney General | Cooley 62.7 - 25.9% | |
| Insurance Commissioner | Villines 56.8 - 27.7% | |
Crime
The following table includes the number of incidents reported and the rate per 1,000 persons for each type of offense.
| Population and crime rates | ||
|---|---|---|
| Population[7] | 28,027 | |
| Violent crime[25] | 54 | 1.93 |
| Homicide[25] | 0 | 0.00 |
| Forcible rape[25] | 2 | 0.07 |
| Robbery[25] | 10 | 0.36 |
| Aggravated assault[25] | 42 | 1.50 |
| Property crime[25] | 313 | 11.17 |
| Burglary[25] | 177 | 6.32 |
| Larceny-theft[25][note 4] | 340 | 12.13 |
| Motor vehicle theft[25] | 49 | 1.75 |
| Arson[25] | 0 | 0.00 |
Cities by population and crime rates
| Cities by population and crime rates | ||||||||
|---|---|---|---|---|---|---|---|---|
| City | Population[26] | Violent crimes[26] | Violent crime rate per 1,000 persons |
Property crimes[26] | Property crime rate per 1,000 persons | |||
| Orland | 7,361 | 27 | 3.67 | 210 | 28.53 | |||
| Willows | 6,223 | 26 | 4.18 | 234 | 37.60 | |||
Transportation
Major highways
Public transportation
Glenn Ride runs buses from Willows to Hamilton City, and on into Chico (Butte County). The nearest Amtrak station is in Chico.
Airports
Willows-Glenn County Airport and Haigh Field are both general aviation airports.
Railroads
California Northern Railroad shortline serves Willows. The main line runs north to Tehama and south to Davis, where the railroad interchanges with the Union Pacific Railroad. Prior to the line being leased to the California Northern, the route was operated by Southern Pacific and was known as the West Side Line. The railroad first reached Willows on December 28, 1879, from Davis. In 1882 the extension from Willows to Tehama was completed. In 1884 the West Side and Mendocino Railroad constructed a line east from Willows to Fruto.
Communities
Cities
Census-designated places
Other communities
Population ranking
The population ranking of the following table is based on the 2010 census of Glenn County.[27]
† county seat
| Rank | City/Town/etc. | Municipal type | Population (2010 Census)
|
|---|---|---|---|
| 1 | Orland | City | 7,291 |
| 2 | † Willows | City | 6,166 |
| 3 | Hamilton City | CDP | 1,759 |
| 4 | Artois | CDP | 295 |
| 5 | Grindstone Rancheria[28] | AIAN | 164 |
| 6 | Elk Creek | CDP | 163 |
See also
- Hiking trails in Glenn County
- National Register of Historic Places listings in Glenn County, California
- Orland Buttes
- Thomas D. Harp, mentions formation of the county
Notes
- ↑ Other = Some other race + Two or more races
- ↑ Native American = Native Hawaiian or other Pacific Islander + American Indian or Alaska Native
- 1 2 Percentage of registered voters with respect to total population. Percentages of party members with respect to registered voters follow.
- ↑ Only larceny-theft cases involving property over $400 in value are reported as property crimes.
References
- ↑ "Black Butte". Peakbagger.com. Retrieved April 8, 2015.
- 1 2 3 4 "State & County QuickFacts". United States Census Bureau. Retrieved April 3, 2016.
- ↑ "Find a County". National Association of Counties. Archived from the original on May 31, 2011. Retrieved June 7, 2011.
- ↑ "County of Glenn Residents". County of Glenn. Retrieved September 10, 2013.
- ↑ Gannett, Henry (1905). The Origin of Certain Place Names in the United States. Govt. Print. Off. p. 138.
- ↑ "2010 Census Gazetteer Files". United States Census Bureau. August 22, 2012. Retrieved September 26, 2015.
- 1 2 3 4 5 6 7 8 9 10 11 12 13 14 15 16 17 U.S. Census Bureau. American Community Survey, 2011 American Community Survey 5-Year Estimates, Table B02001. American FactFinder Archived September 11, 2013, at the Wayback Machine.. Retrieved October 26, 2013.
- 1 2 U.S. Census Bureau. American Community Survey, 2011 American Community Survey 5-Year Estimates, Table B03003. American FactFinder Archived September 11, 2013, at the Wayback Machine.. Retrieved October 26, 2013.
- 1 2 U.S. Census Bureau. American Community Survey, 2011 American Community Survey 5-Year Estimates, Table B19301. American FactFinder Archived September 11, 2013, at the Wayback Machine.. Retrieved October 21, 2013.
- 1 2 U.S. Census Bureau. American Community Survey, 2011 American Community Survey 5-Year Estimates, Table B19013. American FactFinder Archived September 11, 2013, at the Wayback Machine.. Retrieved October 21, 2013.
- 1 2 U.S. Census Bureau. American Community Survey, 2011 American Community Survey 5-Year Estimates, Table B19113. American FactFinder Archived September 11, 2013, at the Wayback Machine.. Retrieved October 21, 2013.
- 1 2 U.S. Census Bureau. American Community Survey, 2011 American Community Survey 5-Year Estimates. American FactFinder Archived September 11, 2013, at the Wayback Machine.. Retrieved October 21, 2013.
- ↑ U.S. Census Bureau. American Community Survey, 2011 American Community Survey 5-Year Estimates, Table B01003. American FactFinder Archived September 11, 2013, at the Wayback Machine.. Retrieved October 21, 2013.
- ↑ "County Totals Dataset: Population, Population Change and Estimated Components of Population Change: April 1, 2010 to July 1, 2015". Retrieved July 2, 2016.
- ↑ "U.S. Decennial Census". United States Census Bureau. Archived from the original on May 11, 2015. Retrieved September 26, 2015.
- ↑ "Historical Census Browser". University of Virginia Library. Retrieved September 26, 2015.
- ↑ Forstall, Richard L., ed. (March 27, 1995). "Population of Counties by Decennial Census: 1900 to 1990". United States Census Bureau. Retrieved September 26, 2015.
- ↑ "Census 2000 PHC-T-4. Ranking Tables for Counties: 1990 and 2000" (PDF). United States Census Bureau. April 2, 2001. Retrieved September 26, 2015.
- ↑ "2010 Census P.L. 94-171 Summary File Data". United States Census Bureau.
- ↑ "American FactFinder". United States Census Bureau. Retrieved May 14, 2011.
- 1 2 3 4 5 6 7 8 9 10 11 12 13 14 15 16 17 California Secretary of State. February 10, 2013 - Report of Registration. Retrieved October 31, 2013.
- ↑ "California's 3rd Congressional District - Representatives & District Map". Civic Impulse, LLC. Retrieved February 28, 2013.
- ↑ "Members Assembly". State of California. Retrieved April 6, 2013.
- ↑ "Senators". State of California. Retrieved April 6, 2013.
- 1 2 3 4 5 6 7 8 9 10 Office of the Attorney General, Department of Justice, State of California. Table 11: Crimes – 2009. Retrieved November 14, 2013.
- 1 2 3 United States Department of Justice, Federal Bureau of Investigation. Crime in the United States, 2012, Table 8 (California). Retrieved November 14, 2013.
- ↑ "Archived copy". Archived from the original on December 21, 2013. Retrieved February 10, 2013.
- ↑ http://www.census.gov/2010census/popmap/ipmtext.php?fl=1395
External links
| Wikimedia Commons has media related to Glenn County, California. |
 |
Tehama County | | ||
| Mendocino County | |
Butte County | ||
| ||||
| | ||||
| Lake County | Colusa County |
Municipalities and communities of Glenn County, California, United States | ||
|---|---|---|
| Cities | | |
| CDPs | ||
| Unincorporated communities | ||
| Indian reservations | ||
| Ghost towns | ||
Coordinates: 39°35′N 122°23′W / 39.59°N 122.39°W