List of U.S. states by population growth rate
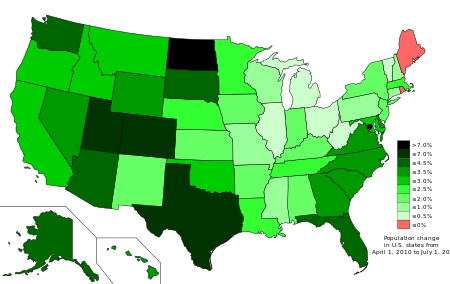
This article includes a list of U.S. states sorted by the percentage change in estimated population for the 63-month period from April 1, 2010 to July 1, 2015, the most recent estimates available from the United States Census Bureau.[1]
| Rank | State | 2010 Census | 2015 estimate | Change |
|---|---|---|---|---|
| 1 | 672,591 | 756,927 | +12.54% | |
| — | 601,723 | 672,228 | +11.72% | |
| 2 | 25,145,561 | 27,469,114 | +9.24% | |
| 3 | 5,029,196 | 5,456,574 | +8.50% | |
| 4 | 2,763,885 | 2,995,919 | +8.40% | |
| 5 | 18,801,310 | 20,271,272 | +7.82% | |
| 7 | 6,392,017 | 6,828,065 | +6.82% | |
| 6 | 2,700,551 | 2,890,845 | +7.05% | |
| 8 | 6,724,540 | 7,170,351 | +6.63% | |
| 12 | 814,180 | 858,469 | +5.44% | |
| 9 | 4,625,364 | 4,896,146 | +5.85% | |
| 15 | 1,360,301 | 1,431,603 | +5.24% | |
| 14 | 9,535,483 | 10,042,802 | +5.32% | |
| 10 | 1,567,582 | 1,654,930 | +5.57% | |
| 11 | 9,687,653 | 10,214,860 | +5.44% | |
| 13 | 897,934 | 945,934 | +5.35% | |
| 17 | 37,253,956 | 39,144,818 | +5.08% | |
| 18 | 8,001,024 | 8,382,993 | +4.77% | |
| 24 | 710,231 | 738,432 | +3.97% | |
| 23 | 563,626 | 586,107 | +3.99% | |
| 16 | 3,831,074 | 4,028,977 | +5.17% | |
| 21 | 5,773,552 | 6,006,401 | +4.03% | |
| 19 | 989,415 | 1,032,949 | +4.40% | |
| 20 | 3,751,351 | 3,911,338 | +4.26% | |
| — | 308,745,538 | 321,418,820 | +4.10% | |
| 22 | 6,346,105 | 6,600,299 | +4.01% | |
| 26 | 6,547,629 | 6,794,422 | +3.77% | |
| 25 | 1,826,341 | 1,896,190 | +3.82% | |
| 27 | 5,303,925 | 5,489,594 | +3.50% | |
| 28 | 4,533,372 | 4,670,724 | +3.03% | |
| 29 | 3,046,355 | 3,123,899 | +2.55% | |
| 30 | 19,378,102 | 19,795,791 | +2.16% | |
| 33 | 2,853,118 | 2,911,641 | +2.05% | |
| 32 | 6,483,802 | 6,619,680 | +2.10% | |
| 31 | 2,915,918 | 2,978,204 | +2.14% | |
| 34 | 4,339,367 | 4,425,092 | +1.98% | |
| 35 | 8,791,894 | 8,958,013 | +1.89% | |
| 36 | 4,779,736 | 4,858,979 | +1.66% | |
| 39 | 2,059,179 | 2,085,109 | +1.26% | |
| 37 | 5,988,927 | 6,083,672 | +1.58% | |
| — | 159,358 | 161,785 | +1.52% | |
| 38 | 5,686,986 | 5,771,337 | +1.48% | |
| 41 | 2,967,297 | 2,992,333 | +0.84% | |
| 40 | 1,316,470 | 1,330,608 | +1.07% | |
| 42 | 12,702,379 | 12,802,503 | +0.79% | |
| 44 | 3,574,097 | 3,590,886 | +0.47% | |
| 43 | 11,536,504 | 11,613,423 | +0.67% | |
| 47 | 12,830,632 | 12,859,995 | +0.23% | |
| 45 | 9,883,640 | 9,922,576 | +0.39% | |
| 46 | 1,052,567 | 1,056,298 | +0.35% | |
| 48 | 1,328,361 | 1,329,328 | +0.07% | |
| 49 | 625,741 | 626,042 | +0.05% | |
| 50 | 1,852,994 | 1,844,128 | −0.48% | |
| — | 106,405 | 104,737 | −1.57% | |
| — | 53,833 | 52,344 | −2.77% | |
| — | 55,519 | 54,343 | −2.12% | |
| — | 3,725,789 | 3,474,182 | −6.75% |
Summary by state, division and region
| Legend |
| Division Totals |
| Region Totals |
| Total 50 States + DC and District of Columbia |
| Note: divisions and regions as defined by U.S. Census Bureau |
| Rank | State/Division/ Region |
2010 Census |
2014 est. |
Chg | Geog sort |
|---|---|---|---|---|---|
| 25 | Massachusetts | 6,547,629 | 6,745,408 | 3.02% | NEng |
| 42 | New Hampshire | 1,316,470 | 1,326,813 | 0.79% | NEng |
| 44 | Connecticut | 3,574,097 | 3,596,080 | 0.63% | NEng |
| 46 | Rhode Island | 1,052,567 | 1,055,173 | 0.25% | NEng |
| 47 | Vermont | 625,741 | 626,562 | 0.13% | NEng |
| 48 | Maine | 1,328,361 | 1,330,089 | 0.13% | NEng |
| 7 | New England | 14,444,865 | 14,680,722 | 1.63% | NEast |
| 30 | New York | 19,378,102 | 19,746,227 | 1.90% | MdAtl |
| 34 | New Jersey | 8,791,894 | 8,938,175 | 1.66% | MdAtl |
| 43 | Pennsylvania | 12,702,379 | 12,787,209 | 0.67% | MdAtl |
| 8 | Mid-Atlantic | 40,872,375 | 41,471,611 | 1.47% | NEast |
| 3 | Northeast | 55,317,240 | 56,152,333 | 1.50% | USA |
| -- | District of Columbia |
601,723 | 658,893 | 9.50% | SAtl |
| 5 | Florida | 18,801,310 | 19,893,297 | 5.81% | SAtl |
| 10 | South Carolina | 4,625,364 | 4,832,482 | 4.48% | SAtl |
| 12 | North Carolina | 9,535,483 | 9,943,964 | 4.28% | SAtl |
| 14 | Georgia | 9,687,653 | 10,097,343 | 4.23% | SAtl |
| 15 | Delaware | 897,934 | 935,614 | 4.20% | SAtl |
| 16 | Virginia | 8,001,024 | 8,326,289 | 4.07% | SAtl |
| 22 | Maryland | 5,773,552 | 5,976,407 | 3.51% | SAtl |
| 50 | West Virginia | 1,852,994 | 1,850,326 | -0.14% | SAtl |
| 3 | South Atlantic | 59,175,314 | 61,855,722 | 4.53% | South |
| 24 | Tennessee | 6,346,105 | 6,549,352 | 3.20% | ESC |
| 31 | Alabama | 4,779,736 | 4,849,377 | 1.90% | ESC |
| 33 | Kentucky | 4,339,367 | 4,413,457 | 1.71% | ESC |
| 41 | Mississippi | 2,967,297 | 2,994,079 | 0.90% | ESC |
| 6 | East South Central |
18,432,505 | 18,806,265 | 2.03% | South |
| 2 | Texas | 25,145,561 | 26,956,958 | 7.20% | WSC |
| 17 | Oklahoma | 3,751,351 | 3,878,051 | 3.83% | WSC |
| 29 | Louisiana | 4,533,372 | 4,649,676 | 2.57% | WSC |
| 32 | Arkansas | 2,915,918 | 2,966,369 | 1.73% | WSC |
| 1 | West South Central |
36,346,202 | 38,451,054 | 5.79% | South |
| 1 | South | 114,555,744 | 118,383,453 | 3.34% | USA |
| 28 | Ohio | 11,280,216 | 11,590,544 | 2.75% | ENC |
| 37 | Indiana | 6,483,802 | 6,570,902 | 1.34% | ENC |
| 39 | Wisconsin | 5,686,986 | 5,742,713 | 0.98% | ENC |
| 45 | Illinois | 12,830,632 | 12,882,135 | 0.40% | ENC |
| 49 | Michigan | 9,883,640 | 9,895,622 | 0.12% | ENC |
| 9 | East North Central |
46,421,564 | 46,662,180 | 0.52% | MWest |
| 1 | North Dakota | 672,591 | 739,482 | 9.95% | WNC |
| 9 | South Dakota | 814,180 | 853,175 | 4.79% | WNC |
| 18 | Minnesota | 5,303,925 | 5,457,173 | 3.75% | WNC |
| 26 | Nebraska | 1,826,341 | 1,881,503 | 3.02% | WNC |
| 35 | Iowa | 3,046,355 | 3,090,416 | 1.45% | WNC |
| 36 | Kansas | 2,853,118 | 2,893,957 | 1.43% | WNC |
| 40 | Missouri | 5,988,927 | 6,044,171 | 0.92% | WNC |
| 5 | West North Central |
20,505,437 | 20,885,710 | 1.85% | MWest |
| 4 | Midwest | 66,927,001 | 67,547,890 | 0.93% | USA |
| 3 | Colorado | 5,029,196 | 5,355,866 | 6.50% | Mtn |
| 4 | Utah | 2,763,885 | 2,942,902 | 6.48% | Mtn |
| 6 | Arizona | 6,392,017 | 6,731,484 | 5.31% | Mtn |
| 7 | Nevada | 2,700,551 | 2,839,099 | 5.13% | Mtn |
| 13 | Idaho | 1,567,582 | 1,634,464 | 4.27% | Mtn |
| 20 | Wyoming | 563,626 | 584,153 | 3.64% | Mtn |
| 23 | Montana | 989,415 | 1,023,579 | 3.45% | Mtn |
| 38 | New Mexico | 2,059,179 | 2,085,287 | 1.27% | Mtn |
| 2 | Mountain | 22,065,451 | 22,881,245 | 3.70% | West |
| 8 | Washington | 6,724,540 | 7,061,530 | 5.01% | Pac |
| 11 | Hawaii | 1,360,301 | 1,419,561 | 4.36% | Pac |
| 19 | Alaska | 710,231 | 736,732 | 3.73% | Pac |
| 21 | Oregon | 3,831,074 | 3,970,239 | 3.63% | Pac |
| 27 | California | 37,253,956 | 38,332,521 | 2.90% | Pac |
| 4 | Pacific | 49,880,102 | 51,373,178 | 2.99% | West |
| 2 | West | 71,945,553 | 74,254,423 | 3.21% | USA |
| -- | 50 States + DC | 308,745,538 | 316,128,839 | 2.39% | NAmer |
U.S. Census Regions Map [2]
The population for the four regions and Totl U.S. (50 States & DC) agree with the CSV file from the U.S. Census Bureau in the reference below. Division totals were derived by summing the populations of the states (from first table in this article) according to the official Census Bureau map which shows which states make up the nine divisions and which divisions make up the four regions. The sum of the population for the divisions for each region sum correctly to the region totals in the reference.
See also
References
- ↑ http://www.census.gov/popest/data/state/totals/2015/index.html. Missing or empty
|title=(help) - ↑ U.S. Census Regions Map: http://www.census.gov/geo/maps-data/maps/pdfs/reference/us_regdiv.pdf
External links
- http://www.mibazaar.com/fastestgrowingstates.html
- http://www.lvrj.com/news/12845962.html
- http://www1.move.com/Finance/Census/Top5States.asp
| Demographics | |
|---|---|
| Economy | |
| Environment | |
| Geography | |
| Government | |
| Health | |
| History | |
| Law | |
| Miscellaneous | |
| |