Solar activity and climate
_and_the_Sun's_energy_received_at_the_top_of_Earth's_atmosphere_(red%2C_bottom)._Solar_energy_has_been_measured_by_satellites_since_1978.gif)
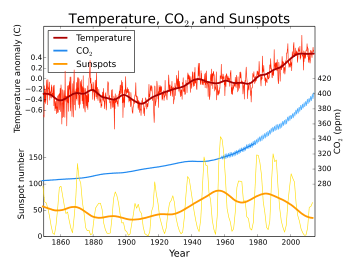
Solar activity has been a main driver of climate change over geologic time, although its role in the recent warming has not been found to be significant.[1]
Geologic time
Earth formed around 4.54 billion years ago[2][3][4] by accretion from the solar nebula. Volcanic outgassing probably created the primordial atmosphere, but it contained almost no oxygen and would have been toxic to humans and most modern life. Much of the Earth was molten because of frequent collisions with other bodies which led to extreme volcanism. Over time, the planet cooled and formed a solid crust, allowing liquid water to exist on the surface.
Three to four billion years ago the Sun emitted only 70% of its current power.[5] Under those atmospheric composition, liquid water could not have existed. Over the following approximately 4 billion years, the Sun's energy output increased and atmospheric composition changed. The Great Oxygenation Event around 2.4 billion years ago was the most notable alteration. Over the next five billion years the Sun's ultimate death as it becomes a red giant and then a white dwarf will have large effects on climate, with the red giant phase likely ending any life on Earth.
Evidence suggests water's presence, in the Hadean[6][7] and Archean[8][6] eons, leading to what is known as the faint young Sun paradox.[9] Hypothesized solutions to this paradox include a vastly different atmosphere, with much higher concentrations of greenhouse gases than currently exist.[10]
Measurement
Before the 1970s, solar activity was estimated using proxy variables, such as tree rings and sunspots.[11]
.png)
Since 1978, solar irradiance has been measured by satellites[12]:6 with significantly greater accuracy. These measurements indicate that the Sun's total solar irradiance has not increased since 1978.
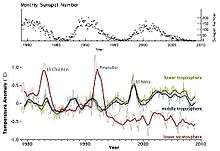
Solar activity has been on a declining trend since the 1960s, as indicated by solar cycles 19-24, in which the maximum number of sunspots were 201, 111, 165, 159, 121 and 82, respectively.[13]
In the three decades following 1978, the combination of solar and volcanic activity is estimated to have had a slight cooling influence.[14] A 2010 study found that the composition of solar radiation had changed, with in an increase of ultraviolet radiation and a decrease in other wavelengths."[15]
Modern era
In the modern era the Sun has operated within a band sufficiently narrow that climate has been less affected. Models indicate that solar and volcanic activity can explain periods of relative warmth and cold between A.D. 1000 and 1900.
Little Ice Age
One historical long-term correlation between solar activity and climate change is the 1645–1715 Maunder minimum, a period of little or no sunspot activity which partially overlapped the "Little Ice Age" during which cold weather prevailed in Europe. The Little Ice Age encompassed roughly the 16th to the 19th centuries.[16][17][18] It is debated whether the low solar activity or other factors caused the cooling.
The Spörer Minimum was linked to a significant cooling period between 1460 and 1550.[19]
A 2012 paper linked the Little Ice Age to an "unusual 50-year-long episode with four large sulfur-rich explosive eruptions," and claimed "large changes in solar irradiance are not required" to explain the phenomenon.[20]
A 2010 paper suggested that a new 90-year period of low solar activity would reduce global average temperatures by about 0.3 °C, which would not be enough to offset the increased forcing from greenhouse gases.[21]
Fossil fuel era
The link between recent solar activity and climate has not been quantified and has not been identified as a major driver of the warming that has occurred since early in the twentieth century.[22] Human-induced forcings are needed to reproduce the late-20th century warming.[23] Some studies associate solar cycle-driven irradiation increases with part of twentieth century warming.[24][25]
Three mechanisms are proposed by which solar activity affects climate:
- Solar irradiance changes directly affecting the climate ("radiative forcing"). This is generally considered to be a minor effect, as the amplitudes of the variations are too small to have significant effect, absent some amplification process.[26]
- Variations in the ultraviolet component. The UV component varies by more than the total, so if UV were for some (as yet unknown) reason to have a disproportionate effect, this might explain a larger solar signal.
- Effects mediated by changes in galactic cosmic rays (which are affected by the solar wind) such as changes in cloud cover.
Climate models have been unable to reproduce the rapid warming observed in recent decades when they only consider variations in total solar irradiance and volcanic activity. Hegerl et al. (2007) concluded that greenhouse gas forcing had "very likely" caused most of the observed global warming since the mid-20th century. In making this conclusion, they allowed for the possibility that climate models had been underestimating the effect of solar forcing.[1]
Another line of evidence comes from looking at how temperatures at different levels in the Earth's atmosphere have changed.[27] Models and observations show that greenhouse gas results in warming of the troposphere, but cooling of the stratosphere.[28] Depletion of the ozone layer by chemical refrigerants stimulated a stratospheric cooling effect. If the Sun was responsible for observed warming, warming of the troposphere at the surface and warming at the top of the stratosphere would be expected as the increased solar activity would replenish ozone and oxides of nitrogen.[29]
Lines of evidence
The assessment of the solar activity/climate relationship involves multiple, independent lines of evidence.
Sunspots
Early research attempted to find a correlation between weather and sunspot activity, mostly without notable success.[30][31] Later research has concentrated more on correlating solar activity with global temperature.
Irradiation

Crucial to the understanding of possible solar impact on terrestrial climate is accurate measurement of solar forcing. Accurate measurement only became available during the satellite era, and even that is open to dispute: different measurements find different values, due to different methods of cross-calibrating measurements taken by instruments with different spectral sensitivity.[32] Scafetta and Willson found significant variations of solar luminosity between 1980 and 2000.[33] But Lockwood and Frohlich[34] find that solar forcing declined after 1987.
The Intergovernmental Panel on Climate Change (IPCC) Third Assessment Report (TAR) concluded that the measured impact of recent solar variation is much smaller than the amplification effect due to greenhouse gases, but acknowledged that scientific understanding is poor with respect to solar variation.[35][36]
Estimates of long-term solar irradiance changes have decreased since the TAR. However, empirical results of detectable tropospheric changes have strengthened the evidence for solar forcing of climate change. The most likely mechanism is considered to be some combination of direct forcing by TSI changes and indirect effects of ultraviolet (UV) radiation on the stratosphere. Least certain are indirect effects induced by galactic cosmic rays.[37]
In 2002, Lean et al.[38] stated that while "There is ... growing empirical evidence for the Sun's role in climate change on multiple time scales including the 11-year cycle", "changes in terrestrial proxies of solar activity (such as the 14C and 10Be cosmogenic isotopes and the aa geomagnetic index) can occur in the absence of long-term (i.e., secular) solar irradiance changes ... because the stochastic response increases with the cycle amplitude, not because there is an actual secular irradiance change." They conclude that because of this, "long-term climate change may appear to track the amplitude of the solar activity cycles," but that "Solar radiative forcing of climate is reduced by a factor of 5 when the background component is omitted from historical reconstructions of total solar irradiance ...This suggests that general circulation model (GCM) simulations of twentieth century warming may overestimate the role of solar irradiance variability." A 2006 review suggested that solar brightness had relatively little effect on global climate, with little likelihood of significant shifts in solar output over long periods of time.[26][39] Lockwood and Fröhlich, 2007, found "considerable evidence for solar influence on the Earth's pre-industrial climate and the Sun may well have been a factor in post-industrial climate change in the first half of the last century", but that "over the past 20 years, all the trends in the Sun that could have had an influence on the Earth's climate have been in the opposite direction to that required to explain the observed rise in global mean temperatures."[40] In a study that considered geomagnetic activity as a measure of known solar-terrestrial interaction, Love et al. found a statistically significant correlation between sunspots and geomagnetic activity, but not between global surface temperature and either sunspot number or geomagnetic activity.[41]
Benestad and Schmidt[42] concluded that "the most likely contribution from solar forcing a global warming is 7 ± 1% for the 20th century and is negligible for warming since 1980." This paper disagreed with Scafetta and West,[43] who claimed that solar variability has a significant effect on climate forcing. Based on correlations between specific climate and solar forcing reconstructions, they argued that a "realistic climate scenario is the one described by a large preindustrial secular variability (e.g., the paleoclimate temperature reconstruction by Moberg et al.)[44] with TSI experiencing low secular variability (as the one shown by Wang et al.).[45] Under this scenario, they claimed the Sun might have contributed 50% of the observed global warming since 1900.[46] Stott et al. estimated that the residual effects of the prolonged high solar activity during the last 30 years account for between 16% and 36% of warming from 1950 to 1999.[47]
Direct measurement and time series
Neither direct measurements nor proxies of solar variation correlate well with Earth global temperature,[48] particularly in recent decades.[49][50]
Daytime/nighttime
Global average diurnal temperature range has decreased.[51][52][53] Daytime temperatures have not risen as fast as nighttime temperatures. This is the opposite of the expected warming if solar energy (falling primarily or wholly during daylight, depending on energy regime) were the principal means of forcing. It is, however, the expected pattern if greenhouse gases were preventing radiative escape, which is more prevalent at night.[54]
Hemisphere and latitude
The Northern Hemisphere is warming faster than the Southern Hemisphere.[55][56] This is the opposite of the expected pattern if the Sun, currently closer to the Earth during austral summer, were the principal climate forcing. In particular, the Southern Hemisphere, with more ocean area and less land area, has a lower albedo ("whiteness") and absorbs more light. The Northern Hemisphere, however, has higher population, industry and emissions.
Furthermore, the Arctic region is warming faster than the Antarctic and faster than northern mid-latitudes and subtropics, despite polar regions receiving less sun than lower latitudes.
Altitude
Solar forcing should warm Earth's atmosphere roughly evenly by altitude, with some variation by wavelength/energy regime. However, the atmosphere is warming at lower altitudes while cooling higher up. This is the expected pattern if greenhouse gases drive temperature,[57][58] as on Venus.[59]
Solar variation theory
A 1994 US study concluded that TSI variations were the most likely cause of significant climate change in the pre-industrial era, before significant human-generated carbon dioxide entered the atmosphere.[60]
Scafetta and West correlated solar proxy data and lower tropospheric temperature for the preindustrial era, before significant anthropogenic greenhouse forcing, suggesting that TSI variations may have contributed 50% of the warming observed between 1900 and 2000 (although they conclude "our estimates about the solar effect on climate might be overestimated and should be considered as an upper limit.")[43] This contrasts with the results from global climate models that predict solar forcing of climate through direct radiative forcing is too small to explain a significant contribution.[61]

In 2000, Stott and others[62] reported on the most comprehensive model simulations of 20th century climate to that date. Their study looked at both "natural forcing agents" (solar variations and volcanic emissions) as well as "anthropogenic forcing" (greenhouse gases and sulphate aerosols). They found that "solar effects may have contributed significantly to the warming in the first half of the century although this result is dependent on the reconstruction of total solar irradiance that is used. In the latter half of the century, we find that anthropogenic increases in greenhouses gases are largely responsible for the observed warming, balanced by some cooling due to anthropogenic sulphate aerosols, with no evidence for significant solar effects." Stott's group found that combining these factors enabled them to closely simulate global temperature changes throughout the 20th century. They predicted that continued greenhouse gas emissions would cause additional future temperature increases "at a rate similar to that observed in recent decades".[63] In addition, the study notes "uncertainties in historical forcing" — in other words, past natural forcing may still be having a delayed warming effect, most likely due to the oceans.[62]
Stott's 2003 work largely revised his assessment, and found a significant solar contribution to recent warming, although still smaller (between 16 and 36%) than that of greenhouse gases.[47]
A study in 2004 concluded that solar activity affects the climate - based on sunspot activity, yet plays only a small role in the current global warming.[64]
Correlations to solar cycle length
In 1991, Friis-Christensen and Lassen claimed a strong correlation of the length of the solar cycle with northern hemispheric temperature changes.[65] Initially, they used sunspot and temperature measurements from 1861 to 1989 and later extended the period using four centuries of climate records. They reported that the relationship appeared to account for nearly 80 per cent of measured temperature changes over this period.
The mechanism behind these correlations is a matter of speculation. Laut's 2003 paper[66] identified problems with some of these correlation analyses. Damon and Laut claimed:[67]
the apparent strong correlations displayed on these graphs have been obtained by incorrect handling of the physical data. The graphs are still widely referred to in the literature, and their misleading character has not yet been generally recognized.
Damon and Laut stated that when the graphs are corrected for filtering errors, the sensational agreement with the recent global warming, which drew worldwide attention, totally disappeared.[67]
In 2000, Lassen and Thejll updated the 1991 research and concluded that while the solar cycle accounted for about half the temperature rise since 1900, it failed to explain a rise of 0.4 °C since 1980.[68] Benestad's 2005 review[69] found that the solar cycle did not follow Earth's global mean surface temperature.
Weather
Solar activity may also impact regional climates, such as for the rivers Paraná[70] and Po.[71] Measurements from NASA's Solar Radiation and Climate Experiment show that solar UV output is more variable than total solar irradiance. Climate modelling suggests that low solar activity may result in, for example, colder winters in the US and northern Europe and milder winters in Canada and southern Europe, with little change in global averages.[72] More broadly, links have been suggested between solar cycles, global climate and regional events such as El Nino.[73] Hancock and Yarger found "statistically significant relationships between the double [~21-year] sunspot cycle and the 'January thaw' phenomenon along the East Coast and between the double sunspot cycle and 'drought' (June temperature and precipitation) in the Midwest."[74]
Cloud condensation
Recent research at CERN's CLOUD facility examined links between cosmic rays and cloud condensation nuclei, demonstrating the effect of high-energy particulate radiation in nucleating aerosol particles that are precursors to cloud condensation nuclei.[75] Kirby (CLOUD team leader) said, "At the moment, it [the experiment] actually says nothing about a possible cosmic-ray effect on clouds and climate, but it's a very important first step."[76][77]
1983–1994 global low cloud formation data from the International Satellite Cloud Climatology Project (ISCCP) was highly correlated with galactic cosmic ray (GCR) flux; subsequent to this period, the correlation broke down.[67] Changes of 3–4% in cloudiness and concurrent changes in cloud top temperatures correlated to the 11 and 22-year solar (sunspot) cycles, with increased GCR levels during "antiparallel" cycles.[78] Global average cloud cover change was measured at 1.5–2%. Several GCR and cloud cover studies found positive correlation at latitudes greater than 50° and negative correlation at lower latitudes.[79] However, not all scientists accept this correlation as statistically significant, and some who do attribute it to other solar variability (e.g. UV or total irradiance variations) rather than directly to GCR changes.[80][81] Difficulties in interpreting such correlations include the fact that many aspects of solar variability change at similar times, and some climate systems have delayed responses.
Historical perspective
Physicist and historian Spencer R. Weart in The Discovery of Global Warming (2003) wrote:
The study of [sun spot] cycles was generally popular through the first half of the century. Governments had collected a lot of weather data to play with and inevitably people found correlations between sun spot cycles and select weather patterns. If rainfall in England didn't fit the cycle, maybe storminess in New England would. Respected scientists and enthusiastic amateurs insisted they had found patterns reliable enough to make predictions. Sooner or later though every prediction failed. An example was a highly credible forecast of a dry spell in Africa during the sunspot minimum of the early 1930s. When the period turned out to be wet, a meteorologist later recalled "the subject of sunspots and weather relationships fell into dispute, especially among British meteorologists who witnessed the discomfiture of some of their most respected superiors." Even in the 1960s he said, "For a young [climate] researcher to entertain any statement of sun-weather relationships was to brand oneself a crank."[30]
See also
References
- 1 2 Hegerl, et al., Chapter 9: Understanding and Attributing Climate Change, Executive Summary, in IPCC AR4 WG1 2007.
- ↑ "Age of the Earth". U.S. Geological Survey. 1997. Archived from the original on 23 December 2005. Retrieved 2006-01-10.
- ↑ Dalrymple, G. Brent (2001). "The age of the Earth in the twentieth century: a problem (mostly) solved". Special Publications, Geological Society of London. 190 (1): 205–221. Bibcode:2001GSLSP.190..205D. doi:10.1144/GSL.SP.2001.190.01.14.
- ↑ Manhesa, Gérard; Allègre, Claude J.; Dupréa, Bernard & Hamelin, Bruno (1980). "Lead isotope study of basic-ultrabasic layered complexes: Speculations about the age of the earth and primitive mantle characteristics". Earth and Planetary Science Letters. 47 (3): 370–382. Bibcode:1980E&PSL..47..370M. doi:10.1016/0012-821X(80)90024-2.
- ↑ The Sun's evolution
- 1 2 Marty, B. (2006). "Water in the Early Earth". Reviews in Mineralogy and Geochemistry. 62: 421–450. doi:10.2138/rmg.2006.62.18.
- ↑ Watson, E. B.; Harrison, TM (2005). "Zircon Thermometer Reveals Minimum Melting Conditions on Earliest Earth". Science. 308 (5723): 841–4. Bibcode:2005Sci...308..841W. doi:10.1126/science.1110873. PMID 15879213.
- ↑ Hagemann, Steffen G.; Gebre-Mariam, Musie; Groves, David I. (1994). "Surface-water influx in shallow-level Archean lode-gold deposits in Western, Australia". Geology. 22 (12): 1067. Bibcode:1994Geo....22.1067H. doi:10.1130/0091-7613(1994)022<1067:SWIISL>2.3.CO;2.
- ↑ Sagan, C.; G. Mullen (1972). Earth and Mars: Evolution of Atmospheres and Surface Temperatures.
- ↑ Sagan, C.; Chyba, C (1997). "The Early Faint Sun Paradox: Organic Shielding of Ultraviolet-Labile Greenhouse Gases". Science. 276 (5316): 1217–21. Bibcode:1997Sci...276.1217S. doi:10.1126/science.276.5316.1217. PMID 11536805.
- ↑ Simmon, R. & D. Herring (November 2009). "Notes for slide number 5 titled "Over 100 years of total solar irradiance data," in presentation, "Human contributions to global climate change"". Presentation library on the U.S. National Oceanic and Atmospheric Administration's Climate Services website. Archived from the original on 3 July 2011. Retrieved 2011-06-23.
- ↑ US National Research Council (2008). Understanding and responding to climate change: Highlights of National Academies Reports (PDF) (2008 ed.). 500 Fifth St. N.W., Washington, D.C. 20001: National Academy of Sciences. Archived from the original (PDF) on July 17, 2011. Retrieved 2011-05-20.
- ↑ "Sunspot numbers". SILSO Data Files. Royal Observatory of Belgium, Brussels. Retrieved 29 July 2014.
- ↑ Karl, Melillo & Peterson 2009, p. 15–16.
- ↑ Haigh, Joanna D.; Winning, Ann R.; Toumi, Ralf; Harder, Jerald W. (2010-10-07). "An influence of solar spectral variations on radiative forcing of climate". Nature. 467 (7316): 696–9. Bibcode:2010Natur.467..696H. doi:10.1038/nature09426. ISSN 0028-0836. PMID 20930841.
Currently there is insufficient observational evidence to validate the spectral variations observed by SIM, or to fully characterize other solar cycles, but our findings raise the possibility that the effects of solar variability on temperature throughout the atmosphere may be contrary to current expectations.
- ↑ H. H. Lamb, "The cold Little Ice Age climate of about 1550 to 1800," in H. H. Lamb (1972). Fundamentals and Climate Now. Psychology Press. p. 107. ISBN 978-0-416-11530-7.
- ↑ Emmanuel Le Roy Ladurie (1971). Times of Feast, Times of Famine: a History of Climate Since the Year 1000. Barbara Bray. Garden City, NY: Doubleday. ISBN 0-374-52122-0. OCLC 164590.
- ↑ "Environment". solarstorms.org.
- ↑ Parker, Geoffrey; Smith, Lesley M. (1997). The general crisis of the seventeenth century. Routledge. pp. 287, 288. ISBN 978-0-415-16518-1.
- ↑ Miller; et al. (January 31, 2012). "Abrupt onset of the Little Ice Age triggered by volcanism and sustained by sea-ice/ocean feedbacks". Geophysical Research Letters. 39. Bibcode:2012GeoRL..39.2708M. doi:10.1029/2011GL050168.
- ↑ "A quiet sun won't save us from global warming". New Scientist. 26 February 2010. Retrieved 7 June 2011.
- ↑ Joanna D. Haigh "The Sun and the Earth’s Climate", Living Reviews in Solar Physics (access date 31 January 2012
- ↑ Committee on Surface Temperature Reconstructions for the Last 2,000 Years, US National Research Council (2006). "10. Climate Forcings and Climate Models". Surface Temperature Reconstructions for the Last 2,000 Years. Washington, D.C., USA: National Academy Press. p. 109. ISBN 0-309-66144-7. Retrieved 2011-06-23. External link in
|publisher=(help) - ↑ "NASA Study Finds Increasing Solar Trend That Can Change Climate". 2003.
- ↑ Svensmark, Henrik; Bondo, Torsten; Svensmark, Jacob (2009). "Cosmic ray decreases affect atmospheric aerosols and clouds". Geophysical Research Letters. 36 (15): n/a. Bibcode:2009GeoRL..3615101S. doi:10.1029/2009GL038429.
- 1 2 "Changes in Solar Brightness Too Weak To Explain Global Warming" (Press release). UCAR. 13 September 2006. Retrieved 18 April 2007.
- ↑ Simmon, R. & D. Herring (November 2009). "Notes for slide number 7, titled "Satellite evidence also suggests greenhouse gas warming," in presentation, "Human contributions to global climate change"". Presentation library on the U.S. National Oceanic and Atmospheric Administration's Climate Services website. Archived from the original on 3 July 2011. Retrieved 2011-06-23.
- ↑ Hegerl et al., Chapter 9: Understanding and Attributing Climate Change, Frequently Asked Question 9.2: Can the Warming of the 20th century be Explained by Natural Variability?
- ↑ Karl, Melillo & Peterson 2009, p. 20.
- 1 2 Weart, Spencer (2003). "Changing Sun, Changing Climate?". The Discovery of Global Warming. Harvard University Press. ISBN 0-674-01157-0. Retrieved 17 April 2008.
- ↑ Fritts, Harold C. (1976). Tree rings and climate. Boston: Academic Press. ISBN 0-12-268450-8.
- ↑
- ↑ Scafetta, Nicola; Willson, Richard (2009). "ACRIM-gap and Total Solar Irradiance (TSI) trend issue resolved using a surface magnetic flux TSI proxy model". Geophysical Research Letters. 36 (5): L05701. Bibcode:2009GeoRL..3605701S. doi:10.1029/2008GL036307.
- ↑ Lockwood, Mike; Fröhlich, Claus (8 June 2008). "Recent oppositely directed trends in solar climate forcings and the global mean surface air temperature. II. Different reconstructions of the total solar irradiance variation and dependence on response time scale". Proceedings of the Royal Society A. 464 (2094): 1367–85. Bibcode:2008RSPSA.464.1367L. doi:10.1098/rspa.2007.0347.
- ↑ Forster, P.; V. Ramaswamy; P. Artaxo; T. Berntsen; R. Betts; D.W. Fahey; J. Haywood; J. Lean; D.C. Lowe; G. Myhre; J. Nganga; R. Prinn; G. Raga; M. Schulz & R. Van Dorland (2007), "2.9.1 Uncertainties in Radiative Forcing", in IPCC AR4 WG1 2007, Chapter 2: Changes in Atmospheric Constituents and Radiative Forcing, ISBN 978-0-521-88009-1
- ↑ Houghton, J.T.; Ding, Y.; Griggs, D.J.; et al., eds. (2001). "6.11 Total Solar Irradiance—Figure 6.6: Global, annual mean radiative forcings (1750 to present)". Climate Change 2001: Working Group I: The Scientific Basis. Intergovernmental Panel on Climate Change. Retrieved 15 April 2007.
- ↑ "2.7 Natural Forcings". ipcc.ch.
- ↑ Lean, J.L.; Wang, Y.-M.; Sheeley Jr., N.R. (2002). "The effect of increasing solar activity on the Sun's total and open magnetic flux during multiple cycles: Implications for solar forcing of climate". Geophysical Research Letters. 29 (24): 77–1~77–4. Bibcode:2002GeoRL..29x..77L. doi:10.1029/2002GL015880.
- ↑ Foukal, P.; Fröhlich, C.; Spruit, H.; Wigley, T. M. L. (2006). "Variations in solar luminosity and their effect on the Earth's climate" (PDF). Nature. 443 (7108): 161–6. Bibcode:2006Natur.443..161F. doi:10.1038/nature05072. PMID 16971941.
- ↑ Lockwood, Mike; Claus Fröhlich (2007). "Recent oppositely directed trends in solar climate forcings and the global mean surface air temperature" (PDF). Proceedings of the Royal Society A. 463 (2086): 2447–2460. Bibcode:2007RSPSA.463.2447L. doi:10.1098/rspa.2007.1880.
Our results show that the observed rapid rise in global mean temperatures seen after 1985 cannot be ascribed to solar variability, whichever of the mechanisms is invoked and no matter how much the solar variation is amplified.
- ↑ Love, J. J.; Mursula, K.; Tsai, V. C.; Perkins, D. M. (2013). "Are secular correlations between sunspots, geomagnetic activity, and global temperature significant?". Geophysical Research Letters. 38. Bibcode:2011GeoRL..3821703L. doi:10.1029/2011GL049380.
- ↑ Benestad, R. E.; G. A. Schmidt (21 July 2009). "Solar trends and global warming" (PDF). Journal of Geophysical Research: Atmospheres. 114. Bibcode:2009JGRD..11414101B. doi:10.1029/2008JD011639.
the most likely contribution from solar forcing a global warming is 7 ± 1% for the 20th century and is negligible for warming since 1980.
- 1 2 Scafetta, N.; West, B. J. (2007). "Phenomenological reconstructions of the solar signature in the Northern Hemisphere, surface temperature records since 1600" (PDF). J. Geophys. Res. 112: D24S03. Bibcode:2007JGRD..11224S03S. doi:10.1029/2007JD008437. (access date 2012-1-31)
- ↑ Moberg, A; Sonechkin, DM; Holmgren, K; Datsenko, NM; Karlén, W; Lauritzen, SE (2005). "Highly variable Northern Hemisphere temperatures reconstructed from low- and high-resolution proxy data". Nature. 433 (7026): 613–7. Bibcode:2005Natur.433..613M. doi:10.1038/nature03265. PMID 15703742.
- ↑ Wang, Y.‐M.; Lean, J. L.; Sheeley, N. R. (May 2005). "Modeling the Sun's Magnetic Field and Irradiance since 1713". The Astrophysical Journal. 625: 522–38. Bibcode:2005ApJ...625..522W. doi:10.1086/429689.)
- ↑ Scafetta, N.; West, B. J. (2006). "Phenomenological solar signature in 400 years of reconstructed Northern Hemisphere temperature record". Geophys. Res. Lett. 33 (17): L17718. Bibcode:2006GeoRL..3317718S. doi:10.1029/2006GL027142.
- 1 2 Stott, Peter A.; Gareth S. Jones; John F. B. Mitchell (2003). "Do Models Underestimate the Solar Contribution to Recent Climate Change" (PDF). Journal of ClimateDecember. 16 (24): 4079–4093. Bibcode:2003JCli...16.4079S. doi:10.1175/1520-0442(2003)016<4079:DMUTSC>2.0.CO;2. Retrieved 5 October 2005.
- ↑ Schurer, A.; et al. (December 2013). "Small influence of solar variability on climate over the past millennium". Nature Geoscience. 7: 104–108. doi:10.1038/ngeo2040.
- ↑ Lockwood, L.; Fröhlich, C. (October 2007). "Recent oppositely directed trends in solar climate forcings and the global mean surface air temperature". Proceedings of the Royal Society A. 463 (2086): 2447–2460. Bibcode:2007RSPSA.463.2447L. doi:10.1098/rspa.2007.1880.
- ↑ Foukal, P.; et al. (September 2006). "Variations in solar luminosity and their effect on the Earth's climate". Nature. 443 (7108): 161–166. doi:10.1038/nature05072. PMID 16971941.
- ↑ Karl, Thomas; et al. (1993). "A New Perspective on Recent Global Warming: Asymmetric Trends of Daily Maximum and Minimum Temperature". Bulletin of the American Meteorological Society. 74: 1007–1023. doi:10.1175/1520-0477(1993)074<1007:anporg>2.0.co;2.
- ↑ Braganza, K; et al. (July 2004). "Diurnal temperature range as an index of global climate change during the twentieth century". Geophysical Research Letters. 31 (13). Bibcode:2004GeoRL..3113217B. doi:10.1029/2004gl019998.
- ↑ Zhou, L.; et al. (August 2009). "Detection and attribution of anthropogenic forcing to diurnal temperature range changes from 1950 to 1999: comparing multi-model simulations with observations". Climate Dynamics. 35: 1289–1307. doi:10.1007/s00382-009-0644-2.
- ↑ Peng, S.; et al. (June 2004). "Rice yields decline with higher night temperature from global warming". Proceedings of the National Academy of Sciences. 35 (27): 9971–9975.
- ↑ Armstrong, A. (February 2013). "Northern warming". Nature Geoscience. 6: 158. doi:10.1038/ngeo1763.
- ↑ Jones, P. D.; Parker, D. E.; Osborn, T. J.; Briffa, K. R. "Global and Hemispheric Temperature Anomalies - Land and Marine Instrumental Records". doi:10.3334/CDIAC/cli.002. Retrieved 17 Oct 2014.
- ↑ Lewis, H.; et al. (April 2005). "Response of the Space Debris Environment to Greenhouse Cooling". Proceedings of the 4th European Conference on Space Debris: 243.
- ↑ Ford, Matt (Feb 20, 2008). "Unpacking interplay of solar variability and climate change: A trio of researchers discuss the current understanding of the effect solar". Retrieved 17 Oct 2014.
- ↑ Picone, J.; Lean, J.; et al. (2005). "Global Change in the Thermosphere: Compelling Evidence of a Secular Decrease in Density". 2005 NRL Review: 225–227.
- ↑ Board on Global Change, Commission on Geosciences, Environment, and Resources, National Research Council (1994). Solar Influences on Global Change. Washington, D.C: National Academy Press. p. 36. ISBN 0-309-05148-7.
- ↑ Hansen, J (2005). "Efficacy of climate forcings". J. Geophys. Res. 110: D18104. Bibcode:2005JGRD..11018104H. doi:10.1029/2005JD005776.
- 1 2 Stott, Peter A.; et al. (2000). "External Control of 20th Century Temperature by Natural and Anthropogenic Forcings". Science. 290 (5499): 2133–7. Bibcode:2000Sci...290.2133S. doi:10.1126/science.290.5499.2133. PMID 11118145.
- ↑ Carslaw, K.S.; Harrison, R. G.; Kirkby, J. (2002). "Cosmic Rays, Clouds, and Climate". Science. 298 (5599): 1732–7. Bibcode:2002Sci...298.1732C. doi:10.1126/science.1076964. PMID 12459578.
- ↑ "How Strongly Does the Sun Influence the Global Climate? — Studies at the Max Planck Institute for Solar System Research reveal: solar activity affects the climate but plays only a minor role in the current global warming" (Press release). Max Planck Society. 2 August 2004. Retrieved 16 August 2015.
- ↑ Friis-Christensen, E.; Lassen, K. (1 November 1991). "Length of the Solar Cycle: An Indicator of Solar Activity Closely Associated with Climate". Science. 254 (5032): 698–700. Bibcode:1991Sci...254..698F. doi:10.1126/science.254.5032.698. PMID 17774798.
- ↑ Laut, Peter (May 2003). "Solar activity and terrestrial climate: an analysis of some purported correlations". J Atmos Sol Terr Phys. 65 (7): 801–12. Bibcode:2003JASTP..65..801L. doi:10.1016/S1364-6826(03)00041-5.
- 1 2 3 Damon, Paul E.; Paul Laut (September 28, 2004). "Pattern of Strange Errors Plagues Solar Activity and Terrestrial Climate Data" (PDF). Eos, Transactions, American Geophysical Union. 85 (39): 370–4. Bibcode:2004EOSTr..85..370D. doi:10.1029/2004EO390005. Retrieved 5 October 2005.; see also discussion and references at skeptical science
- ↑ Adler, Robert (6 May 2000). "Don't blame the Sun" (2237). New Scientist. Retrieved 2007-04-19.
- ↑ Benestad, R.E. (13 August 2005). "A review of the solar cycle length estimates". Geophys. Res. Lett. 32 (15): L15714. Bibcode:2005GeoRL..3215714B. doi:10.1029/2005GL023621.
- ↑ Pablo J.D. Mauas & Andrea P. Buccino. "Long-term solar activity influences on South American rivers" page 5. Journal of Atmospheric and Solar-Terrestrial Physics on Space Climate, March 2010. Accessed: 20 September 2014.
- ↑ D. Zanchettin, A. Rubino, P. Traverso, and M. Tomasino. "[Impact of variations in solar activity on hydrological decadal patterns in northern Italy]" Journal of Geophysical Research, VOL. 113, D12102, doi:10.1029/2007JD009157, 19 June 2008. Accessed: 20 September 2014.
- ↑ Ineson S.; Scaife A.A.; Knight J.R.; Manners J.C.; Dunstone N.J.; Gray L.J.; Haigh J.D. (9 October 2011). "Solar forcing of winter climate variability in the Northern Hemisphere". Nature Geoscience. 4 (11): 753–7. Bibcode:2011NatGe...4..753I. doi:10.1038/ngeo1282.
- ↑ "National Science Foundation (NSF) News - Solar Cycle Linked to Global Climate - NSF - National Science Foundation". nsf.gov.
- ↑ Hancock DJ, Yarger DN (1979). "Cross-Spectral Analysis of Sunspots and Monthly Mean Temperature and Precipitation for the Contiguous United States". Journal of the Atmospheric Sciences. 36 (4): 746–753. Bibcode:1979JAtS...36..746H. doi:10.1175/1520-0469(1979)036<0746:CSAOSA>2.0.CO;2. ISSN 1520-0469.
- ↑ "CERN's CLOUD experiment provides unprecedented insight into cloud formation" (Press release). CERN. 25 August 2011. Retrieved 20 November 2016.
- ↑ "Cloud formation may be linked to cosmic rays" (Press release). Nature News. 24 August 2011. Retrieved 19 October 2011.
- ↑ Kirkby J; Curtius J; Almeida J; Dunne E; Duplissy J; et al. (25 August 2011). "Role of sulphuric acid, ammonia and galactic cosmic rays in atmospheric aerosol nucleation". Nature. 476 (7361): 429–433. Bibcode:2011Natur.476..429K. doi:10.1038/nature10343. PMID 21866156.
- ↑ Svensmark, Henrik (1998). "Influence of Cosmic Rays on Earth's Climate" (PDF). Physical Review Letters. 81 (22): 5027–5030. Bibcode:1998PhRvL..81.5027S. doi:10.1103/PhysRevLett.81.5027. Retrieved 17 June 2011.
- ↑ Tinsley, Brian A.; Yu, Fangqun (2004). "Atmospheric Ionization and Clouds as Links Between Solar Activity and Climate" (PDF). In Pap, Judit M.; Fox, Peter. Solar Variability and its Effects on Climate. Geophysical monograph series. 141. American Geophysical Union. pp. 321–339. ISBN 0-87590-406-8. Retrieved 19 April 2007.
- ↑ E. Pallé; C.J. Butler; K. O'Brien (2004). "The possible connection between ionization in the atmosphere by cosmic rays and low level clouds" (PDF). Journal of Atmospheric and Solar-Terrestrial Physics. 66 (18): 1779–1790. Bibcode:2004JASTP..66.1779P. doi:10.1016/j.jastp.2004.07.041.
- ↑ Pallé, E. (2005). "Possible satellite perspective effects on the reported correlations between solar activity and clouds" (PDF). Geophysical Research Letters. 32 (3): L03802.1–4. Bibcode:2005GeoRL..3203802P. doi:10.1029/2004GL021167.
General references
- "The Sun's role in Climate Changes" (PDF). Proc. of The International Conference on Global Warming and The Next Ice Age, 19–24 August 2001, Halifax, Nova Scotia. Archived from the original (PDF) on 22 October 2004. Retrieved 2005-02-21.
- White, Warren B.; Lean, Judith; Cayan, Daniel R.; Dettinger, Michael D. (1997). "Response of global upper ocean temperature to changing solar irradiance". Journal of Geophysical Research. 102 (C2): 3255–66. Bibcode:1997JGR...102.3255W. doi:10.1029/96JC03549.
- A graphical representation[1] of the relationship between natural and anthropogenic factors contributing to climate change appears in "Climate Change 2001: The Scientific Basis", a report by the Intergovernmental Panel on Climate Change (IPCC).[2]
External links
- Gerrit Lohmann; Norel Rimbu; Mihai Dima (2004). "Climate signature of solar irradiance variations: analysis of long-term instrumental, historical, and proxy data". International Journal of Climatology. 24 (8): 1045–56. Bibcode:2004IJCli..24.1045L. doi:10.1002/joc.1054.
| Internal structure | 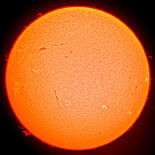 | ||||||||||
|---|---|---|---|---|---|---|---|---|---|---|---|
| Atmosphere | |||||||||||
| Variation | |||||||||||
| Heliosphere | |||||||||||
| Related topics | |||||||||||
- ↑ "graphical representation". Retrieved 2005-10-05.
- ↑ Houghton, J.T.; Ding, Y.; Griggs, D.J.; et al. (eds.). "Climate Change 2001: The Scientific Basis". Retrieved 2005-10-05.