Stream gauge
A stream gauge, streamgage or gauging station is a location used by hydrologists or environmental scientists to monitor and test terrestrial bodies of water. Hydrometric measurements of water level surface elevation ("stage") and/or volumetric discharge (flow) are generally taken and observations of biota and water quality may also be made. The location of gauging stations are often found on topographical maps. Some gauging stations are highly automated and may include telemetry capability transmitted to a central data logging facility.
Measurement equipment
Automated direct measurement of streamflow discharge is difficult at present. In place of the direct measurement of streamflow discharge, one or more surrogate measurements can be used to produce discharge values. In the majority of cases, a stage (the elevation of the water surface) measurement is used as the surrogate. Low gradient (or shallow-sloped) streams are highly influenced by variable downstream channel conditions. For these streams, a second stream gauge would be installed, and the slope of the water surface would be calculated between the gauges. This value would be used along with the stage measurement to more accurately determine the streamflow discharge. Within the last ten years, the technological advance of velocity sensors has allowed the use of water velocity as a reliable surrogate for streamflow discharge at sites with a stable cross-sectional area. These sensors are permanently mounted in the stream and measure velocity at a particular location in the stream and related to flow in a manner similar to the use of traditional water level.
In those instances where only a stage measurement is used as the surrogate, a rating curve must be constructed. A rating curve is the functional relation between stage and discharge. It is determined by making repeated discrete measurements of streamflow discharge using a velocimeter and some means to measure the channel geometry to determine the cross-sectional area of the channel. The technicians and hydrologists responsible for determining the rating curve visit the site routinely, with special trips to measure the hydrologic extremes (floods and droughts), and make a discharge measurement by following an explicit set of instructions.

Once the rating curve is established, it can be used in conjunction with stage measurements to determine the volumetric streamflow discharge. This record then serves as an assessment of the volume of water that passes by the stream gauge and is useful for many tasks associated with hydrology.
In those instances where a velocity measurement is additionally used as a surrogate, an index velocity determination is conducted. This analysis uses a velocity sensor, often either magnetic or acoustic, to measure the velocity of the flow at a particular location in the stream cross section. Once again, discrete measurements of streamflow discharge are made by the technician or hydrologist at a variety of stages. For each discrete determination of streamflow discharge, the mean velocity of the cross section is determined by dividing streamflow discharge by the cross-sectional area. A rating curve, similar to that used for stage-discharge determinations, is constructed using the mean velocity and the index velocity from the permanently mounted meter. An additional rating curve is constructed that relates stage of the stream to cross-sectional area. Using these two ratings, the automatically collected stage produces an estimate of the cross-sectional area, and the automatically collected index velocity produces an estimate of the mean velocity of the cross section. The streamflow discharge is computed as the estimate of the cross section area and the estimate of the mean velocity of the streamflow.
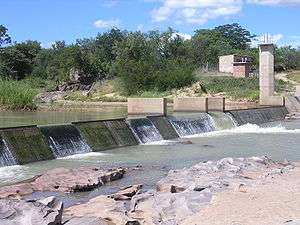
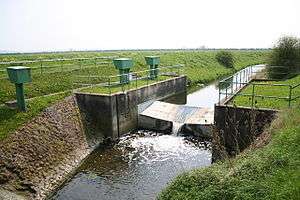
A variety of hydraulic structures / primary device are used to improve the reliability of using water level as a surrogate for flow (improving the accuracy of the rating table), including:
- Weirs
- V-notch,
- broad-crested,
- sharp-crested and
- combination weirs
- Flumes
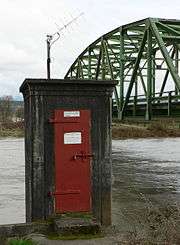
Other equipment commonly used at permanent stream gauge include:
- Cableways - for suspending a hydrographer and current meter over a river to make high flow measurement
- Stilling well - to provide a calm water level that can be measured by a sensor
Water level gauges:
- Staff (head) gauges - for a visual indication of water depth
- Water pressure measuring device (Bubbler) - to measure water level via pressure (typically done directly in-stream without a stilling well)
- Stage encoder - a potentiometer with a wheel and pulley system connected to a float in a stilling well to provide an electronic reading of the water level
- Simple ultrasonic devices - to measure water level in a stilling well or directly in a canal.
- Electromagnetic gauges
Discharge measurements of a stream or canal without an established stream gage can be made using a current meter or Acoustic Doppler current profiler. One informal methods that is not acceptable for any official or scientific purpose, but can be useful is the float method, in which a floating object such as a piece of wood or orange peel is observed floating down the stream.[1]
National stream gauge networks

United Kingdom
The first routine measurements of river flow in England began on the Thames and Lea in the 1880s,[2] and in Scotland on the River Garry in 1913.[3] The national gauging station network was established in its current form by the early 1970s and consists of approximately 1500 flow measurement stations supplemented by a variable number of temporary monitoring sites.[2] The Environment Agency is responsible for collection and analysis of hydrometric data in England and Wales, whilst responsibility for Scotland and Northern Ireland rests with the Scottish Environment Protection Agency and Rivers Agency respectively.[4]
United States
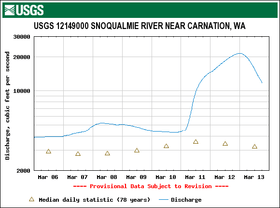
In the United States, the U.S. Geological Survey (USGS) is the principal federal agency tasked with maintaining records of natural resources. Within the USGS, the Water Resources Division carries the responsibility for monitoring water resources.
To establish a stream gauge, USGS personnel first choose a site on a stream where the geometry is relatively stable and there is a suitable location to make discrete direct measurements of streamflow using specialized equipment. Many times this will be at a bridge or other stream crossing. Technicians then install equipment that measures the stage (the elevation of the water surface) or, more rarely, the velocity of the flow. Additional equipment is installed to record and transmit these readings (via the Geostationary Operational Environmental Satellite) to the Water Science Center office where the records are kept. The USGS has a Water Science Center office in every state within the United States. Current streamflow data from USGS streamgages may be viewed in map form at: .
Zimbabwe
In Zimbabwe, the national stream gauge network is the responsibility of the Zimbabwe National Water Authority. This is an extensive network covering all major rivers and catchments in the country. However, a review of existing gauges raised serious concerns about the reliability of the data of a minority of stations, due in part to ongoing funding problems.[5]
Czech Republic

In the Czech Republic, in some measuring places (profiles) are defined three levels which define three degrees of flood-emergency activity. The degree I is a situation of alertness, the degree II is a situation of readiness, the degree III is a situation of danger.
See also
| Wikimedia Commons has media related to Stream gauge. |
- Hydrograph
- Hyetograph
- Hydrological modelling
- Hydrological transport model
- Tide gauge
- Water column
- Water level
- Nilometer
References
- ↑ Harrelson, Cheryl C; Rawlins, C. L.; Potyondy, John P. (1994). "Stream channel reference sites: an illustrated guide to field technique. Gen. Tech. Rep. RM-24" (PDF). U.S. Department of Agriculture, Forest Service, Rocky Mountain Forest and Range Experiment Station. Retrieved 2011-01-13.
- 1 2 "The UK Gauging Station Network". Hydrometry in the UK. Centre of Ecology and Hydrology. Retrieved 29 March 2011.
- ↑ "A brief history of river level monitoring in Scotland". Scottish Environment Protection Agency. Retrieved 29 March 2011.
- ↑ "Measuring Authorities". Hydrometry in the UK. Centre of Ecology and Hydrology. Retrieved 29 March 2011.
- ↑ Nyabeze, W.R. 2005. Calibrating a distributed model to estimate runoff for ungauged catchments in Zimbabwe. Physics and Chemistry of the Earth, 30, 625-633.
External links
- Contoocook River Streamflow-Gaging Station, Water Resources of New Hampshire and Vermont
- "USGS Surface-Water Data for the Nation"
- UK Hydrometric Register (pdf) A catalogue of river flow gauging stations and observation wells and boreholes in the United Kingdom together with summary hydrometric and spatial statistics.
- "Radio Gauge Warns of Flood as Water Rises" Popular Mechanics, July 1935