Fabry–Pérot interferometer

In optics, a Fabry–Pérot interferometer or etalon is typically made of a transparent plate with two reflecting surfaces, or two parallel highly reflecting mirrors. (Precisely, the former is an etalon and the latter is an interferometer, but the terminology is often used inconsistently.) Its transmission spectrum as a function of wavelength exhibits peaks of large transmission corresponding to resonances of the etalon. It is named after Charles Fabry and Alfred Perot, who developed the instrument in 1899.[1][2][3] Etalon is from the French étalon, meaning "measuring gauge" or "standard".[4]
Etalons are widely used in telecommunications, lasers and spectroscopy to control and measure the wavelengths of light. Recent advances in fabrication technique allow the creation of very precise tunable Fabry–Pérot interferometers.
Basic description

The heart of the Fabry–Pérot interferometer is a pair of partially reflective glass optical flats spaced micrometers to centimeters apart, with the reflective surfaces facing each other. (Alternatively, a Fabry–Pérot etalon uses a single plate with two parallel reflecting surfaces.) The flats in an interferometer are often made in a wedge shape to prevent the rear surfaces from producing interference fringes; the rear surfaces often also have an anti-reflective coating.
In a typical system, illumination is provided by a diffuse source set at the focal plane of a collimating lens. A focusing lens after the pair of flats would produce an inverted image of the source if the flats were not present; all light emitted from a point on the source is focused to a single point in the system's image plane. In the accompanying illustration, only one ray emitted from point A on the source is traced. As the ray passes through the paired flats, it is multiply reflected to produce multiple transmitted rays which are collected by the focusing lens and brought to point A' on the screen. The complete interference pattern takes the appearance of a set of concentric rings. The sharpness of the rings depends on the reflectivity of the flats. If the reflectivity is high, resulting in a high Q factor, monochromatic light produces a set of narrow bright rings against a dark background. A Fabry–Pérot interferometer with high Q is said to have high finesse.
Applications


- Telecommunications networks employing wavelength division multiplexing have add-drop multiplexers with banks of miniature tuned fused silica or diamond etalons. These are small iridescent cubes about 2 mm on a side, mounted in small high-precision racks. The materials are chosen to maintain stable mirror-to-mirror distances, and to keep stable frequencies even when the temperature varies. Diamond is preferred because it has greater heat conduction and still has a low coefficient of expansion. In 2005, some telecommunications equipment companies began using solid etalons that are themselves optical fibers. This eliminates most mounting, alignment and cooling difficulties.
- Dichroic filters are made by depositing a series of etalonic layers on an optical surface by vapor deposition. These optical filters usually have more exact reflective and pass bands than absorptive filters. When properly designed, they run cooler than absorptive filters because they can reflect unwanted wavelengths. Dichroic filters are widely used in optical equipment such as light sources, cameras, astronomical equipment, and laser systems.
- Optical wavemeters and some optical spectrum analyzers use Fabry–Pérot interferometers with different free spectral ranges to determine the wavelength of light with great precision.
- Laser resonators are often described as Fabry–Pérot resonators, although for many types of laser the reflectivity of one mirror is close to 100%, making it more similar to a Gires–Tournois interferometer. Semiconductor diode lasers sometimes use a true Fabry–Pérot geometry, due to the difficulty of coating the end facets of the chip. Quantum cascade lasers often employ Fabry-Pérot cavities to sustain lasing without the need for any facet coatings, due to the high gain of the active region.[5]
- Etalons are often placed inside the laser resonator when constructing single-mode lasers. Without an etalon, a laser will generally produce light over a wavelength range corresponding to a number of cavity modes, which are similar to Fabry–Pérot modes. Inserting an etalon into the laser cavity, with well-chosen finesse and free-spectral range, can suppress all cavity modes except for one, thus changing the operation of the laser from multi-mode to single-mode.
- Fabry–Pérot etalons can be used to prolong the interaction length in laser absorption spectrometry, particularly cavity ring-down, techniques.
- A Fabry–Pérot etalon can be used to make a spectrometer capable of observing the Zeeman effect, where the spectral lines are far too close together to distinguish with a normal spectrometer.
- In astronomy an etalon is used to select a single atomic transition for imaging. The most common is the H-alpha line of the sun. The Ca-K line from the sun is also commonly imaged using etalons.
- In gravitational wave detection, a Fabry–Pérot cavity is used to store photons for almost a millisecond while they bounce up and down between the mirrors. This increases the time a gravitational wave can interact with the light, which results in a better sensitivity at low frequencies. This principle is used by detectors such as LIGO and Virgo, which consist of a Michelson interferometer with a Fabry–Pérot cavity with a length of several kilometers in both arms. Smaller cavities, usually called mode cleaners, are used for spatial filtering and frequency stabilization of the main laser.
Theory


The varying transmission function of an etalon is caused by interference between the multiple reflections of light between the two reflecting surfaces. Constructive interference occurs if the transmitted beams are in phase, and this corresponds to a high-transmission peak of the etalon. If the transmitted beams are out-of-phase, destructive interference occurs and this corresponds to a transmission minimum. Whether the multiply reflected beams are in phase or not depends on the wavelength (λ) of the light (in vacuum), the angle the light travels through the etalon (θ), the thickness of the etalon (ℓ) and the refractive index of the material between the reflecting surfaces (n).
The phase difference between each successive transmitted pair (i.e. T2 - T1 in the diagram) is given by δ:[6]

If both surfaces have a reflectance R, the transmittance function of the etalon is given by

where

is the coefficient of finesse.
Maximum transmission () occurs when the optical path length difference () between each transmitted beam is an integer multiple of the wavelength. In the absence of absorption, the reflectance of the etalon Re is the complement of the transmittance, such that . The maximum reflectivity is given by:


and this occurs when the path-length difference is equal to half an odd multiple of the wavelength.
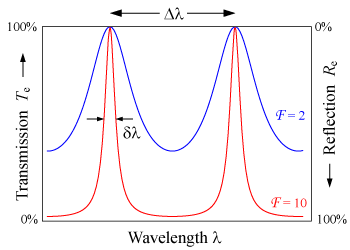
The wavelength separation between adjacent transmission peaks is called the free spectral range (FSR) of the etalon, Δλ, and is given by:

where λ0 is the central wavelength of the nearest transmission peak and is the group refractive index. The FSR is related to the full-width half-maximum, δλ, of any one transmission band by a quantity known as the finesse:

- .

This is commonly approximated (for R > 0.5) by
- .

If the two mirrors are not equal, the finesse becomes
- .

Etalons with high finesse show sharper transmission peaks with lower minimum transmission coefficients. In the oblique incidence case, the finesse will depend on the polarization state of the beam, since the value of "R", given by the Fresnel equations, is generally different for p and s polarizations.
A Fabry–Pérot interferometer differs from a Fabry–Pérot etalon in the fact that the distance ℓ between the plates can be tuned in order to change the wavelengths at which transmission peaks occur in the interferometer. Due to the angle dependence of the transmission, the peaks can also be shifted by rotating the etalon with respect to the beam.
Fabry–Pérot interferometers or etalons are used in optical modems, spectroscopy, lasers, and astronomy.
A related device is the Gires–Tournois etalon.
Detailed analysis


Two beams are shown in the diagram at the right, one of which (T0) is transmitted through the etalon, and the other of which (T1) is reflected twice before being transmitted. At each reflection, the amplitude is reduced by , while at each transmission through an interface the amplitude is reduced by . Assuming no absorption, conservation of energy requires T + R = 1. In the derivation below, n is the index of refraction inside the etalon, and n0 is that outside the etalon. It is presumed that n > n0. The incident amplitude at point a is taken to be one, and phasors are used to represent the amplitude of the radiation. The transmitted amplitude at point b will then be


- ,

where is the wavenumber inside the etalon and λ is the vacuum wavelength. At point c the transmitted amplitude will be

- .

The total amplitude of both beams will be the sum of the amplitudes of the two beams measured along a line perpendicular to the direction of the beam. The amplitude t0 at point b can therefore be added to t'1 retarded in phase by an amount where is the wavenumber outside of the etalon. Thus


- ,

where ℓ0 is
- .

The phase difference between the two beams is
- .

The relationship between θ and θ0 is given by Snell's law:
- ,

so that the phase difference may be written:
- .

To within a constant multiplicative phase factor, the amplitude of the mth transmitted beam can be written as:
- .

The total transmitted amplitude is the sum of all individual beams' amplitudes:

The series is a geometric series whose sum can be expressed analytically. The amplitude can be rewritten as
- .

The intensity of the beam will be just t times its complex conjugate. Since the incident beam was assumed to have an intensity of one, this will also give the transmission function:

For an asymmetrical cavity, that is, one with two different mirrors, the general form of the transmission function is

Another expression for the transmission function
Defining the above expression may be written as:


The second term is proportional to a wrapped Lorentzian distribution so that the transmission function may be written as a series of Lorentzian functions:

where

Physically these Lorentzian functions are the spectral profiles of the individual cavity modes.[7] They are derived by Fourier transformation of the exponential decay of light out of the Fabry-Pérot etalon by transmission through the two mirrors.
See also
- Lummer–Gehrcke interferometer
- Atomic line filter
- ARROW waveguide
- Distributed Bragg reflector
- Fiber Bragg grating
- Optical microcavity
- Thin-film interference
Notes
- ↑ Perot frequently spelled his name with an accent—Pérot—in scientific publications, and so the name of the interferometer is commonly written with the accent. Métivier, Françoise (September–October 2006). "Jean-Baptiste Alfred Perot" (pdf). Photoniques (in French) (25). Retrieved 2007-10-02. Page 2: "Pérot ou Perot?"
- ↑ Fabry, C; Perot, A (1899). "Theorie et applications d'une nouvelle methode de spectroscopie interferentielle". Ann. Chim. Phys. 16 (7).
- ↑ Perot, A; Fabry, C (1899). "On the Application of Interference Phenomena to the Solution of Various Problems of Spectroscopy and Metrology". Astrophysical Journal. 9.
- ↑ Oxford English Dictionary
- ↑ Williams, Benjamin S. (2007). "Terahertz quantum-cascade lasers". Nature Photonics. 1 (9): 517–525. doi:10.1038/nphoton.2007.166. ISSN 1749-4885.
- ↑ Lipson, S.G.; Lipson, H.; Tannhauser, D.S. (1995). Optical Physics (3rd ed.). London: Cambridge U.P. p. 248. ISBN 0-521-06926-2.
- ↑ , Ismail N., C. C. Kores, D. Geskus, and M. Pollnau (2016). "Fabry-Pérot resonator: spectral line shapes, generic and related Airy distributions, linewidths, finesses, and performance at low or frequency-dependent reflectivity". Optics Express 24 (15): 16366–16389. doi:10.1364/OE.24.016366.
References
- Hernandez, G. (1986). Fabry–Pérot Interferometers. Cambridge: Cambridge University Press. ISBN 0-521-32238-3.
External links
- Compact FP interferometer for gas analysis
- Advanced Design of Etalons- by Precision Photonics Corporation