Discrete uniform distribution
|
Probability mass function
| |
|
Cumulative distribution function
| |
| Notation | or |
|---|---|
| Parameters |
|
| Support | |
| pmf | |
| CDF | |
| Mean | |
| Median | |
| Mode | N/A |
| Variance | |
| Skewness | |
| Ex. kurtosis | |
| Entropy | |
| MGF | |
| CF | |
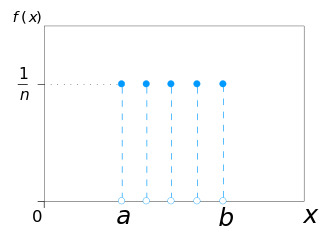


In probability theory and statistics, the discrete uniform distribution is a symmetric probability distribution whereby a finite number of values are equally likely to be observed; every one of n values has equal probability 1/n. Another way of saying "discrete uniform distribution" would be "a known, finite number of outcomes equally likely to happen".
A simple example of the discrete uniform distribution is throwing a fair dice. The possible values are 1, 2, 3, 4, 5, 6, and each time the dice is thrown the probability of a given score is 1/6. If two dice are thrown and their values added, the resulting distribution is no longer uniform since not all sums have equal probability.
The discrete uniform distribution itself is inherently non-parametric. It is convenient, however, to represent its values generally by an integer interval [a,b], so that a,b become the main parameters of the distribution (often one simply considers the interval [1,n] with the single parameter n). With these conventions, the cumulative distribution function (CDF) of the discrete uniform distribution can be expressed, for any k ∈ [a,b], as

Estimation of maximum
This example is described by saying that a sample of k observations is obtained from a uniform distribution on the integers , with the problem being to estimate the unknown maximum N. This problem is commonly known as the German tank problem, following the application of maximum estimation to estimates of German tank production during World War II.

The UMVU estimator for the maximum is given by

where m is the sample maximum and k is the sample size, sampling without replacement.[1][2] This can be seen as a very simple case of maximum spacing estimation.
The formula may be understood intuitively as:
- "The sample maximum plus the average gap between observations in the sample",
the gap being added to compensate for the negative bias of the sample maximum as an estimator for the population maximum.[notes 1]
This has a variance of[1]

so a standard deviation of approximately , the (population) average size of a gap between samples; compare above.


The sample maximum is the maximum likelihood estimator for the population maximum, but, as discussed above, it is biased.
If samples are not numbered but are recognizable or markable, one can instead estimate population size via the capture-recapture method.
Random permutation
See rencontres numbers for an account of the probability distribution of the number of fixed points of a uniformly distributed random permutation.
See also
Notes
- ↑ The sample maximum is never more than the population maximum, but can be less, hence it is a biased estimator: it will tend to underestimate the population maximum.
References
- 1 2 Johnson, Roger (1994), "Estimating the Size of a Population", Teaching Statistics, 16 (2 (Summer)), doi:10.1111/j.1467-9639.1994.tb00688.x External link in
|journal=(help) - ↑ Johnson, Roger (2006), "Estimating the Size of a Population" (PDF), Getting the Best from Teaching Statistics