California's 11th congressional district
| California's 11th congressional district | ||
|---|---|---|
.tif.png) | ||
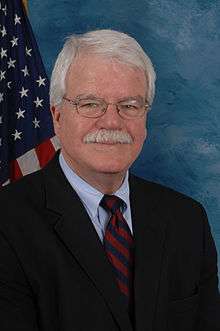
| Current Representative | Mark DeSaulnier (D–Concord) | |
| Ethnicity | 48.6% White, 9.4% Black, 14.5% Asian, 25.6% Hispanic, 1.9[1]% other | |
| Cook PVI | D+17 | |
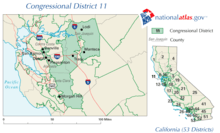
California's 11th congressional district is a congressional district in the U.S. state of California.
Mark DeSaulnier, a Democrat, has represented the district since January 2015.
Currently, the 11th district consists of portions of Contra Costa County. Cities in the district include Concord, El Cerrito, Orinda, Pittsburg, and Richmond.[2]
Prior to redistricting by the California Citizens Redistricting Commission of 2011, the 11th district consisted of portions of Alameda, Contra Costa, San Joaquin, and Santa Clara counties.
History
Election results from statewide races
| Election results from statewide races | ||
|---|---|---|
| Year | Office | Results |
| 2010 | Governor[3] | Whitman 48.9 - 46.7% |
| Senator[4] | Fiorina 50.7 - 43.8% | |
| 2008 | President[5] | Obama 53.8 - 44.5% |
| 2006 | Governor[6] | Schwarzenegger 65.3 - 31.1% |
| Senator[7] | Feinstein 55.4 - 40.3% | |
| 2004 | President[8] | Bush 53.9 - 45.3% |
| Senator[9] | Boxer 50.2 - 46.6% | |
| 2003 | Recall[10][11] | Yes 60.8 - 39.2% |
| Schwarzenegger 51.5 - 24.1% | ||
| 2002 | Governor[12] | Simon 50.5 - 40.9% |
| 2000 | President[13] | Bush 49.7 - 46.6% |
| Senator[14] | Feinstein 51.8 - 42.2% | |
| 1998 | Governor[15] | Davis 52.0 - 45.7% |
| Senator[16] | Fong 49.1 - 47.1% | |
| 1996 | President | |
| 1994 | Governor | |
| Senator | ||
| 1992 | President | Clinton 40.6 - 38.5% |
| Senator | Herschensohn 47.3 - 42.3% | |
| Senator | Feinstein 48.7 - 47.6% | |
List of representatives
| Representative | Party | Dates | Notes | Counties |
|---|---|---|---|---|
| District created | March 4, 1913 | |||
 William Kettner William Kettner |
Democratic | March 4, 1913 – March 3, 1921 | Retired | Imperial, Inyo, Mono, Orange, Riverside, San Bernardino, San Diego |
 Phil Swing Phil Swing |
Republican | March 4, 1921 – March 3, 1933 | Retired | |
| William E. Evans |
Republican | March 4, 1933 – January 3, 1935 | Redistricted from the 9th district Lost re-election |
Los Angeles |
 John S. McGroarty John S. McGroarty |
Democratic | January 3, 1935 – January 3, 1939 | Retired to run for Secretary of State of California | |
 John Carl Hinshaw John Carl Hinshaw |
Republican | January 3, 1939 – January 3, 1943 | Redistricted to the 20th district | |
| George E. Outland |
Democratic | January 3, 1943 – January 3, 1947 | Lost re-election | Monterey, San Luis Obispo, Santa Barbara, Ventura |
 Ernest K. Bramblett Ernest K. Bramblett |
Republican | January 3, 1947 – January 3, 1953 | Redistricted to the 13th district | |
 Justin L. Johnson Justin L. Johnson |
Republican | January 3, 1953 – January 3, 1957 | Redistricted from the 3rd district Lost re-election |
San Joaquin, Stanislaus |
 John J. McFall John J. McFall |
Democratic | January 3, 1957 – January 3, 1963 | Redistricted to the 15th district | |
 J. Arthur Younger J. Arthur Younger |
Republican | January 3, 1963 – June 20, 1967 | Redistricted from the 9th district Died |
San Mateo |
| Vacant | June 20, 1967 – December 12, 1967 | |||
 Pete McCloskey Pete McCloskey |
Republican | December 12, 1967 – January 3, 1973 | Redistricted to the 17th district | |
 Leo Ryan Leo Ryan |
Democratic | January 3, 1973 – November 18, 1978 | Murdered in Port Kaituma, Guyana by members of Peoples Temple | Northern San Mateo |
| Vacant | November 18, 1978 – April 3, 1979 | |||
| William Royer |
Republican | April 3, 1979 – January 3, 1981 | Lost re-election | |
 Tom Lantos Tom Lantos |
Democratic | January 3, 1981 – January 3, 1983 | ||
| January 3, 1983 – January 3, 1993 | Redistricted to the 12th district | Most of San Mateo | ||
 Richard Pombo Richard Pombo |
Republican | January 3, 1993 – January 3, 2003 | Most of Sacramento and San Joaquin | |
| January 3, 2003 – January 3, 2007 | Lost re-election | Eastern Alameda, southern and southeastern Contra Costa, most of San Joaquin, eastern Santa Clara | ||
 Jerry McNerney Jerry McNerney |
Democratic | January 3, 2007 – January 3, 2013 | Redistricted to the 9th district | |
 George Miller George Miller |
Democratic | January 3, 2013 – January 3, 2015 | Redistricted from the 7th district Retired |
East Bay including Concord and Richmond |
 Mark DeSaulnier Mark DeSaulnier |
Democratic | January 3, 2015 – | ||
Election results
|
1912 • 1914 • 1916 • 1918 • 1920 • 1922 • 1924 • 1926 • 1928 • 1930 • 1932 • 1934 • 1936 • 1938 • 1940 • 1942 • 1944 • 1946 • 1948 • 1950 • 1952 • 1954 • 1956 • 1958 • 1960 • 1962 • 1964 • 1966 • 1967 (Special) • 1968 • 1970 • 1972 • 1974 • 1976 • 1978 • 1979 (Special) • 1980 • 1982 • 1984 • 1986 • 1988 • 1990 • 1992 • 1994 • 1996 • 1998 • 2000 • 2002 • 2004 • 2006 • 2008 • 2010 • 2012 |
1912
| Party | Candidate | Votes | % | |||
|---|---|---|---|---|---|---|
| Democratic | William Kettner | 24,822 | 42.7 | |||
| Republican | Samuel C. Evans | 21,426 | 36.8 | |||
| Socialist | Noble A. Richardson | 7,059 | 12.1 | |||
| Prohibition | Helen M. Stoddard | 4,842 | 8.3 | |||
| Total votes | 46,248 | 100.0 | ||||
| Voter turnout | % | |||||
| Democratic gain from Republican | ||||||
1914
| Party | Candidate | Votes | % | |
|---|---|---|---|---|
| Democratic | William Kettner (incumbent) | 47,165 | 52.7 | |
| Republican | James Carson Needham | 25,001 | 27.9 | |
| Prohibition | James S. Edwards | 11,278 | 12.7 | |
| Socialist | Casper Bauer | 6,033 | 6.7 | |
| Total votes | 89,477 | 100.0 | ||
| Voter turnout | % | |||
| Democratic hold | ||||
1916
| Party | Candidate | Votes | % | |
|---|---|---|---|---|
| Democratic | William Kettner (incumbent) | 42,051 | 44.5 | |
| Republican | Robert C. Harbison | 33,765 | 35.7 | |
| Prohibition | James S. Edwards | 14,759 | 15.6 | |
| Socialist | Marcus W. Robbins | 3,913 | 4.1 | |
| Total votes | 94,488 | 100.0 | ||
| Voter turnout | % | |||
| Democratic hold | ||||
1918
| Party | Candidate | Votes | % | |
|---|---|---|---|---|
| Democratic | William Kettner (incumbent) | 45,915 | 72.2 | |
| Prohibition | Stella B. Irvine | 17,642 | 27.8 | |
| Total votes | 63,557 | 100.0 | ||
| Voter turnout | % | |||
| Democratic hold | ||||
1920
| Party | Candidate | Votes | % | |||
|---|---|---|---|---|---|---|
| Republican | Phil Swing | 59,425 | 72.9 | |||
| Democratic | Hugh L. Dickson | 22,144 | 27.1 | |||
| Total votes | 81,569 | 100.0 | ||||
| Voter turnout | % | |||||
| Republican gain from Democratic | ||||||
1922
| Party | Candidate | Votes | % | |
|---|---|---|---|---|
| Republican | Phil Swing (incumbent) | 79,039 | 91.4 | |
| Prohibition | Charles H. Randall | 7,466 | 8.6 | |
| Total votes | 86,505 | 100.0 | ||
| Voter turnout | % | |||
| Republican hold | ||||
1924
| Party | Candidate | Votes | % | |
|---|---|---|---|---|
| Republican | Phil Swing (incumbent) | 93,811 | 100.0 | |
| Voter turnout | % | |||
| Republican hold | ||||
1926
| Party | Candidate | Votes | % | |
|---|---|---|---|---|
| Republican | Phil Swing (incumbent) | 89,726 | 100.0 | |
| Voter turnout | % | |||
| Republican hold | ||||
1928
| Party | Candidate | Votes | % | |
|---|---|---|---|---|
| Republican | Phil Swing (incumbent) | 127,115 | 100.0 | |
| Voter turnout | % | |||
| Republican hold | ||||
1930
| Party | Candidate | Votes | % | |
|---|---|---|---|---|
| Republican | Phil Swing (incumbent) | 124,092 | 100.0 | |
| Voter turnout | % | |||
| Republican hold | ||||
1932
| Party | Candidate | Votes | % | |
|---|---|---|---|---|
| Republican | William E. Evans (inc.) | 57,739 | 51.8 | |
| Democratic | Albert D. Hadley | 38,240 | 34.3 | |
| Liberty | Marshall V. Hartranft | 15,520 | 13.9 | |
| Total votes | 111,499 | 100.0 | ||
| Voter turnout | % | |||
| Republican hold | ||||
1934
| Party | Candidate | Votes | % | |||
|---|---|---|---|---|---|---|
| Democratic | John S. McGroarty | 66,999 | 53.5 | |||
| Republican | William E. Evans (inc.) | 56,350 | 45.0 | |||
| Socialist | William E. Stephenson | 1,814 | 1.5 | |||
| Total votes | 125,163 | 100.0 | ||||
| Voter turnout | % | |||||
| Democratic gain from Republican | ||||||
1936
| Party | Candidate | Votes | % | |
|---|---|---|---|---|
| Democratic | John S. McGroarty (inc.) | 69,679 | 50.5 | |
| Republican | John Carl Hinshaw | 54,914 | 39.8 | |
| Progressive | Robert S. Funk | 12,340 | 8.9 | |
| Communist | William Ingham | 1,041 | 0.8 | |
| Total votes | 137,974 | 100.0 | ||
| Voter turnout | % | |||
| Democratic hold | ||||
1938
| Party | Candidate | Votes | % | |||
|---|---|---|---|---|---|---|
| Republican | John Carl Hinshaw | 68,712 | 47.0 | |||
| Democratic | Carl Stuart Hamblen | 59,993 | 41.1 | |||
| Townsend | Ralph D. Horton | 12,713 | 8.7 | |||
| Progressive | John R. Grey | 3,821 | 2.6 | |||
| Communist | Orla E. Lair | 817 | 0.6 | |||
| Total votes | 146,056 | 100.0 | ||||
| Voter turnout | % | |||||
| Republican gain from Democratic | ||||||
1940
| Party | Candidate | Votes | % | |
|---|---|---|---|---|
| Republican | John Carl Hinshaw (inc.) | 170,504 | 96.6 | |
| Communist | Orla E. Lair | 6,003 | 3.4 | |
| Total votes | 176,507 | 100.0 | ||
| Voter turnout | % | |||
| Republican hold | ||||
1942
| Party | Candidate | Votes | % | ||
|---|---|---|---|---|---|
| Democratic | George E. Outland | 31,611 | 50.7 | ||
| Republican | A. J. Dingeman | 30,781 | 49.3 | ||
| Total votes | 62,392 | 100.0 | |||
| Voter turnout | % | ||||
| Democratic win (new seat) | |||||
1944
| Party | Candidate | Votes | % | |
|---|---|---|---|---|
| Democratic | George E. Outland (inc.) | 52,218 | 56 | |
| Republican | A. J. Dingeman | 41,005 | 44 | |
| Total votes | 93,223 | 100 | ||
| Voter turnout | % | |||
| Democratic hold | ||||
1946
| Party | Candidate | Votes | % | |||
|---|---|---|---|---|---|---|
| Republican | Ernest K. Bramblett | 41,902 | 53.1 | |||
| Democratic | George E. Outland (inc.) | 36,996 | 46.9 | |||
| Total votes | 78,898 | 100.0 | ||||
| Voter turnout | % | |||||
| Republican gain from Democratic | ||||||
1948
| Party | Candidate | Votes | % | |
|---|---|---|---|---|
| Republican | Ernest K. Bramblett (inc.) | 87,143 | 80.8 | |
| Progressive | Cole Weston | 14,582 | 13.5 | |
| Democratic | George E. Outland (write-in) | 6,157 | 5.7 | |
| Total votes | 107,882 | 100.0 | ||
| Voter turnout | % | |||
| Republican hold | ||||
1950
| Party | Candidate | Votes | % | |
|---|---|---|---|---|
| Republican | Ernest K. Bramblett (inc.) | 59,780 | 52.1 | |
| Democratic | Ardis M. Walker | 55,020 | 47.9 | |
| Total votes | 114,800 | 100.0 | ||
| Voter turnout | % | |||
| Republican hold | ||||
1952
| Party | Candidate | Votes | % | |
|---|---|---|---|---|
| Republican | Justin L. Johnson (incumbent) | 101,052 | 87.1 | |
| Progressive | Leslie B. Schilingheyde | 14,999 | 12.9 | |
| Total votes | 116,051 | 100.0 | ||
| Voter turnout | % | |||
| Republican hold | ||||
1954
| Party | Candidate | Votes | % | |
|---|---|---|---|---|
| Republican | Justin L. Johnson (incumbent) | 54,716 | 52.6 | |
| Democratic | Carl Sugar | 49,388 | 47.4 | |
| Total votes | 104,104 | 100.0 | ||
| Voter turnout | % | |||
| Republican hold | ||||
1956
| Party | Candidate | Votes | % | |||
|---|---|---|---|---|---|---|
| Democratic | John J. McFall | 70,630 | 53.1 | |||
| Republican | Justin L. Johnson (incumbent) | 62,448 | 46.9 | |||
| Total votes | 133,078 | 100.0 | ||||
| Voter turnout | % | |||||
| Democratic gain from Republican | ||||||
1958
| Party | Candidate | Votes | % | |
|---|---|---|---|---|
| Democratic | John J. McFall (incumbent) | 86,924 | 69.3 | |
| Republican | Frederick S. Van Dyke | 38,427 | 30.7 | |
| Total votes | 125,351 | 100.0 | ||
| Voter turnout | % | |||
| Democratic hold | ||||
1960
| Party | Candidate | Votes | % | |
|---|---|---|---|---|
| Democratic | John J. McFall (incumbent) | 97,368 | 65.4 | |
| Republican | Clifford B. Bull | 51,473 | 34.6 | |
| Total votes | 148,841 | 100.0 | ||
| Voter turnout | % | |||
| Democratic hold | ||||
1962
| Party | Candidate | Votes | % | |
|---|---|---|---|---|
| Republican | J. Arthur Younger (incumbent) | 101,963 | 62.3 | |
| Democratic | John D. Kaster | 61,623 | 37.7 | |
| Total votes | 163,586 | 100.0 | ||
| Voter turnout | % | |||
| Republican hold | ||||
1964
| Party | Candidate | Votes | % | |
|---|---|---|---|---|
| Republican | J. Arthur Younger (incumbent) | 116,022 | 54.8 | |
| Democratic | W. Mark Sullivan | 95,747 | 45.2 | |
| Total votes | 211,769 | 100.0 | ||
| Voter turnout | % | |||
| Republican hold | ||||
1966
| Party | Candidate | Votes | % | |
|---|---|---|---|---|
| Republican | J. Arthur Younger (incumbent) | 113,679 | 59.4 | |
| Democratic | W. Mark Sullivan | 77,605 | 40.6 | |
| Total votes | 191,284 | 100.0 | ||
| Voter turnout | % | |||
| Republican hold | ||||
1967 (Special)
| Party | Candidate | Votes | % | |
|---|---|---|---|---|
| Republican | Pete McCloskey | 63,850 | 57.2 | |
| Democratic | Roy A. Archibald | 43,759 | 39.2 | |
| Independent | Shirley Temple Black | 3,938 | 3.5 | |
| Total votes | 111,547 | 100.0 | ||
| Voter turnout | % | |||
| Republican hold | ||||
1968
| Party | Candidate | Votes | % | |
|---|---|---|---|---|
| Republican | Pete McCloskey (incumbent) | 165,482 | 79.3 | |
| Democratic | Urban G. Whitaker, Jr. | 40,979 | 19.6 | |
| Peace and Freedom | David Demorest Ransom | 2,157 | 1.0 | |
| Total votes | 208,618 | 100.0 | ||
| Voter turnout | % | |||
| Republican hold | ||||
1970
| Party | Candidate | Votes | % | |
|---|---|---|---|---|
| Republican | Pete McCloskey (incumbent) | 144,500 | 77.5 | |
| Democratic | Robert E. Gomperts | 39,188 | 21.0 | |
| Independent | Scattering | 2,786 | 1.5 | |
| Total votes | 186,474 | 100.0 | ||
| Voter turnout | % | |||
| Republican hold | ||||
1972
| Party | Candidate | Votes | % | ||
|---|---|---|---|---|---|
| Democratic | Leo Ryan | 113,580 | 60.4 | ||
| Republican | Charles E. Chase | 69,655 | 37.0 | ||
| American Independent | Nicholas Waeil Kudrovzeff | 4,852 | 2.6 | ||
| Total votes | 188,087 | 100.0 | |||
| Voter turnout | % | ||||
| Democratic win (new seat) | |||||
1974
| Party | Candidate | Votes | % | |
|---|---|---|---|---|
| Democratic | Leo Ryan (incumbent) | 106,075 | 75.8 | |
| Republican | Bob Jones | 29,783 | 21.3 | |
| American Independent | Nicholas Waeil Kudrovzeff | 4,293 | 2.9 | |
| Total votes | 140,151 | 100.0 | ||
| Voter turnout | % | |||
| Democratic hold | ||||
1976
| Party | Candidate | Votes | % | |
|---|---|---|---|---|
| Democratic | Leo Ryan (incumbent) | 107,618 | 61.1 | |
| Republican | Bob Jones | 62,435 | 35.4 | |
| American Independent | Nicholas Waeil Kudrovzeff | 6,141 | 3.5 | |
| Total votes | 176,194 | 100.0 | ||
| Voter turnout | % | |||
| Democratic hold | ||||
1978
| Party | Candidate | Votes | % | |
|---|---|---|---|---|
| Democratic | Leo Ryan (incumbent) | 92,882 | 60.5 | |
| Republican | Dave Welch | 54,621 | 35.6 | |
| American Independent | Nicholas Waeil Kudrovzeff | 5,961 | 3.9 | |
| Total votes | 153,464 | 100.0 | ||
| Voter turnout | % | |||
| Democratic hold | ||||
1979 (Special)
| Party | Candidate | Votes | % | |||
|---|---|---|---|---|---|---|
| Republican | William Royer | 52,585 | 57.3 | |||
| Democratic | G.W. "Joe" Holsinger | 37,685 | 41.1 | |||
| American Independent | Nicholas W. Kudrovzeff | 770 | 0.8 | |||
| Peace and Freedom | Wilson G. Branch | 731 | 0.8 | |||
| Total votes | 91,771 | 100.0 | ||||
| Voter turnout | % | |||||
| Republican gain from Democratic | ||||||
1980
| Party | Candidate | Votes | % | |||
|---|---|---|---|---|---|---|
| Democratic | Tom Lantos | 85,823 | 46.4 | |||
| Republican | William Royer (incumbent) | 80,100 | 43.3 | |||
| Peace and Freedom | Wilson G. Branch | 13,723 | 7.4 | |||
| Libertarian | William S. Wade Jr. | 3,816 | 2.1 | |||
| American Independent | Nicholas W. Kudrovzeff | 1,550 | 0.8 | |||
| Total votes | 185,012 | 100.0 | ||||
| Voter turnout | % | |||||
| Democratic gain from Republican | ||||||
1982
| Party | Candidate | Votes | % | |
|---|---|---|---|---|
| Democratic | Tom Lantos (incumbent) | 109,812 | 57.1 | |
| Republican | William Royer | 76,462 | 39.7 | |
| Libertarian | Chuck Olson | 2,920 | 1.5 | |
| Peace and Freedom | Wilson G. Branch | 1,928 | 1.0 | |
| American Independent | Nicholas W. Kudrovzeff | 1,250 | 0.6 | |
| Total votes | 192,372 | 100.0 | ||
| Voter turnout | % | |||
| Democratic hold | ||||
1984
| Party | Candidate | Votes | % | |
|---|---|---|---|---|
| Democratic | Tom Lantos (incumbent) | 147,607 | 69.9 | |
| Republican | John J. "Jack" Hickey | 59,625 | 28.2 | |
| American Independent | Nicholas W. Kudrovzeff | 3,883 | 1.8 | |
| Total votes | 211,115 | 100.0 | ||
| Voter turnout | % | |||
| Democratic hold | ||||
1986
| Party | Candidate | Votes | % | |
|---|---|---|---|---|
| Democratic | Tom Lantos (incumbent) | 112,380 | 74.1 | |
| Republican | Bill Quarishi | 39,315 | 25.9 | |
| Total votes | 151,695 | 100.0 | ||
| Voter turnout | % | |||
| Democratic hold | ||||
1988
| Party | Candidate | Votes | % | |
|---|---|---|---|---|
| Democratic | Tom Lantos (incumbent) | 145,484 | 71.0 | |
| Republican | Bill Quarishi | 50,050 | 24.4 | |
| Libertarian | Bill Wade | 4,683 | 2.3 | |
| Peace and Freedom | Victor Martinez | 2,906 | 1.4 | |
| American Independent | Nicholas W. Kudrovzeff | 1,893 | 0.9 | |
| Total votes | 205,016 | 100.0 | ||
| Voter turnout | % | |||
| Democratic hold | ||||
1990
| Party | Candidate | Votes | % | |
|---|---|---|---|---|
| Democratic | Tom Lantos (incumbent) | 105,029 | 65.9 | |
| Republican | Bill Quarishi | 45,818 | 28.8 | |
| Libertarian | June R. Genis | 8,518 | 5.3 | |
| Total votes | 159,365 | 100.0 | ||
| Voter turnout | % | |||
| Democratic hold | ||||
1992
| Party | Candidate | Votes | % | ||
|---|---|---|---|---|---|
| Republican | Richard Pombo | 94,453 | 47.6 | ||
| Democratic | Patti Garamendi | 90,539 | 45.6 | ||
| Libertarian | Christine Roberts | 13,498 | 6.8 | ||
| Total votes | 198,490 | 100.0 | |||
| Voter turnout | % | ||||
| Republican win (new seat) | |||||
1994
| Party | Candidate | Votes | % | |
|---|---|---|---|---|
| Republican | Richard Pombo (incumbent) | 99,302 | 62.14 | |
| Democratic | Randy A. Perry | 55,794 | 34.91 | |
| Libertarian | Joseph B. Miller | 4,718 | 2.95 | |
| Total votes | 159,814 | 100.0 | ||
| Voter turnout | % | |||
| Republican hold | ||||
1996
| Party | Candidate | Votes | % | |
|---|---|---|---|---|
| Republican | Richard Pombo (incumbent) | 107,477 | 59.4 | |
| Democratic | Jason Silva | 65,536 | 36.2 | |
| Libertarian | Kelly Rego | 5,077 | 2.8 | |
| Natural Law | Selene Bush | 3,006 | 1.6 | |
| Total votes | 181,096 | 100.0 | ||
| Voter turnout | % | |||
| Republican hold | ||||
1998
| Party | Candidate | Votes | % | |
|---|---|---|---|---|
| Republican | Richard Pombo (incumbent) | 95,496 | 61.43 | |
| Democratic | Robert L. Figueroa | 56,345 | 36.25 | |
| Libertarian | Jesse Baird | 3,608 | 2.32 | |
| Total votes | 155,449 | 100.0 | ||
| Voter turnout | % | |||
| Republican hold | ||||
2000
| Party | Candidate | Votes | % | |
|---|---|---|---|---|
| Republican | Richard Pombo (incumbent) | 120,635 | 57.9 | |
| Democratic | Tom Y. Santos | 79,539 | 38.1 | |
| Libertarian | Kathryn A. Russow | 5,036 | 2.4 | |
| Natural Law | Jon A. Kurey | 3,397 | 1.6 | |
| Total votes | 208,607 | 100.0 | ||
| Voter turnout | % | |||
| Republican hold | ||||
2002
| Party | Candidate | Votes | % | |
|---|---|---|---|---|
| Republican | Richard Pombo (incumbent) | 104,921 | 60.4 | |
| Democratic | Elaine Shaw | 69,035 | 39.6 | |
| Total votes | 173,956 | 100.0 | ||
| Voter turnout | % | |||
| Republican hold | ||||
2004
| Party | Candidate | Votes | % | |
|---|---|---|---|---|
| Republican | Richard Pombo (incumbent) | 163,582 | 61.3 | |
| Democratic | Jerry McNerney | 103,587 | 38.7 | |
| Total votes | 267,169 | 100.0 | ||
| Voter turnout | % | |||
| Republican hold | ||||
2006
| Party | Candidate | Votes | % | |||
|---|---|---|---|---|---|---|
| Democratic | Jerry McNerney | 109,868 | 53.3 | |||
| Republican | Richard Pombo (incumbent) | 96,396 | 46.7 | |||
| Total votes | 206,264 | 100.0 | ||||
| Voter turnout | % | |||||
| Democratic gain from Republican | ||||||
2008
| Party | Candidate | Votes | % | |
|---|---|---|---|---|
| Democratic | Jerry McNerney (incumbent) | 164,500 | 55.3 | |
| Republican | Dean Andal | 133,104 | 44.7 | |
| Total votes | 297,616 | 100.0 | ||
| Voter turnout | % | |||
| Democratic hold | ||||
2010
| Party | Candidate | Votes | % | |
|---|---|---|---|---|
| Democratic | Jerry McNerney (incumbent) | 115,361 | 47.97 | |
| Republican | David Harmer | 112,703 | 46.86 | |
| American Independent | David Christensen | 12,439 | 5.17 | |
| Total votes | 240,503 | 100.00 | ||
| Voter turnout | % | |||
2012
| Party | Candidate | Votes | % | |
|---|---|---|---|---|
| Democratic | George Miller (incumbent) | 200,743 | 69.7 | |
| Republican | Virginia Fuller | 87,136 | 30.3 | |
| Total votes | 287,879 | 100.0 | ||
| Democratic hold | ||||
2014
| Party | Candidate | Votes | % | |
|---|---|---|---|---|
| Democratic | Mark DeSaulnier (incumbent) | 117,502 | 67% | |
| Republican | Tue Phan | 57,160 | 33% | |
| Total votes | 174,662 | 100.0% | ||
| Democratic hold | ||||
Living former Members
As of April 2015, there are four former members of the U.S. House of Representatives from California's 11th congressional district that are currently living.
| Representative | Term in office | Date of birth (and age) |
|---|---|---|
| Pete McCloskey | 1967 - 1973 | September 29, 1927 |
| Richard Pombo | 1993 - 2007 | January 8, 1961 |
| George Miller | 2013 - 2015 | May 17, 1945 |
Historical district boundaries
See also
References
- ↑ "California election results - 2012 election". Los Angeles Times. Retrieved February 24, 2013.
- ↑ "Maps: Final Congressional Districts". Citizens Redistricting Commission. Retrieved February 24, 2013.
- ↑ Supplement to the Statement of Vote - Counties by Congressional Districts for Governor
- ↑ Supplement to the Statement of Vote - Counties by Congressional Districts for United States Senator
- ↑ (2008 President)
- ↑ Statement of Vote (2006 Governor)
- ↑ Statement of Vote (2006 Senator)
- ↑ Statement of Vote (2004 President)
- ↑ Statement of Vote (2004 Senator)
- ↑ Statement of Vote (2003 Recall Question)
- ↑ Statement of Vote (2003 Governor)
- ↑ Statement of Vote (2002 Governor)
- ↑ Statement of Vote (2000 President)
- ↑ Statement of Vote (2000 Senator)
- ↑ Supplement To The Statement Of Vote - November 3, 1998 General Election Counties by Congressional Districts
- ↑ Supplement to the Statement of Vote - November 3, 1998 Election Counties by Congressional Districts
- ↑ 1920 election results
- ↑ 1922 election results
- ↑ 1924 election results
- ↑ 1926 election results
- ↑ 1928 election results
- ↑ 1930 election results
- ↑ 1932 election results
- ↑ 1934 election results
- ↑ 1936 election results
- ↑ 1938 election results
- ↑ 1940 election results
- ↑ 1942 election results
- ↑ 1944 election results
- ↑ 1946 election results
- ↑ 1948 election results
- ↑ 1950 election results
- ↑ 1952 election results
- ↑ 1954 election results
- ↑ 1956 election results
- ↑ 1958 election results
- ↑ 1960 election results
- ↑ 1962 election results
- ↑ 1964 election results
- ↑ 1966 election results
- ↑ Michael J. Dubin, "United States Congressional Elections, 1788-1997: The Official Results", McFarland & Company Inc, Jefferson, North Carolina, 1998, p. 656.
- ↑ 1968 election results
- ↑ 1970 election results
- ↑ 1972 election results
- ↑ 1974 election results
- ↑ 1976 election results
- ↑ 1978 election results
- ↑ Michael J. Dubin, "United States Congressional Elections, 1788-1997: The Official Results", McFarland & Company Inc, Jefferson, North Carolina, 1998, p. 714.
- ↑ 1980 election results
- ↑ 1982 election results
- ↑ 1984 election results
- ↑ 1986 election results
- ↑ 1988 election results
- ↑ 1990 election results
- ↑ 1992 election results
- ↑ 1994 election results
- ↑ 1996 election results
- ↑ 1998 election results
- ↑ 2000 election results
- ↑ 2002 general election results Archived February 3, 2009, at the Wayback Machine.
- ↑ 2004 general election results
- ↑ 2006 general election results Archived November 27, 2008, at the Wayback Machine.
- ↑ 2012 general election results Archived October 19, 2013, at the Wayback Machine.
- ↑ 2014 general election results
External links
- GovTrack.us: California's 11th congressional district
- RAND California Election Returns: District Definitions (out of date)
- California Voter Foundation map - CD11 (out of date)
Coordinates: 37°54′N 122°00′W / 37.9°N 122.0°W