Cambridge (electoral district)
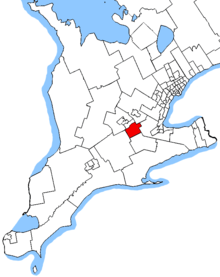 Cambridge in relation to other federal electoral districts in southwestern Ontario (2003 boundaries) | |||
| Federal electoral district | |||
| Legislature | House of Commons | ||
| MP |
| ||
| District created | 1976 | ||
| First contested | 1979 | ||
| Last contested | 2015 | ||
| District webpage | profile, map | ||
| Demographics | |||
| Population (2011)[1] | 111,693 | ||
| Electors (2015) | 82,103 | ||
| Area (km²)[2] | 373 | ||
| Pop. density (per km²) | 299.4 | ||
| Census divisions | Brant, Waterloo | ||
| Census subdivisions | Brant, Cambridge, North Dumfries | ||
Cambridge is a federal electoral district in Ontario, Canada, that has been represented in the House of Commons of Canada since 1979.
Geography
The district consists of the city of Cambridge, Ontario and the Township of North Dumfries, Ontario.
History
The federal electoral district was created in 1976 and consisted of the city of Cambridge and the Township of North Dumfries. In 1987, part of the city of Kitchener was added to the district. In 1996, the boundaries were redrawn again to include a slightly different section of Kitchener. The current boundaries, which are the same as the original definition and contain no parts of Kitchener, were defined in 2003.
This riding lost territory to Kitchener South—Hespeler and gained some territory from Brant during the 2012 electoral redistribution.
Members of Parliament
| Parliament | Years | Member | Party | |
|---|---|---|---|---|
| Cambridge Riding created from Waterloo—Cambridge |
||||
| 31st | 1979–1980 | Chris Speyer | Progressive Conservative | |
| 32nd | 1980–1984 | |||
| 33rd | 1984–1988 | |||
| 34th | 1988–1993 | Pat Sobeski | ||
| 35th | 1993–1997 | Janko Peric | Liberal | |
| 36th | 1997–2000 | |||
| 37th | 2000–2004 | |||
| 38th | 2004–2006 | Gary Goodyear | Conservative | |
| 39th | 2006–2008 | |||
| 40th | 2008–2011 | |||
| 41st | 2011–2015 | |||
| 42nd | 2015–Present | Bryan May | Liberal | |
Election results
| Canadian federal election, 2015 | ||||||||
|---|---|---|---|---|---|---|---|---|
| Party | Candidate | Votes | % | ∆% | Expenditures | |||
| Liberal | Bryan May | 23,024 | 43.17 | +27.72 | – | |||
| Conservative | Gary Goodyear | 20,613 | 38.65 | -14.10 | – | |||
| New Democratic | Bobbi Stewart | 7,397 | 13.87 | -14.04 | – | |||
| Green | Michele Braniff | 1,723 | 3.23 | -0.37 | – | |||
| Independent | Lee Sperduti | 474 | 0.89 | – | – | |||
| Marxist–Leninist | Manuel Couto | 108 | 0.20 | – | ||||
| Total valid votes/Expense limit | 53,339 | 100.00 | $218,828.75 | |||||
| Total rejected ballots | 227 | 0.42 | – | |||||
| Turnout | 53,566 | 64.60 | – | |||||
| Eligible voters | 82,916 | |||||||
| Liberal gain from Conservative | Swing | +20.91 | ||||||
| Source: Elections Canada[3][4] | ||||||||
| 2011 federal election redistributed results[5] | |||
|---|---|---|---|
| Party | Vote | % | |
| Conservative | 23,644 | 52.74 | |
| New Democratic | 12,512 | 27.91 | |
| Liberal | 6,923 | 15.44 | |
| Green | 1,615 | 3.60 | |
| Others | 134 | 0.30 | |
| Canadian federal election, 2011 | ||||||||
|---|---|---|---|---|---|---|---|---|
| Party | Candidate | Votes | % | ∆% | Expenditures | |||
| Conservative | Gary Goodyear | 29,394 | 53.40 | +4.78 | $86,966.51 | |||
| New Democratic | Susan Galvao | 15,238 | 27.68 | +8.07 | $13,379.43 | |||
| Liberal | Bryan May | 8,285 | 15.05 | -8.34 | $26,622.63 | |||
| Green | Jacques Malette | 1,978 | 3.59 | -4.76 | $440.18 | |||
| Marxist–Leninist | Manuel Couto | 153 | 0.28 | – | none listed | |||
| Total valid votes/Expense limit | 55,048 | 100.00 | $96,491.18 | |||||
| Total rejected ballots | 255 | 0.46 | +0.04 | |||||
| Turnout | 55,303 | 59.25 | +3.33 | |||||
| Eligible voters | 93,335 | – | – | |||||
| Canadian federal election, 2008 | ||||||||
|---|---|---|---|---|---|---|---|---|
| Party | Candidate | Votes | % | ∆% | Expenditures | |||
| Conservative | Gary Goodyear | 24,895 | 48.62 | +4.78 | $83,772 | |||
| Liberal | Gord Zeilstra | 11,977 | 23.39 | -10.21 | $8,316 | |||
| New Democratic | Max Lombardi | 10,044 | 19.61 | +2.67 | $12,035 | |||
| Green | Scott Cosman | 4,279 | 8.35 | +3.13 | $1,614 | |||
| Total valid votes/Expense limit | 51,195 | 100.00 | $93,018 | |||||
| Total rejected ballots | 217 | 0.42 | +0.06 | |||||
| Turnout | 51,412 | 55.92 | -9.05 | |||||
| Canadian federal election, 2006 | ||||||||
|---|---|---|---|---|---|---|---|---|
| Party | Candidate | Votes | % | ∆% | ||||
| Conservative | Gary Goodyear | 25,337 | 43.84 | +5.9 | ||||
| Liberal | Janko Peric | 19,419 | 33.60 | −3.1 | ||||
| New Democratic | Donna Reid | 9,794 | 16.94 | −3.3 | ||||
| Green | Gareth White | 3,017 | 5.22 | +0.2 | ||||
| Canadian Action | David Pelly | 217 | 0.37 | |||||
| Total valid votes | 57,784 | 100.00 | ||||||
| Total rejected ballots | 207 | 0.36 | ||||||
| Turnout | 57,991 | 64.97 | ||||||
| Canadian federal election, 2004 | ||||||||
|---|---|---|---|---|---|---|---|---|
| Party | Candidate | Votes | % | ∆% | ||||
| Conservative | Gary Goodyear | 19,123 | 37.9 | -6.1 | ||||
| Liberal | Janko Peric | 18,899 | 36.7 | -9.9 | ||||
| New Democratic | Gary Price | 10,392 | 20.2 | +11.6 | ||||
| Green | Gareth White | 2,506 | 5.0 | |||||
| Christian Heritage | John Gots | 395 | 0.8 | +0.5 | ||||
| Independent | John Oprea | 134 | 0.3 | |||||
| Independent | Alec Gryc | 114 | 0.2 | |||||
| Total valid votes | 51,563 | 100.0 | ||||||
Note: Conservative vote is compared to the total of the Canadian Alliance vote and Progressive Conservative vote in 2000 election. John Gots' vote as a CHP candidate is compared to his vote in 2000 as an unaffiliated candidate.
| Canadian federal election, 2000 | ||||||||
|---|---|---|---|---|---|---|---|---|
| Party | Candidate | Votes | % | ∆% | ||||
| Liberal | Janko Peric | 22,148 | 46.6 | +9.9 | ||||
| Alliance | Reg Petersen | 14,915 | 31.4 | +9.0 | ||||
| Progressive Conservative | John Housser | 5,988 | 12.6 | -6.7 | ||||
| New Democratic | Pam Wolf | 4,111 | 8.6 | -11.8 | ||||
| Natural Law | Thomas Mitchell | 210 | 0.4 | |||||
| Independent | John Gots | 160 | 0.3 | |||||
| Total valid votes | 47,532 | 100.0 | ||||||
Note: Canadian Alliance vote is compared to the Reform vote in 1997 election.
| Canadian federal election, 1997 | ||||||||
|---|---|---|---|---|---|---|---|---|
| Party | Candidate | Votes | % | ∆% | ||||
| Liberal | Janko Peric | 17,673 | 36.7 | -2.4 | ||||
| Reform | Bill Donaldson | 10,767 | 22.4 | -11.3 | ||||
| New Democratic | Mike Farnan | 9,813 | 20.4 | +15.1 | ||||
| Progressive Conservative | Larry Olney | 9,299 | 19.3 | +2.0 | ||||
| Independent | John Long | 311 | 0.6 | |||||
| Independent | Jim Remnant | 237 | 0.5 | |||||
| Total valid votes | 48,100 | 100.0 | ||||||
| Canadian federal election, 1993 | ||||||||
|---|---|---|---|---|---|---|---|---|
| Party | Candidate | Votes | % | ∆% | ||||
| Liberal | Janko Peric | 21,997 | 39.1 | +12.3 | ||||
| Reform | Reg Petersen | 18,932 | 33.7 | |||||
| Progressive Conservative | Pat Sobeski | 9,776 | 17.4 | -23.0 | ||||
| New Democratic | Bill McBain | 2,962 | 5.3 | -22.8 | ||||
| National | Ron Cooper | 1,804 | 3.2 | |||||
| Christian Heritage | Michael Picard | 407 | 0.7 | -3.8 | ||||
| Natural Law | Thomas Mitchell | 370 | 0.7 | |||||
| Total valid votes | 56,248 | 100.0 | ||||||
| Canadian federal election, 1988 | ||||||||
|---|---|---|---|---|---|---|---|---|
| Party | Candidate | Votes | % | ∆% | ||||
| Progressive Conservative | Pat Sobeski | 20,578 | 40.4 | -20.2 | ||||
| New Democratic | Bruce Davidson | 14,298 | 28.1 | +3.9 | ||||
| Liberal | Ron Cooper | 13,639 | 26.8 | +12.1 | ||||
| Christian Heritage | Rien Vanden Enden | 2,305 | 4.5 | |||||
| Independent | Shafiq Hudda | 141 | 0.3 | |||||
| Total valid votes | 50,961 | 100.0 | ||||||
| Canadian federal election, 1984 | ||||||||
|---|---|---|---|---|---|---|---|---|
| Party | Candidate | Votes | % | ∆% | ||||
| Progressive Conservative | Chris Speyer | 22,963 | 60.6 | +21.2 | ||||
| New Democratic | Bill McBain | 9,171 | 24.2 | -7.0 | ||||
| Liberal | Lyn Johnston | 5,545 | 14.6 | -14.3 | ||||
| Rhinoceros | John Jagiellowicz | 103 | 0.3 | |||||
| Commonwealth of Canada | Peter Harz | 112 | 0.3 | |||||
| Total valid votes | 37,894 | 100.0 | ||||||
| Canadian federal election, 1980 | ||||||||
|---|---|---|---|---|---|---|---|---|
| Party | Candidate | Votes | % | ∆% | ||||
| Progressive Conservative | Chris Speyer | 14,314 | 39.4 | -4.2 | ||||
| New Democratic | Mike Farnan | 11,346 | 31.2 | +1.7 | ||||
| Liberal | David Charlton | 10,531 | 29.0 | +2.6 | ||||
| Social Credit | Regent Gervais | 103 | 0.3 | -0.1 | ||||
| Marxist–Leninist | Anna Di Carlo | 82 | 0.2 | 0.0 | ||||
| Total valid votes | 36,376 | 100.0 | ||||||
| Canadian federal election, 1979 | ||||||||
|---|---|---|---|---|---|---|---|---|
| Party | Candidate | Votes | % | |||||
| Progressive Conservative | Chris Speyer | 16,337 | 43.5 | |||||
| New Democratic | Marc Sommerville | 11,085 | 29.5 | |||||
| Liberal | Lee Palvetzian | 9,903 | 26.4 | |||||
| Social Credit | Regent Gervais | 150 | 0.4 | |||||
| Marxist–Leninist | Anna Di Carlo | 78 | 0.2 | |||||
| Total valid votes | 37,553 | 100.0 | ||||||
See also
References
- "(Code 35011) Census Profile". 2011 census. Statistics Canada. 2012. Retrieved 2012-03-02.
- History of Federal Ridings since 1867 (Cambridge)
- 2011 Results from Elections Canada
- 2001 Federal Electoral District Profile (Cambridge)
- Campaign expense data from Elections Canada