Glengarry—Prescott—Russell
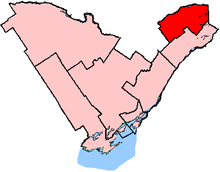 Glengarry—Prescott—Russell in relation to other Ontario electoral districts (2003 boundaries) | |||
| Federal electoral district | |||
| Legislature | House of Commons | ||
| MP |
| ||
| District created | 1952 | ||
| First contested | 1953 | ||
| Last contested | 2015 | ||
| District webpage | profile, map | ||
| Demographics | |||
| Population (2011)[1] | 106,240 | ||
| Electors (2015) | 84,340 | ||
| Area (km²)[2] | 3,018 | ||
| Pop. density (per km²) | 35.2 | ||
| Census divisions | Ottawa, Prescott and Russell, Stormont, Dundas and Glengarry | ||
| Census subdivisions | Alfred and Plantagenet, Casselman, Champlain, Clarence-Rockland, East Hawkesbury, Hawkesbury, North Glengarry, Ottawa, Russell Township, The Nation Municipality | ||
Glengarry—Prescott—Russell (formerly known as Glengarry—Prescott) is a federal electoral district in Ontario, Canada, that has been represented in the House of Commons of Canada since 1953.
Geography
The district includes the United Counties of Prescott and Russell, the Township of North Glengarry and the former City of Cumberland (except for Orleans).
Major communities include Hawkesbury, Ottawa (part), Russell, Embrun, Casselman, East Hawkesbury, Alfred and Plantagenet, Champlain, Clarence-Rockland, North Glengarry and The Nation. Its area is 3,049 km2.
History
The district was created in 1952 as "Glengarry—Prescott" from parts of Glengarry and Prescott ridings. It consisted of Prescott County and Glengarry County.
In 1966, it was expanded to include Russell County excluding Cumberland Township. In 1970, the name was changed to "Glengarry—Prescott—Russell".
In 1976, the district was redefined to exclude Charlottenburgh Township and include Cumberland Township.
In 1987, it was redefined to consist of the United Counties of Prescott and Russell, the County of Glengarry and Akwesasne Indian Reserve No. 59 in the United Counties of Stormont, Dundas and Glengarry, and the part of the Township of Cumberland excluding the part north of Innes Road and west of Regional Road No. 57 and Trim Road.
In 1996, it was redefined to consist of the United Counties of Prescott and Russell, the County of Glengarry (excluding the Township of Charlottenburgh), the Township of Cumberland in the Regional Municipality of Ottawa-Carleton, excluding the part west of Trim Road and North of Innes Road.
In 2003, it was redefined to consist of the United Counties of Prescott and Russell, the Township of North Glengarry in the United Counties of Stormont, Dundas and Glengarry, and the part of the City of Ottawa east Cardinal Creek, Regional Road No. 174, Trim Road Wall Road, Mer Bleue Road and Boundary Road.
Following the 2012 redistribution of Canada's ridings, the riding will lose the Cardinal Creek and Carlsbad Springs area to Orléans.
Members of Parliament
This riding has elected the following Members of Parliament:
| Parliament | Years | Member | Party | |
|---|---|---|---|---|
| Glengarry—Prescott Riding created from Glengarry and Prescott |
||||
| 22nd | 1953–1957 | Raymond Bruneau | Liberal | |
| 23rd | 1957–1958 | Osie Villeneuve | Progressive Conservative | |
| 24th | 1958–1962 | |||
| 25th | 1962–1963 | Viateur Éthier | Liberal | |
| 26th | 1963–1965 | |||
| 27th | 1965–1968 | |||
| 28th | 1968–1972 | |||
| Glengarry—Prescott—Russell | ||||
| 29th | 1972–1974 | Denis Éthier | Liberal | |
| 30th | 1974–1979 | |||
| 31st | 1979–1980 | |||
| 32nd | 1980–1984 | |||
| 33rd | 1984–1988 | Don Boudria | ||
| 34th | 1988–1993 | |||
| 35th | 1993–1997 | |||
| 36th | 1997–2000 | |||
| 37th | 2000–2004 | |||
| 38th | 2004–2006 | |||
| 39th | 2006–2008 | Pierre Lemieux | Conservative | |
| 40th | 2008–2011 | |||
| 41st | 2011–2015 | |||
| 42nd | 2015–Present | Francis Drouin | Liberal | |
Election results
Glengarry—Prescott—Russell
| Canadian federal election, 2015 | ||||||||
|---|---|---|---|---|---|---|---|---|
| Party | Candidate | Votes | % | ∆% | Expenditures | |||
| Liberal | Francis Drouin | 34,189 | 53.28 | +22.68 | – | |||
| Conservative | Pierre Lemieux | 23,367 | 36.41 | -12.40 | – | |||
| New Democratic | Normand Laurin | 5,087 | 7.93 | -8.74 | – | |||
| Green | Genevieve Malouin-Diraddo | 1,153 | 1.80 | -1.78 | – | |||
| Libertarian | Jean-Serge Brisson | 377 | 0.59 | +0.25 | – | |||
| Total valid votes/Expense limit | 64,173 | 100.00 | $222,406.73 | |||||
| Total rejected ballots | 399 | 0.62 | – | |||||
| Turnout | 64,572 | 75.62 | – | |||||
| Eligible voters | 85,388 | |||||||
| Liberal gain from Conservative | Swing | +17.54 | ||||||
| Source: Elections Canada[3][4] | ||||||||
| 2011 federal election redistributed results[5] | |||
|---|---|---|---|
| Party | Vote | % | |
| Conservative | 26,802 | 48.82 | |
| Liberal | 16,801 | 30.60 | |
| New Democratic | 9,149 | 16.66 | |
| Green | 1,966 | 3.58 | |
| Libertarian | 187 | 0.34 | |
| Canadian federal election, 2011 | ||||||||
|---|---|---|---|---|---|---|---|---|
| Party | Candidate | Votes | % | ∆% | Expenditures | |||
| Conservative | Pierre Lemieux | 28,174 | 48.80 | +1.50 | – | |||
| Liberal | Julie Bourgeois | 17,705 | 30.67 | -6.19 | – | |||
| New Democratic | Denis Séguin | 9,608 | 16.64 | +6.18 | – | |||
| Green | Sylvie Lemieux | 2,049 | 3.55 | -1.81 | – | |||
| Libertarian | Jean-Serge Brisson | 194 | 0.34 | – | – | |||
| Total valid votes/Expense limit | 57,730 | 100.00 | – | |||||
| Total rejected ballots | 304 | 0.52 | – | |||||
| Turnout | 58,034 | 68.80 | – | |||||
| Eligible voters | 84,347 | – | – | |||||
| Canadian federal election, 2008 | ||||||||
|---|---|---|---|---|---|---|---|---|
| Party | Candidate | Votes | % | ∆% | Expenditures | |||
| Conservative | Pierre Lemieux | 25,659 | 47.30 | +5.75 | $80,105 | |||
| Liberal | Dan Boudria | 19,997 | 36.86 | -4.33 | $71,845 | |||
| New Democratic | Jean-Sébastien Caron | 5,674 | 10.46 | -2.28 | $2,043 | |||
| Green | Sylvie Lemieux | 2,908 | 5.36 | +0.86 | $5,306 | |||
| Total valid votes/Expense limit | 54,238 | 100.00 | $85,679 | |||||
| Canadian federal election, 2006 | ||||||||
|---|---|---|---|---|---|---|---|---|
| Party | Candidate | Votes | % | ∆% | ||||
| Conservative | Pierre Lemieux | 22,990 | 41.55 | +4.1 | ||||
| Liberal | René Berthiaume | 22,787 | 41.19 | -6.7 | ||||
| New Democratic | Jo-Ann Fennessey | 7,049 | 12.74 | +4.3 | ||||
| Green | Bonnie Jean-Louis | 2,494 | 4.50 | -0.8 | ||||
| Total valid votes | 55,320 | 100.0 | ||||||
| Canadian federal election, 2004 | ||||||||
|---|---|---|---|---|---|---|---|---|
| Party | Candidate | Votes | % | ∆% | ||||
| Liberal | Don Boudria | 23,921 | 47.9 | -20.1 | ||||
| Conservative | Alain Lalonde | 18,729 | 37.5 | +10.2 | ||||
| New Democratic | Martin Cauvier | 4,238 | 8.5 | +4.4 | ||||
| Green | Roy Fjarlie | 2,634 | 5.3 | |||||
| Christian Heritage | Tim Bloedow | 464 | 0.9 | |||||
| Total valid votes | 49,986 | 100.0 | ||||||
Note: Conservative vote is compared to the total of the Canadian Alliance vote and Progressive Conservative vote in 2000 election.
| Canadian federal election, 2000 | ||||||||
|---|---|---|---|---|---|---|---|---|
| Party | Candidate | Votes | % | ∆% | ||||
| Liberal | Don Boudria | 31,371 | 68.0 | -4.0 | ||||
| Alliance | L. Sebastian Anders | 8,632 | 18.7 | +9.2 | ||||
| Progressive Conservative | Ashley O'Kurley | 3,942 | 8.5 | -4.0 | ||||
| New Democratic | Guy Belle-Isle | 1,877 | 4.1 | -0.6 | ||||
| Natural Law | Wayne Foster | 334 | 0.7 | +0.3 | ||||
| Total valid votes | 46,156 | 100.0 | ||||||
Note: Canadian Alliance vote is compared to the Reform vote in 1997 election.
| Canadian federal election, 1997 | ||||||||
|---|---|---|---|---|---|---|---|---|
| Party | Candidate | Votes | % | ∆% | Expenditures | |||
| Liberal | Don Boudria | 34,986 | 71.98 | −8.23 | $ 46,386 | |||
| Progressive Conservative | France Somers | 6,109 | 12.57 | +4.38 | 10,057 | |||
| Reform | Mike Lancop | 4,599 | 9.46 | +1.48 | 2,386 | |||
| New Democratic | Fred Cappuccino | 2,289 | 4.71 | +2.37 | 11,524 | |||
| Green | Richard Kerr | 417 | 0.86 | 499 | ||||
| Natural Law | Mary Glasser | 207 | 0.43 | −0.42 | 0 | |||
| Total valid votes/Expense limit | 48,607 | 100.0 | −12.93 | $ 62,182 | ||||
| Total rejected ballots | 598 | 1.22 | ||||||
| Turnout | 49,205 | 68.68 | ||||||
| Electors on the lists | 71,639 | |||||||
| Sources: Elections Canada Official Voting Results and Financial Returns | ||||||||
| Canadian federal election, 1993 | ||||||||
|---|---|---|---|---|---|---|---|---|
| Party | Candidate | Votes | % | ∆% | ||||
| Liberal | Don Boudria | 44,775 | 80.2 | +9.5 | ||||
| Progressive Conservative | France Somers | 4,572 | 8.2 | -10.9 | ||||
| Reform | Sam McCracken | 4,456 | 8.0 | |||||
| New Democratic | Pascal Villeneuve | 1,304 | 2.3 | -6.8 | ||||
| Natural Law | Pierrette Blondin | 473 | 0.8 | |||||
| Libertarian | Jean-Serge Brisson | 244 | 0.4 | -0.2 | ||||
| Total valid votes | 55,824 | 100.0 | ||||||
| Canadian federal election, 1988 | ||||||||
|---|---|---|---|---|---|---|---|---|
| Party | Candidate | Votes | % | ∆% | ||||
| Liberal | Don Boudria | 35,280 | 70.7 | +17.6 | ||||
| Progressive Conservative | Roger R. Presseault | 9,517 | 19.1 | -13.9 | ||||
| New Democratic | Helena McCuaig | 4,537 | 9.1 | -4.8 | ||||
| Libertarian | Jean-Serge Brisson | 335 | 0.7 | |||||
| Commonwealth of Canada | John Feres | 199 | 0.4 | |||||
| Total valid votes | 49,868 | 100.0 | ||||||
| Canadian federal election, 1984 | ||||||||
|---|---|---|---|---|---|---|---|---|
| Party | Candidate | Votes | % | ∆% | ||||
| Liberal | Don Boudria | 26,057 | 53.1 | -15.4 | ||||
| Progressive Conservative | John Stante | 16,170 | 33.0 | +13.3 | ||||
| New Democratic | Annemarie Collard | 6,838 | 13.9 | +13.7 | ||||
| Total valid votes | 49,065 | 100.0 | ||||||
| Canadian federal election, 1980 | ||||||||
|---|---|---|---|---|---|---|---|---|
| Party | Candidate | Votes | % | ∆% | ||||
| Liberal | Denis Éthier | 28,189 | 68.5 | +3.1 | ||||
| Progressive Conservative | Gordon Johnson | 8,113 | 19.7 | -4.7 | ||||
| New Democratic | Claude Dion | 4,781 | 11.6 | +1.6 | ||||
| Marxist–Leninist | Gary O'Brien | 90 | 0.2 | 0.0 | ||||
| Total valid votes | 41,173 | 100.0 | ||||||
| Canadian federal election, 1979 | ||||||||
|---|---|---|---|---|---|---|---|---|
| Party | Candidate | Votes | % | ∆% | ||||
| Liberal | Denis Éthier | 27,106 | 65.3 | +4.9 | ||||
| Progressive Conservative | Gordon Johnson | 10,112 | 24.4 | +2.8 | ||||
| New Democratic | Paul De Broeck | 4,164 | 10.0 | -7.9 | ||||
| Marxist–Leninist | Gary O'Brien | 107 | 0.3 | |||||
| Total valid votes | 41,489 | 100.0 | ||||||
| Canadian federal election, 1974 | ||||||||
|---|---|---|---|---|---|---|---|---|
| Party | Candidate | Votes | % | ∆% | ||||
| Liberal | Denis Éthier | 18,478 | 60.5 | +8.4 | ||||
| Progressive Conservative | Bernard Pelot | 6,595 | 21.6 | -2.8 | ||||
| New Democratic | Raymond Desrochers | 5,484 | 17.9 | +9.2 | ||||
| Total valid votes | 30,557 | 100.0 | ||||||
| Canadian federal election, 1972 | ||||||||
|---|---|---|---|---|---|---|---|---|
| Party | Candidate | Votes | % | ∆% | ||||
| Liberal | Denis Éthier | 14,780 | 52.1 | -9.9 | ||||
| Progressive Conservative | J.-L. Montreuil | 6,924 | 24.4 | -6.9 | ||||
| New Democratic | Jacques Boyer | 2,495 | 8.8 | +2.1 | ||||
| Independent | Bernard Pelot | 2,479 | 8.7 | |||||
| Social Credit | W.-R. Marin | 1,710 | 6.0 | |||||
| Total valid votes | 28,388 | 100.0 | ||||||
Glengarry—Prescott
| Canadian federal election, 1968 | ||||||||
|---|---|---|---|---|---|---|---|---|
| Party | Candidate | Votes | % | ∆% | ||||
| Liberal | Viateur Éthier | 14,970 | 62.0 | +8.3 | ||||
| Progressive Conservative | J.-Lomer Carriere | 7,564 | 31.3 | -2.6 | ||||
| New Democratic | Claude Demers | 1,606 | 6.7 | |||||
| Total valid votes | 24,140 | 100.0 | ||||||
| Canadian federal election, 1965 | ||||||||
|---|---|---|---|---|---|---|---|---|
| Party | Candidate | Votes | % | ∆% | ||||
| Liberal | Viateur Éthier | 10,339 | 53.7 | +3.9 | ||||
| Progressive Conservative | Albert-R. Cadieux | 6,529 | 33.9 | +5.9 | ||||
| Ralliement créditiste | Raymond Berthiaume | 1,204 | 6.3 | -7.8 | ||||
| New Democratic | Wilfrid Latreille | 1,173 | 6.1 | +4.1 | ||||
| Total valid votes | 19,245 | 100.0 | ||||||
Note: Ralliement créditiste vote is compared to Social Credit vote in 1963 election.
| Canadian federal election, 1963 | ||||||||
|---|---|---|---|---|---|---|---|---|
| Party | Candidate | Votes | % | ∆% | ||||
| Liberal | Viateur Éthier | 9,906 | 49.8 | -4.5 | ||||
| Progressive Conservative | J.-Marcel Gelineau | 5,568 | 28.0 | -12.3 | ||||
| Social Credit | Rolland Cholette | 2,786 | 14.0 | +10.9 | ||||
| Independent Liberal | Raymond Bruneau | 1,234 | 6.2 | |||||
| New Democratic | Peter Marcel Schneider | 394 | 2.0 | |||||
| Total valid votes | 19,888 | 100.0 | ||||||
| Canadian federal election, 1962 | ||||||||
|---|---|---|---|---|---|---|---|---|
| Party | Candidate | Votes | % | ∆% | ||||
| Liberal | Viateur Éthier | 11,043 | 54.3 | +5.6 | ||||
| Progressive Conservative | Osie Villeneuve | 8,186 | 40.3 | -11.0 | ||||
| Social Credit | Rolland Cholette | 639 | 3.1 | |||||
| New Democratic | René Benoit | 461 | 2.3 | |||||
| Total valid votes | 20,329 | 100.0 | ||||||
Note: NDP vote is compared to CCF vote in 1958 election.
| Canadian federal election, 1958 | ||||||||
|---|---|---|---|---|---|---|---|---|
| Party | Candidate | Votes | % | ∆% | ||||
| Progressive Conservative | Osie Villeneuve | 10,385 | 51.3 | +11.1 | ||||
| Liberal | Raymond Bruneau | 9,865 | 48.7 | +16.2 | ||||
| Total valid votes | 20,250 | 100.0 | ||||||
| Canadian federal election, 1957 | ||||||||
|---|---|---|---|---|---|---|---|---|
| Party | Candidate | Votes | % | ∆% | ||||
| Progressive Conservative | Osie Villeneuve | 8,241 | 40.2 | +9.6 | ||||
| Liberal | Raymond Bruneau | 6,661 | 32.5 | -8.0 | ||||
| Independent Liberal | René Bertrand | 5,414 | 26.4 | |||||
| Social Credit | Patrice Brunet | 198 | 1.0 | |||||
| Total valid votes | 20,514 | 100.0 | ||||||
| Canadian federal election, 1953 | ||||||||
|---|---|---|---|---|---|---|---|---|
| Party | Candidate | Votes | % | |||||
| Liberal | Raymond Bruneau | 7,800 | 40.4 | |||||
| Progressive Conservative | Fernand Guindon | 5,893 | 30.5 | |||||
| Independent Liberal | William Joseph Major | 5,321 | 27.6 | |||||
| Co-operative Commonwealth | François Bosse | 280 | 1.5 | |||||
| Total valid votes | 19,294 | 100.0 | ||||||
References
- "(Code 35025) Census Profile". 2011 census. Statistics Canada. 2012. Retrieved 2011-03-03.
- Riding history for Glengarry—Prescott 1952-1970 from the Library of Parliament
- Riding history for Glengarry—Prescott—Russell 1970-2008 from the Library of Parliament
- 2011 Results from Elections Canada
Notes
Coordinates: 45°25′N 75°07′W / 45.41°N 75.12°W