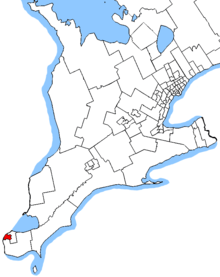
Windsor West (French: Windsor-Ouest) is a federal electoral district in Ontario, Canada, that has been represented in the Canadian House of Commons since 1968.
The district consists of the part of the city of Windsor lying west and south of a line drawn from the U.S. border southeast along Langlois Avenue, east along Tecumseh Road East, and southeast along Pillette Road to the southern city limit.
Demographics
Average family income: $66,432 (2001)
Median household income: $44,939
Unemployment: 9.2%
Language, mother tongue: English 66%, French 3%, Other 31%
Religion: Catholic 46%, Protestant 24%, Muslim 6%, Orthodox Christian 4%, Other Christian 4%, Buddhist 1%, No religious affiliation 13%, Other 2%
Visible minority: Black 4%, Arab 4%, Chinese 4%, South Asian 3%, Southeast Asian 2%, Latin American 1%, Filipino 1%, Others 1%
History
Windsor West riding was created in 1966 from parts of Essex East and Essex West ridings.
It consisted initially of the part of the City of Windsor and the Township of Sandwich West bounded on the west by the U.S. border, and on the north, east and west by a line drawn from the border east along County Road 28, north along Malden Road, east along Malden Road South, south along Huron Church Line Road, east along Cabana Road, north along Howard Avenue, west along the C.P.R. line, northwest along McDougall Avenue, east along Tecumseh Boulevard East, north along Elsmere Avenue, west along Elliott Street East, and north along Marentette Avenue to the border.
In 1976, it was redefined to consist of the part of the City of Windsor bounded on the west by the U.S. border, and on the north, east and west by a line drawn from the border south along Langlois Avenue, west along Tecumseh Boulevard East, south along McDougall Street, east along the Canadian Pacific Railway, south along Howard Avenue, and west along Cabana Road to the southwest city limit.
In 1987, it was redefined to consist of the part of the City of Windsor lying south and west of a line drawn from the U.S. border south along Langlois Avenue, west along Tecumseh Road East, south along McDougall Street, east along to the Canadian Pacific Railway line, and south along the Chesapeake and Ohio Railway line to the southern city limit.
In 1996, it was redefined to consist of the part of the City of Windsor lying south and west of a line drawn from the U.S.
border south along Langlois Avenue, west along Tecumseh Road East, and south along Pillette Road to the southern city limit. In 2004, The boundaries were not changed for this riding.
This riding was left unchanged after the 2012 electoral redistribution.
Members of Parliament
This riding has elected the following Members of Parliament:
Election results
| Canadian federal election, 2008 |
| Party |
Candidate |
Votes | % | ∆% | Expenditures |
|
New Democratic | Brian Masse | 20,834 | 52.54 | +3.05 | $74,929 |
|
Conservative | Lisa Lumley | 8,953 | 22.58 | +2.47 | $60,613 |
|
Liberal | Larry Horwitz | 7,369 | 18.59 | -6.80 | $53,753 |
|
Green | John Esposito | 2,253 | 5.68 | +2.65 | $132 |
|
Communist | Elizabeth Rowley | 125 | 0.32 | – | $373 |
|
Marxist–Leninist | Margaret Villamizar | 116 | 0.29 | +0.06 | |
| Total valid votes/Expense limit |
39,650 | 100.00 | $88,186 |
| Total rejected ballots |
281 | 0.70 | 0.01 |
| Turnout |
39,877 | 47.33 | -9.96 |
| |
New Democratic Party hold |
Swing |
+0.29 |
|
| Canadian federal election, 2006 |
| Party |
Candidate |
Votes | % | ∆% | Expenditures |
|
New Democratic | Brian Masse | 23,608 | 49.49 | +3.52 | $76,342 |
|
Liberal | Werner Keller | 12,110 | 25.39 | −5.93 | $55,858 |
|
Conservative | Al Teshuba | 9,592 | 20.11 | +1.20 | $77,898 |
|
Green | Jillana Bishop | 1,444 | 3.03 | −0.47 | $2,450 |
|
Progressive Canadian | Chris Schnurr | 614 | 1.29 | – | $731 |
| |
Independent |
Habib Zaidi |
224 |
0.47 |
|
$3,631 |
|
Marxist–Leninist | Enver Villamizar | 108 | 0.23 | −0.07 |
|
| Total valid votes |
47,700 | 99.31 |
| Total rejected ballots |
329 | 0.69 | +0.08 |
| Turnout |
48,029 | 57.29 | +3.20 |
| Electors on the lists |
83,839 |
| Sources: Official Results, Elections Canada and Financial Returns, Elections Canada. |
| Canadian federal election, 2004 |
| Party |
Candidate |
Votes | % | ∆% | Expenditures |
|
New Democratic | Brian Masse | 20,297 | 45.97 | +30.01 | $77,487 |
|
Liberal | Richard Pollock | 13,831 | 31.32 | −22.80 | $74,197 |
|
Conservative | Jordan Katz | 8,348 | 18.91 | −9.63 | $69,771 |
|
Green | Rob Spring | 1,545 | 3.50 | | $4,721 |
|
Marxist–Leninist | Enver Villamizar | 134 | 0.30 | |
$300 |
| Total valid votes |
44,155 | 99.39 |
| Total rejected ballots |
273 | 0.61 | 0.00 |
| Turnout |
44,428 | 54.09 | +11.08 |
| Electors on the lists |
82,143 |
| Percentage change figures are factored for redistribution. Conservative Party percentages are contrasted with the combined Canadian Alliance and Progressive Conservative percentages from 2000. |
| Sources: Official Results, Elections Canada and Financial Returns, Elections Canada. |
Note: Conservative vote is compared to the total of the Canadian Alliance vote and Progressive Conservative vote in 2000 election.
| Canadian federal by-election, May 13, 2002 |
| Party |
Candidate |
Votes | % | ∆% | Expenditures |
|
New Democratic | Brian Masse | 14,021 | 42.69 | +26.79 | $65,195 |
|
Liberal | Richard Pollock | 11,544 | 35.15 | −19.06 | $64,964 |
|
Alliance | Rick Fuschi | 5,420 | 16.50 | −6.45 | $60,657 |
| |
Progressive Conservative |
Ian West |
957 |
2.91 |
−2.62 |
$11,212 |
|
Green | Chris Holt | 655 | 1.99 | – | $9,246 |
|
Christian Heritage | Allan James | 249 | 0.76 | – | $2,072 |
| Total valid votes |
32,846 | 99.39 |
| Total rejected ballots |
200 | 0.61 |
| Turnout |
33,046 | 43.01 |
| Electors on the lists |
76,825 |
| |
New Democratic Party gain from Liberal |
Note: Canadian Alliance vote is compared to the Reform vote in 1997 election.
See also
References
Notes
|
|---|
|
| Until 2015 | |
|---|
|
| Until 2006 | |
|---|
|
| Until 2004 | |
|---|
|
| Until 2000 | |
|---|
|
| Until 1997 | |
|---|
|
| Until 1993 | |
|---|
|
| Until 1988 | |
|---|
|
| Until 1984 | |
|---|
|
| Until 1979 | |
|---|
|
| Until 1974 | |
|---|
|
| Until 1972 | |
|---|
|
| Until 1968 | |
|---|
|
| Until 1953 | |
|---|
|
| Until 1949 | |
|---|
|
| Until 1935 | |
|---|
|
| Until 1925 | |
|---|
|
| Until 1917 | |
|---|
|
| Until 1904 | |
|---|
|
| Until 1896 | |
|---|
|
| Until 1882 | |
|---|
Coordinates: 42°17′N 83°03′W / 42.29°N 83.05°W / 42.29; -83.05
.png)