Timmins—James Bay
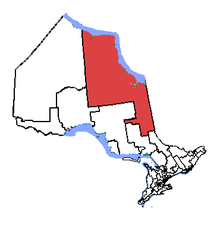 Timmins—James Bay in relation to other northern Ontario electoral districts | |||
| Federal electoral district | |||
| Legislature | House of Commons | ||
| MP |
| ||
| District created | 1996 | ||
| First contested | 1997 | ||
| Last contested | 2015 | ||
| District webpage | profile, map | ||
| Demographics | |||
| Population (2011)[1] | 83,104 | ||
| Electors (2015) | 60,202 | ||
| Area (km²)[2] | 251,599 | ||
| Pop. density (per km²) | 0.33 | ||
| Census divisions | Cochrane District, Timiskaming District | ||
| Census subdivisions | Timmins, Kirkland Lake, Cochrane, Iroquois Falls, Black River-Matheson, Moosonee, Marten Falls, Attawapiskat, Fort Albany, Moose Factory | ||
Timmins—James Bay (French: Timmins—Baie James) is a federal electoral district in Ontario, Canada, that has been represented in the Canadian House of Commons since 1997. Its population in 2001 was 84,001.
The district includes the extreme eastern part of the District of Kenora, all of the District of Cochrane except for the central western part, and a small part south of Timmins, and all of the District of Timiskaming except for the extreme southeastern part.
Geography
Timmins—James Bay consists of
- the part of the Territorial District of Kenora lying east of a line drawn from the northeast corner of the most northerly point of the Territorial District of Thunder Bay (Albany River) due north to Hudson Bay;
- the Territorial District of Cochrane, excluding the part bounded by a line drawn from the western limit of the territorial district east along the northern limits of the townships of Boyce, Boyce, Shuel, Mulloy, Fintry, Auden, Rogers, Fushimi, Bannerman, Ritchie, Mulvey, Goldwin, Sweet, Hillmer, McKnight, Boyle, Mowbray, Howells, Sheldon, Pinard and Mewhinney, south along the eastern boundaries of the townships of Mewhinney, Bourassa, Tolmie, Menapia, Beniah, Colquhoun and Calder, west along the northern boundary of the Township of Ottaway, south along the western boundaries of the townships of Ottaway, Beck, Lucas and Prosser, and west along the southern boundaries of the townships of Carnegie, Reid, Thorburn, Moberly, Aitken, Poulett, Watson and Lisgar, to the southwestern limit of the territorial district;
- the part of the Territorial District of Timiskaming bounded by a line drawn from the northeast corner of the Township of Harris, west along the northern boundaries of the townships of Harris, Dymond, Hudson, Lundy, Auld and Speight, and south along the western boundaries of the townships of Speight, Van Nostrand and Leo to the southern limit of the territorial district.
History
Timmins—James Bay was created in 1996 from parts of Cochrane—Superior and Timiskaming—Cochrane ridings.
It consisted initially of:
- the part of the Territorial District of Cochrane lying west and north of a line drawn from the southeast corner of the City of Timmins north and west along the east and north limits of the city north along the east boundaries of the Townships of Prosser, Lucas, Beck and Ottaway, west and north along the south and west boundary of the Township of Clute, north along the east boundary of the Township of Colquhoun, and east along the south boundaries of the Townships of Marven, Thorning, Potter, Sangster, Bragg, Newman, Tomlinson, Hurtubise and St. Laurent,
- the part of the Territorial District of Kenora lying east of a line drawn north from the most northerly northeast corner of the Territorial District of Thunder Bay to Hudson Bay.
In 2003, it was given its current boundaries as described above.
This riding gained a fraction of territory from Nipissing—Timiskaming during the 2012 electoral redistribution.
Members of Parliament
This riding has elected the following Members of Parliament:
| Parliament | Years | Member | Party | |
|---|---|---|---|---|
| Timmins—James Bay Riding created from Cochrane—Superior and Timiskaming—Cochrane |
||||
| 36th | 1997–2000 | Réginald Bélair | Liberal | |
| 37th | 2000–2004 | |||
| 38th | 2004–2006 | Charlie Angus | New Democratic | |
| 39th | 2006–2008 | |||
| 40th | 2008–2011 | |||
| 41st | 2011–2015 | |||
| 42nd | 2015–Present | |||
Election results
| Canadian federal election, 2015 | ||||||||
|---|---|---|---|---|---|---|---|---|
| Party | Candidate | Votes | % | ∆% | Expenditures | |||
| New Democratic | Charlie Angus | 15,974 | 42.85 | -7.1 | – | |||
| Liberal | Todd Lever | 12,940 | 34.72 | +18.74 | – | |||
| Conservative | John P. Curley | 7,605 | 20.4 | -11.48 | – | |||
| Green | Max Kennedy | 752 | 2.02 | -0.18 | – | |||
| Total valid votes/Expense limit | 37,271 | 100.0 | $244,399.85 | |||||
| Total rejected ballots | 266 | – | – | |||||
| Turnout | 37,537 | 61.84 | +10.84 | |||||
| Eligible voters | 60,692 | |||||||
| New Democratic hold | Swing | -12.89 | ||||||
| Source: Elections Canada[3][4] | ||||||||
| 2011 federal election redistributed results[5] | |||
|---|---|---|---|
| Party | Vote | % | |
| New Democratic | 16,833 | 49.95 | |
| Conservative | 10,743 | 31.88 | |
| Liberal | 5,387 | 15.98 | |
| Green | 740 | 2.20 | |
| Canadian federal election, 2011 | ||||||||
|---|---|---|---|---|---|---|---|---|
| Party | Candidate | Votes | % | ∆% | Expenditures | |||
| New Democratic | Charlie Angus | 16,738 | 50.4 | -6.1 | – | |||
| Conservative | Bill Greenberg | 10,526 | 31.7 | +13.5 | – | |||
| Liberal | Marilyn Wood | 5,230 | 15.7 | -6.5 | – | |||
| Green | Lisa Bennett | 724 | 2.2 | -0.9 | – | |||
| Total valid votes/Expense limit | 33,218 | 100.0 | ||||||
| Total rejected ballots | 184 | 0.6 | +0.1 | |||||
| Turnout | 33,402 | 56.5 | +5.5 | |||||
| Eligible voters | 59,136 | – | – | |||||
| Canadian federal election, 2008 | ||||||||
|---|---|---|---|---|---|---|---|---|
| Party | Candidate | Votes | % | ∆% | Expenditures | |||
| New Democratic | Charlie Angus | 17,188 | 56.5 | +6.0 | $63,948 | |||
| Liberal | Paul Taillefer | 6,740 | 22.2 | -12.1 | $ 31,909 | |||
| Conservative | Bill Greenberg | 5,536 | 18.2 | +4.6 | $29,651 | |||
| Green | Larry Verner | 938 | 3.1 | +1.5 | $133 | |||
| Total valid votes/Expense limit | 30,402 | 100.0 | $97,746 | |||||
| Total rejected ballots | 133 | 0.4 | ||||||
| Turnout | 30,535 | 51.0 | ||||||
| Canadian federal election, 2006 | ||||||||
|---|---|---|---|---|---|---|---|---|
| Party | Candidate | Votes | % | ∆% | ||||
| New Democratic | Charlie Angus | 19,150 | 50.5 | +9.1 | ||||
| Liberal | Robert Riopelle | 13,028 | 34.3 | -5.3 | ||||
| Conservative | Ken Graham | 5,164 | 13.6 | -3.1 | ||||
| Green | Sahaja Freed | 610 | 1.6 | -0.7 | ||||
| valid votes | 37,952 | 100.0 | ||||||
| New Democratic hold | Swing | +7.2 | ||||||
| Canadian federal election, 2004 | ||||||||
|---|---|---|---|---|---|---|---|---|
| Party | Candidate | Votes | % | ∆% | ||||
| New Democratic | Charlie Angus | 14,138 | 41.4 | +19.7 | ||||
| Liberal | Ray Chénier | 13,525 | 39.6 | -14.9 | ||||
| Conservative | Andrew Van Oosten | 5,682 | 16.7 | -6.2 | ||||
| Green | Marsha Gail Kriss | 767 | 2.3 | |||||
| Total valid votes | 34,112 | 100.0 | ||||||
Note: Change from 2000 is based on redistributed results. Conservative Party change is based on the combination of Canadian Alliance and Progressive Conservative Party totals.
| Canadian federal election, 2000 | ||||||||
|---|---|---|---|---|---|---|---|---|
| Party | Candidate | Votes | % | ∆% | ||||
| Liberal | Réginald Bélair | 16,335 | 54.2 | +4.0 | ||||
| New Democratic | Len Wood | 9,385 | 31.1 | -4.5 | ||||
| Alliance | James Gibb | 3,356 | 11.1 | +3.8 | ||||
| Progressive Conservative | Daniel Clark | 1,053 | 3.5 | -3.2 | ||||
| Total valid votes | 30,129 | 100.0 | ||||||
Note: Canadian Alliance vote is compared to the Reform vote in 1997 election.
| Canadian federal election, 1997 | ||||||||
|---|---|---|---|---|---|---|---|---|
| Party | Candidate | Votes | % | |||||
| Liberal | Réginald Bélair | 16,829 | 50.3 | |||||
| New Democratic | Cid Samson | 11,945 | 35.7 | |||||
| Reform | Donna Ferolie | 2,464 | 7.4 | |||||
| Progressive Conservative | Jodi MacDonald | 2,251 | 6.7 | |||||
| Total valid votes | 33,489 | 100.0 | ||||||
See also
References
- "(Code 35092) Census Profile". 2011 census. Statistics Canada. 2012. Retrieved 2011-03-03.
Notes
External links
- Riding history from the Library of Parliament
- 2011 results from Elections Canada
- Campaign expense data from Elections Canada
.png)