Whitby—Oshawa
 | |
| Defunct federal electoral district | |
| Legislature | House of Commons |
| District created | 2003 |
| District abolished | 2015 |
| First contested | 2004 |
| Last contested | 2011 |
| District webpage | profile, map |
| Demographics | |
| Population (2011) | 146,307 |
| Electors (2011) | 99,155 |
| Area (km²) | 222.30 |
| Census divisions | Durham |
| Census subdivisions | Whitby, Oshawa |
Whitby—Oshawa was a federal electoral district in Ontario, Canada, that has been represented in the House of Commons of Canada since 2004. Following the 2012 federal electoral boundaries redistribution, the bulk of the district will become part of the new Whitby district, while parts of it will be transferred to Oshawa and Durham.
History
The riding was created in 2003 and consists of 68 percent of the Whitby—Ajax district, 20 percent of the Oshawa district and three percent of the Durham district.[1] The provincial electoral district was created from the same ridings in 2007.
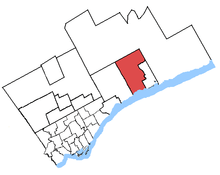
It consists of the Town of Whitby and northwestern section of the City of Oshawa (specifically, the portion of the city lying north and west of a line drawn from the western city limit east along King Street West, north along the Oshawa Creek, east along Rossland Road West, north along Simcoe Street North, and east along Winchester Road East to the eastern city limit).
Demographics
According to the Canada 2011 Census
- Population: 146,307
- Ethnic Groups: 81.4% White, 5.5% Black, 4.3% South Asian, 1.7% Chinese, 1.7% Filipino, 1.4% Aboriginal
- Languages: 85.3% English, 2.1% French, 1.5% Italian, 1.1% Chinese
- Religion: 71.2% Christian (32.6% Catholic, 10.3% United Church, 8.3% Anglican, 2.6% Presbyterian, 2.4% Christian Orthodox, 2.1% Baptist, 10.4% Other Christian), 2.6% Muslim, 1.4% Hindu, 23.6% No religion.
- Average household income: $104,969
- Median household income: $89,608
- Average individual income: $48,444
- Median individual income: $37,099
Members of Parliament
This riding has elected the following Members of Parliament:
| Parliament | Years | Member | Party | |
|---|---|---|---|---|
| Whitby—Oshawa Riding created from Durham, Oshawa and Whitby—Ajax |
||||
| 38th | 2004–2006 | Judi Longfield | Liberal | |
| 39th | 2006–2008 | Jim Flaherty | Conservative | |
| 40th | 2008–2011 | |||
| 41st | 2011–2014 | |||
| 2014–2015 | Pat Perkins | |||
| Riding dissolved into Whitby, Durham and Oshawa | ||||
Pat Perkins was elected in a November 17, 2014 by-election following the death of Jim Flaherty who died in office on April 10, 2014.[2]
Election results
| Canadian federal by-election, November 17, 2014 Death of Jim Flaherty | ||||||||
|---|---|---|---|---|---|---|---|---|
| Party | Candidate | Votes | % | ∆% | Expenditures | |||
| Conservative | Pat Perkins | 17,082 | 49.31 | −9.11 | – | |||
| Liberal | Celina Caesar-Chavannes | 14,083 | 40.65 | +26.54 | – | |||
| New Democratic | Trish McAuliffe | 2,801 | 8.08 | −14.19 | – | |||
| Green | Craig Cameron | 500 | 1.44 | −3.45 | – | |||
| Independent | John "The Engineer" Turmel | 101 | 0.29 | – | ||||
| Independent | Josh Borenstein | 77 | 0.22 | – | ||||
| Total valid votes/Expense limit | 100.0 | |||||||
| Total rejected ballots | ||||||||
| Turnout | 34,644 | 31.79 | −31.45 | |||||
| Eligible voters | 108,969 | +6.87 | ||||||
| Conservative hold | Swing | −17.89 | ||||||
| Source: "By-election Results". Elections Canada. November 20, 2014. | ||||||||
| Canadian federal election, 2011 | ||||||||
|---|---|---|---|---|---|---|---|---|
| Party | Candidate | Votes | % | ∆% | Expenditures | |||
| Conservative | Jim Flaherty | 37,525 | 58.42 | +7.43 | $ 89,309.88 | |||
| New Democratic | Trish McAuliffe | 14,305 | 22.27 | +8.01 | 22,721.23 | |||
| Liberal | Trevor Bardens | 9,066 | 14.11 | -11.57 | 45,888.64 | |||
| Green | Rebecca Harrison | 3,143 | 4.89 | -3.53 | 13,040.87 | |||
| Libertarian | Josh Insang | 198 | 0.31 | +0.31 | 0.00 | |||
| Total valid votes/Expense limit | 64,237 | 100.00 | +6.69 | $102,342.39 | ||||
| Total rejected ballots | 244 | 0.38 | +0.07 | |||||
| Turnout | 64,481 | 63.24 | +1.78 | |||||
| Eligible voters | 101,961 | +3.76 | ||||||
Source(s) "Official Voting Results — Forty-first General Election 2011". Retrieved November 18, 2014. "Candidates' Details - Campaign Financial Summary (Part 4)". Elections Canada. May 2, 2011. | ||||||||
| Canadian federal election, 2008 | ||||||||
|---|---|---|---|---|---|---|---|---|
| Party | Candidate | Votes | % | ∆% | Expenditures | |||
| Conservative | Jim Flaherty | 30,704 | 50.99 | +7.13 | $ 91,047.86 | |||
| Liberal | Brent Fullard | 15,460 | 25.68 | -13.07 | 77,624.55 | |||
| New Democratic | David Purdy | 8,584 | 14.26 | +1.21 | 4,335.08 | |||
| Green | Doug Anderson | 5,067 | 8.42 | +4.82 | 8,056.85 | |||
| Christian Heritage | Yvonne Forbes | 395 | 0.66 | 1,744.08 | ||||
| Total valid votes/Expense limit | 60,210 | 100.0 | -9.85 | $ 97,412.66 | ||||
| Total rejected ballots | 190 | 0.31 | -0.04 | |||||
| Turnout | 60,400 | 61.46 | -9.14 | |||||
| Electors on the lists | 98,270 | +3.51 | ||||||
Source(s) "Official Voting Results — Fortieth General Election 2008". Retrieved November 18, 2014. "Candidates' Details - Campaign Financial Summary (Part 4)". Elections Canada. October 14, 2008. | ||||||||
| Canadian federal election, 2006 | ||||||||
|---|---|---|---|---|---|---|---|---|
| Party | Candidate | Votes | % | ∆% | Expenditures | |||
| Conservative | Jim Flaherty | 29,294 | 43.86 | +7.80 | $ 88,591.06 | |||
| Liberal | Judi Longfield | 25,882 | 38.75 | −6.29 | 78,783.33 | |||
| New Democratic | Maret Sadem-Thompson | 8,716 | 13.05 | −1.00 | 9,898.30 | |||
| Green | Ajay Krishnan | 2,407 | 3.60 | −1.25 | 238.56 | |||
| Libertarian | Marty Gobin | 274 | 0.41 | 258.75 | ||||
| Canadian Action | Tom Cochrane | 217 | 0.32 | 120.18 | ||||
| Total valid votes/Expense limit | 66,790 | 100.0 | +17.30 | $ 88,730.91 | ||||
| Total rejected ballots | 237 | 0.35 | −0.14 | |||||
| Turnout | 67,027 | 70.60 | +6.52 | |||||
| Electors on the lists | 94,938 | +6.32 | ||||||
| Sources: Official Results, Elections Canada and Financial Returns, Elections Canada | ||||||||
| Canadian federal election, 2004 | ||||||||
|---|---|---|---|---|---|---|---|---|
| Party | Candidate | Votes | % | Expenditures | ||||
| Liberal | Judi Longfield | 25,649 | 45.04 | $80,842 | ||||
| Conservative | Ian MacNeil | 20,531 | 36.06 | $30,004 | ||||
| New Democratic | Maret Sadem-Thompson | 8,002 | 14.05 | $13,477 | ||||
| Green | Michael MacDonald | 2,759 | 4.85 | $0 | ||||
| Total valid votes | 56,941 | 100.00 | ||||||
| Total rejected ballots | 283 | 0.49 | ||||||
| Turnout | 57,224 | 64.08 | ||||||
| Electors on the lists | 89,296 | |||||||
| Percentage change figures are factored for redistribution. Conservative Party percentages are contrasted with the combined Canadian Alliance and Progressive Conservative percentages from 2000. | ||||||||
| Sources: Official Results, Elections Canada and Financial Returns, Elections Canada. | ||||||||
See also
References
- "(Code 35099) Census Profile". 2011 census. Statistics Canada. 2012. Retrieved 2011-03-03.
Notes
- ↑ "Canada Votes 2006: Whitby-Oshawa". CBC. 2006. Archived from the original on 2007-06-13. Retrieved 2007-08-01.
- ↑ Erika Tucker (April 10, 2014). "Jim Flaherty passes away at 64". Global News. Retrieved April 10, 2014.
Sources
- Riding history from the Library of Parliament
- Whitby—Oshawa 2001 Census Information
- Campaign expense data from Elections Canada
Coordinates: 43°55′N 78°55′W / 43.92°N 78.92°W