List of Canadian federal general elections
This article provides a summary of results for the general (all seats contested) elections to the House of Commons, the elected lower half of Canada's federal bicameral legislative body, the Parliament of Canada. The number of seats has increased steadily over time, from 180 for the first election to the current total of 338. The current federal government structure was established in 1867 by the Constitution Act.
For federal by-elections (for one or a few seats as a result of retirement, etc.) see List of federal by-elections in Canada. For the eight general elections of the Province of Canada held in 1843 to 1864 before confederation in 1867, see List of elections in the Province of Canada. There were also earlier elections in Canada, such as for the Legislative Assembly of Upper Canada (held in 1792–1836, now part of Ontario) and the Legislative Assembly of Lower Canada (held in 1792–1834, now part of Quebec).
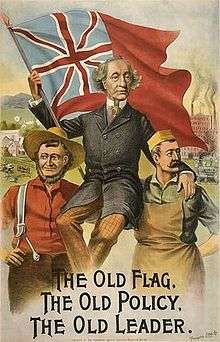
Two political parties have dominated politics in Canada: the Liberal Party and the historic Conservative party (known as the Progressive Conservative Party from 1943 to 2003). If one regards the modern Conservative Party as the successor to the historic one, then these are the only two parties to have formed a government, although often as the lead party in a minority or coalition government with one or more smaller parties (the 1917 win was by a pro-conscription Unionist coalition of former Liberals and Conservatives).
Although government has primarily been a two-party system, Canadian federal politics has been a multi-party affair since the 1920s, during which there was significant parliamentary presence of the Progressive Party and the United Farmers movement. They were supplanted by the Social Credit Party and the Co-operative Commonwealth Federation (CCF) in the 1930s. The CCF evolved into the New Democratic Party (NDP) in 1961. The Social Credit Party and the CCF/NDP won the third and fourth most seats between them from the 1930s, until the Social Credit Party failed to win any seats in the 1980 election.
Since 1980, the NDP has remained a presence in the Canadian parliament, but the situation amongst other non-government parties has been more complex. The Progressive Conservative Party never recovered from its spectacular defeat in the 1993 election (when it went from being the majority government with 169 seats, to just two seats and the loss of official party status). Right-wing politics has since seen the rise and fall of the Reform Party and the Canadian Alliance, followed by the rise to government of the new Conservative Party. Further, in 1993 the separatist Bloc Québécois won seats for the first time. It has been a constant presence in parliament since then.
Summary of results
The third, fourth, and fifth parties' results are included in "Other" if the party did not win at least four seats in an election at some point in its history. Results for parties placing sixth or lower (as in the 1926 election) are also included in "Other", as are Independent seats.
| Election Year |
Summary | Government | Official opposition |
Third party |
Fourth party |
Fifth party |
Other | Total seats | ||||||
|---|---|---|---|---|---|---|---|---|---|---|---|---|---|---|
| 1st | 1867 | Liberal-Conservative Party (commonly known as the Conservative Party), led by Sir John A. Macdonald, is elected to form Canada's first majority government, defeating the Liberal Party and its de facto leader George Brown. In Nova Scotia, Anti-Confederates under Joseph Howe win 18 of 19 seats after campaigning against confederation, but later sit with the Liberals. | 100[2] | 62 | 18 | - | - | 0 | 180 | |||||
| 2nd | 1872 | Conservatives under Prime Minister Macdonald are re-elected with a minority, defeating Liberals and their de facto leader Edward Blake. | 100[3] | 95 | - | - | - | 5 | 200 | |||||
| 3rd | 1874 | Liberals, led by Prime Minister Alexander Mackenzie, retain power with a majority after having formed a government after Conservatives under former Prime Minister Sir John A. Macdonald lost the confidence of the House in 1873. The Conservatives drop the word "Liberal" from "Liberal-Conservative Party" in 1873, but Macdonald and some other members continue to run under the original party name. First federal election by Secret ballot. | 129 | 65[2] | - | - | - | 12 | 206 | |||||
| 4th | 1878 | Conservative Party, led by Sir John A. Macdonald, defeat Prime Minister Alexander Mackenzie's Liberals, returning Macdonald to power with a second majority. | 134[2] | 63 | - | - | - | 9 | 206 | |||||
| 5th | 1882 | Conservatives, led by Prime Minister Macdonald, are re-elected with a third majority, defeating Blake's Liberals. | 134[4] | 73 | - | - | - | 4 | 211 | |||||
| 6th | 1887 | Conservatives, led by Prime Minister Macdonald, are re-elected with a fourth majority, defeating Blake's Liberals. | 124[4] | 80 | - | - | - | 11 | 215 | |||||
| 7th | 1891 | Conservatives, led by Prime Minister Macdonald, are re-elected with a fifth majority, in Macdonald's final election before his death shortly after. Macdonald defeated rookie Liberal opposition leader Wilfrid Laurier. | 118[4] | 90 | - | - | - | 7 | 215 | |||||
| 8th | 1896 | Liberals, led by Laurier, are elected with a majority, defeating Conservatives of Prime Minister Sir Charles Tupper. | 117 | 86[2] | - | - | - | 10 | 213 | |||||
| 9th | 1900 | Liberals, led by Prime Minister Sir Wilfrid Laurier, are re-elected with a second majority, defeating former Prime Minister Tupper's Conservatives. | 128 | 79[2] | - | - | - | 6 | 213 | |||||
| 10th | 1904 | Liberals, led by Prime Minister Laurier, are re-elected with a third majority, defeating Robert Borden's Conservatives. | 137 | 75[2] | - | - | - | 2 | 214 | |||||
| 11th | 1908 | Liberals, led by Prime Minister Laurier, are re-elected with a fourth majority, defeating Borden and his Conservatives. | 133 | 85[2] | - | - | - | 3 | 221 | |||||
| 12th | 1911 | Conservatives, led by Borden, defeat Prime Minister Laurier's Liberals with a majority. | 132[2] | 85 | - | - | - | 4 | 221 | |||||
| 13th | 1917 | Unionist Party, a pro-conscription coalition of Conservatives and former Liberals, are elected with a majority under Prime Minister Sir Robert Borden. Both former Conservatives and former Liberals are appointed to the cabinet. The coalition defeats former Prime Minister Laurier's anti-conscription Liberals in the most bitter campaign in Canadian history. | 153 | 82 | - | - | - | 0 | 235 | |||||
| 14th | 1921 | Liberals, led by William Lyon Mackenzie King, win a minority government, defeating Conservatives under Prime Minister Arthur Meighen. The Conservatives are reduced to third place in the House, but the Progressive Party under Thomas Crerar declines the title of official opposition so Meighen becomes opposition leader. | 118 | 49 | 58 | 3[5] | - | 7 | 235 | |||||
| 15th | 1925 | Prime Minister Mackenzie King's Liberals hold on to power with a minority with the help of Progressives under Robert Forke, despite former Prime Minister Meighen's Conservatives winning more seats. Labour Party leader and future CCF leader J.S. Woodsworth bargains his votes in the House to the Liberals in exchange for a promise to enact an old age pension plan. The Progressives soon withdraw support from the scandal-plagued Liberals but also refuse to support the Conservatives. The Governor General controversially gives Meighen the Prime Minister's post in the King-Byng Affair, but the Conservatives soon fall in a non-confidence vote. | 100 | 115 | 22 | 2[6] | - | 6 | 245 | |||||
| 16th | 1926 | Liberals, led by Mackenzie King, defeat former Prime Minister Meighen's Conservatives, winning a minority supported by the eight Liberal-Progressives under Forke. United Farmers parties take 12 seats and Labour four, giving Canada a rare Parliament with six parties in the House each with four or more seats. | 116 | 91 | 11 | 12[5] | 8 | 7 | 245 | |||||
| 17th | 1930 | Conservatives, led by R.B. Bennett, win a majority, defeating Liberals under former Prime Minister Mackenzie King. | 134 | 90 | 9[6] | 3 | 2 | 7 | 245 | |||||
| 18th | 1935 | Liberals, led by Mackenzie King, defeat Prime Minister Bennett's Conservatives with a majority. The new Co-operative Commonwealth Federation (CCF) from the West, under Woodsworth, wins seven seats on a platform of social reform. The new Social Credit Party under John Blackmore, also from the West, wins 17 seats with its platform of monetary reform. Progressive Party and United Farmers of Alberta pass into the history books. | 173 | 39 | 17 | 7 | 4 | 5 | 245 | |||||
| 19th | 1940 | Liberals, led by Prime Minister Mackenzie King, are re-elected with a majority, defeating Robert Manion's National Government party, a failed attempt to recreate Robert Borden's World War I-era Unionists. | 179 | 39[7] | 10[8] | 8 | 3 | 6 | 245 | |||||
| 20th | 1945 | Liberals, led by Prime Minister Mackenzie King, are re-elected with a minority, defeating the newly renamed Progressive Conservatives, led by John Bracken. Foreshadowing the Bloc Québécois, Bloc populaire Canadien wins two seats in Quebec on an anti-conscription and Quebec nationalism platform; future Prime Minister Pierre Trudeau and future mayor of Montreal Jean Drapeau are young party members. | 118 | 66 | 28 | 13 | - | 20 | 245 | |||||
| 21st | 1949 | Liberals, led by Liberal Prime Minister Louis St-Laurent, are re-elected with a majority, defeating Progressive Conservatives led by George Drew. | 191[9] | 41 | 13 | 10 | 1 | 6 | 262 | |||||
| 22nd | 1953 | Prime Minister St-Laurent's Liberals are re-elected with a majority, defeating Drew's Progressive Conservatives. | 169[9] | 51 | 23 | 15 | 1 | 6 | 265 | |||||
| 23rd | 1957 | Progressive Conservatives, led by John Diefenbaker, defeat Liberals led by Prime Minister St-Laurent with an upset minority victory. | 111 | 104[9] | 25 | 19 | - | 6 | 265 | |||||
| 24th | 1958 | Progressive Conservatives, led by Prime Minister Diefenbaker, are re-elected with the largest majority to date in Canadian history, defeating Liberals and their new leader Lester Pearson. | 208 | 48[9] | 8 | - | - | 1 | 265 | |||||
| 25th | 1962 | Progressive Conservatives, led by Prime Minister Diefenbaker, are re-elected, but with a minority. Under "father of Canadian medicare" Tommy Douglas, the New Democratic Party, evolved from the CCF, wins 19 seats but fails to achieve a hoped for breakthrough. Social Credit makes unprecedented gains in Quebec, but only a modest recovery in the West. | 116 | 99[9] | 30 | 19 | - | 1 | 265 | |||||
| 26th | 1963 | Liberals, led by Lester Pearson, defeat Prime Minister Diefenbaker's Progressive Conservatives, winning a minority. | 128[9] | 95 | 24 | 17 | - | 1 | 265 | |||||
| 27th | 1965 | Liberals, led by Prime Minister Pearson, are re-elected with a second minority, defeating former Prime Minister Diefenbaker's Progressive Conservatives. | 131 | 97 | 21 | 14[10] | - | 2 | 265 | |||||
| 28th | 1968 | Liberals, led by new Prime Minister Pierre Trudeau, are re-elected with a majority, defeating Progressive Conservatives led by Robert Stanfield. | 154[9] | 72 | 22 | 14[11] | - | 2 | 264 | |||||
| 29th | 1972 | Liberals, led by Prime Minister Trudeau, are re-elected, but with a minority, defeating Stanfield's Progressive Conservatives by only two seats. The NDP pick up several seats under new leader David Lewis. | 109 | 107 | 31 | 15 | - | 2 | 264 | |||||
| 30th | 1974 | Liberals, led by Prime Minister Trudeau, defeat Stanfields's Progressive Conservatives with a majority. | 141 | 95 | 16 | 11 | - | 1 | 264 | |||||
| 31st | 1979 | Progressive Conservatives, led by Joe Clark, defeat Liberals, led by Prime Minister Trudeau, and win a minority, despite winning a significantly smaller share of the vote than the Liberals. The PCs win the most votes in seven provinces, but the Liberals capture an enormous lead in Quebec. Ed Broadbent makes his debut as leader of the NDP, which wins 10 more seats than in 1974 in a Parliament enlarged by 18 seats. | 136 | 114 | 26 | 6 | - | 0 | 282 | |||||
| 32nd | 1980 | Liberals, led by former Prime Minister Trudeau, defeat Progressive Conservatives, led by Prime Minister Clark. Social Credit fades into history after an almost unbroken 45-year run, leaving Canada with a three party system. | 147 | 103 | 32 | - | - | 0 | 282 | |||||
| 33rd | 1984 | Progressive Conservatives, led by Brian Mulroney, defeat Liberals, led by new Prime Minister John Turner and win the most seats in Canadian history. The election is both the best showing ever for the Progressive Conservatives and the second worst showing ever for the Liberals (by total seats). | 211 | 40 | 30 | - | - | 1 | 282 | |||||
| 34th | 1988 | Progressive Conservative Prime Minister Mulroney is re-elected with a second majority, contending with a much stronger performance from former Liberal Prime Minister Turner and a strong third-party showing from Broadbent's New Democrats, who score that party's third best result ever. | 169 | 83 | 43 | - | - | 0 | 295 | |||||
| 35th | 1993 | Liberals, led by Jean Chrétien, win a majority and soundly defeat Progressive Conservatives, led by new Prime Minister Kim Campbell, who are left in fifth place with just two seats, their worst ever showing. The separatist Bloc Québécois under ex-Mulroney cabinet minister Lucien Bouchard becomes the official opposition, and the right-wing Reform Party, led by Preston Manning, becomes the third party. Audrey McLaughlin's New Democrats also post their worst ever results with just nine seats. The election marks the end of the predominantly three party system of the Liberals, Progressive Conservatives, and NDP. | 177 | 54 | 52 | 9 | 2 | 1 | 295 | |||||
| 36th | 1997 | Liberals, led by Prime Minister Chrétien, are re-elected with a second majority. Manning's Reform Party becomes the official opposition. Bloc Québécois falls to third place under new leader Gilles Duceppe. NDP under Alexa McDonough win 21 seats, 12 more than in 1993. Progressive Conservatives under Jean Charest win nearly as many votes as Reform, but only one-third the seats. | 155 | 60 | 44 | 21 | 20 | 1 | 301 | |||||
| 37th | 2000 | Liberals, led by Prime Minister Chrétien, are re-elected with a third majority, defeating Stockwell Day's Canadian Alliance, the unsuccessful attempt to unite the Reform Party and the Progressive Conservatives. Progressive Conservatives, led by former Prime Minister Joe Clark, barely keep official party status in the House with the minimum 12 seats. | 172 | 66 | 38 | 13 | 12 | 0 | 301 | |||||
| 38th | 2004 | Liberals are re-elected under new Prime Minister Paul Martin to a minority government. They defeat the new Conservative Party, led by Stephen Harper, ex-leader of the Canadian Alliance, who merged that party with the Progressive Conservatives. Bloc Québécois experiences a revival due to the Liberal sponsorship scandal. Jack Layton's NDP comes one seat short of being able to guarantee the survival of Martin's government. | 135 | 99 | 54 | 19 | - | 1 | 308 | |||||
| 39th | 2006 | Conservatives, led by Stephen Harper, win a minority, defeating Prime Minister Martin's Liberals. BQ keeps most of its seats and NDP improves its fourth-place position. | 124 | 103 | 51 | 29 | - | 1 | 308 | |||||
| 40th | 2008 | Conservatives, led by Prime Minister Harper, win a second minority, defeating Stéphane Dion's Liberals by larger margins than in 2006. BQ support is steady and NDP picks up several Liberal seats. Green Party under new leader Elizabeth May continues its growth, winning 6.78% of the national vote on its environmentally conscious platform, but again fails to win any seats. | 143 | 77 | 49 | 37 | - | 2 | 308 | |||||
| 41st | 2011 | Conservatives under Prime Minister Harper win an absolute majority. For the first time since Confederation, NDP, led by Layton, becomes the Official Opposition, taking profit of the collapse of BQ in Quebec and Liberals in Ontario. Liberals had always formed either the government or the official opposition. The leaders of both defeated parties Michael Ignatieff and Gilles Duceppe lost their seats and resigned. The Green Party campaign focused on winning its first ever seat, letting overall support collapse to 2000 levels. | 166 | 103 | 34 | 4 | - | 1 | 308 | |||||
| 42nd | 2015 | Liberals under Justin Trudeau win a majority of seats. Conservatives become the official opposition. Stephen Harper resigns. Quebec drops their overwhelming support for the NDP following the 2011 election, and instead is largely divided, with the Liberals seizing most of the available seats. This split in Quebec reduces the NDP under Thomas Mulcair back to their standing as a third party, while the Bloc Quebecois under Gilles Duceppe regains some of the ridings lost in 2011, despite Duceppe again failing to win his riding. Green Party leader Elizabeth May retains her seat. | 184 | 99 | 44 | 10 | - | 1 | 338 | |||||
Notes
- ↑ In the 1921 election, the Conservatives ran under the name National Liberal and Conservative Party, and in 1940 under the name National Government. In both cases the Conservatives lost the election and the new name was soon abandoned.
- 1 2 3 4 5 6 7 8 Includes results for the Liberal-Conservative Party.
- ↑ Includes results for the Liberal-Conservative Party and one Conservative Labour candidate.
- 1 2 3 Includes results for the Liberal-Conservative and Nationalist Conservative parties.
- 1 2 Combined total for the United Farmers of Alberta and United Farmers of Ontario.
- 1 2 Seats won by the United Farmers of Alberta.
- ↑ Includes results for the National Government party.
- 1 2 3 4 5 6 7 Includes one seat won by a Liberal-Labour candidate in Kenora—Rainy River who sat in the House as a Liberal.
- ↑ Includes 10 seats won by the Ralliement créditiste party.
- ↑ All 14 seats were won by the Ralliement créditiste party.
Further reading
- Argyle, Ray. Turning Points: The Campaigns That Changed Canada - 2011 and Before (2011) 440pp excerpt and text search, covers 1878, 1896, 1911, 1917, 1926, 1945, 1957, 1968, 1988, 1995 and 2011
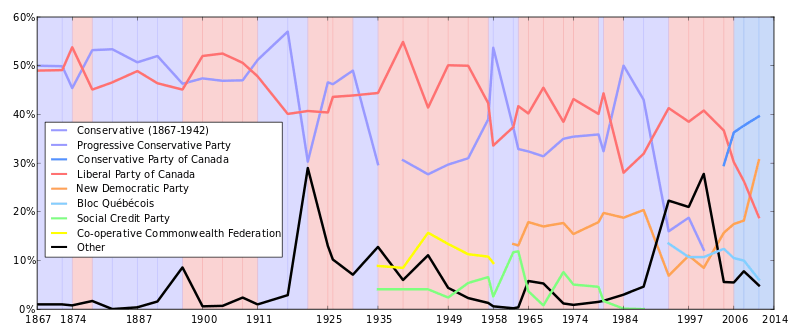
Graphs of results
Bar graph of results from 1867 to 2011

Line graph of results
See also
- Canadian federal election, 2015
- Elections in Canada
- List of political parties in Canada
- List of elections in the Province of Canada (pre-Confederation)
- List of federal by-elections in Canada
- Voter turnout in Canada
References
- "History of Federal Ridings since 1867". Parliament of Canada. Retrieved 2007-01-07.
| Most recent | |
|---|---|
| Future elections |
|
| Lists | |
| Electoral districts | |
| Elections | |
|---|---|
| By-elections (by parliament) |
|
| Referendums | |