Deer Lodge County, Montana
| Deer Lodge County, Montana | |
|---|---|
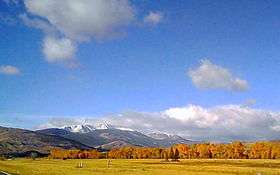 Pintlar Mountain Range, near Anaconda | |
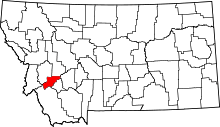 Location in the U.S. state of Montana | |
 Montana's location in the U.S. | |
| Founded | 1865 |
| Seat | Anaconda |
| Largest city | Anaconda |
| Area | |
| • Total | 741 sq mi (1,919 km2) |
| • Land | 737 sq mi (1,909 km2) |
| • Water | 4.7 sq mi (12 km2), 0.6% |
| Population (est.) | |
| • (2015) | 9,139 |
| • Density | 13/sq mi (5/km²) |
| Congressional district | At-large |
| Time zone | Mountain: UTC-7/-6 |
| Website |
www |
Deer Lodge County is a county located in the U.S. state of Montana. As of the 2010 census, the population was 9,298.[1] It forms a consolidated city-county government with its county seat of Anaconda.[2] The county was founded in 1865.[3]
History
Deer Lodge was one of the original 9 Montana counties, as constituted with the establishment of Montana Territory in 1864.[4] The original county included what are now Silver Bow County (separated in 1881[5]), Deer Lodge County, Granite County (separated in 1893) and Powell County (separated in 1901[6]).
Geography
According to the U.S. Census Bureau, the county has a total area of 741 square miles (1,920 km2), of which 737 square miles (1,910 km2) is land and 4.7 square miles (12 km2) (0.6%) is water.[7] It is the second-smallest county in Montana by area.
The county has a wealth of natural amenities, such as the Anaconda Mountain Range, Georgetown Lake, and the Mount Haggin wildlife management area (Montana’s largest at 54,000 acres).[8]
Major highways
Adjacent counties
- Granite County, Montana - northwest
- Powell County, Montana - north
- Jefferson County, Montana - east
- Silver Bow County, Montana - southeast
- Beaverhead County, Montana - south
- Ravalli County, Montana - west
National protected areas
- Beaverhead National Forest (part)
- Deerlodge National Forest (part)
Demographics
| Historical population | |||
|---|---|---|---|
| Census | Pop. | %± | |
| 1870 | 4,367 | — | |
| 1880 | 8,876 | 103.3% | |
| 1890 | 15,155 | 70.7% | |
| 1900 | 17,393 | 14.8% | |
| 1910 | 12,988 | −25.3% | |
| 1920 | 15,323 | 18.0% | |
| 1930 | 16,293 | 6.3% | |
| 1940 | 13,627 | −16.4% | |
| 1950 | 16,553 | 21.5% | |
| 1960 | 18,640 | 12.6% | |
| 1970 | 15,652 | −16.0% | |
| 1980 | 12,518 | −20.0% | |
| 1990 | 10,278 | −17.9% | |
| 2000 | 9,417 | −8.4% | |
| 2010 | 9,298 | −1.3% | |
| Est. 2015 | 9,139 | [9] | −1.7% |
| U.S. Decennial Census[10] 1790-1960[11] 1900-1990[12] 1990-2000[13] 2010-2015[1] | |||
2000 census
As of the census[14] of 2000, there were 9,417 people, 3,995 households, and 2,524 families residing in the county. The population density was 13 people per square mile (5/km²). There were 4,958 housing units at an average density of 7 per square mile (3/km²). The racial makeup of the county was 95.87% White, 0.17% Black or African American, 1.77% Native American, 0.36% Asian, 0.01% Pacific Islander, 0.18% from other races, and 1.64% from two or more races. 1.65% of the population were Hispanic or Latino of any race. 21.3% were of Irish, 21.2% German, 7.1% English, 6.5% American and 6.4% Norwegian ancestry. 96.3% spoke English, 1.4% Spanish and 1.2% German as their first language.
There were 3,995 households out of which 25.80% had children under the age of 18 living with them, 50.00% were married couples living together, 9.40% had a female householder with no husband present, and 36.80% were non-families. 33.40% of all households were made up of individuals and 16.70% had someone living alone who was 65 years of age or older. The average household size was 2.26 and the average family size was 2.84.
In the county the population was spread out with 22.50% under the age of 18, 7.90% from 18 to 24, 24.00% from 25 to 44, 26.80% from 45 to 64, and 18.80% who were 65 years of age or older. The median age was 42 years. For every 100 females there were 99.80 males. For every 100 females age 18 and over, there were 97.30 males.
The median income for a household in the county was $26,305, and the median income for a family was $36,158. Males had a median income of $27,230 versus $18,719 for females. The per capita income for the county was $15,580. About 11.60% of families and 15.80% of the population were below the poverty line, including 21.40% of those under age 18 and 9.80% of those age 65 or over.
2010 census
As of the 2010 United States Census, there were 9,298 people, 4,018 households, and 2,350 families residing in the county.[15] The population density was 12.6 inhabitants per square mile (4.9/km2). There were 5,122 housing units at an average density of 7.0 per square mile (2.7/km2).[16] The racial makeup of the county was 93.1% white, 3.1% American Indian, 0.4% black or African American, 0.3% Asian, 0.5% from other races, and 2.5% from two or more races. Those of Hispanic or Latino origin made up 2.9% of the population.[15] In terms of ancestry, 30.2% were German, 26.2% were Irish, 9.2% were English, 8.5% were Norwegian, 5.9% were Italian, 5.2% were Swedish, and 2.6% were American.[17]
Of the 4,018 households, 22.3% had children under the age of 18 living with them, 44.8% were married couples living together, 9.2% had a female householder with no husband present, 41.5% were non-families, and 36.1% of all households were made up of individuals. The average household size was 2.11 and the average family size was 2.73. The median age was 46.0 years.[15]
The median income for a household in the county was $35,310 and the median income for a family was $51,076. Males had a median income of $32,477 versus $26,250 for females. The per capita income for the county was $21,921. About 9.6% of families and 21.2% of the population were below the poverty line, including 30.6% of those under age 18 and 6.9% of those age 65 or over.[18]
Government and politics
Deer Lodge County is the most consistently Democratic county in Montana when it comes to Presidential elections. It has not supported a Republican candidate since Calvin Coolidge in 1924.[19] In the last five elections the Democratic candidate has won by 21% to nearly 49% of Deer Lodge County's vote.[20] In gubernatorial elections the only Republican to carry the county in the last twenty years was Marc Racicot in the 1996 election. In that election the original Democratic nominee, Chet Blaylock, died and Marc Racicot carried every county.[21]
It is currently in the 43rd district of the Montana Senate and as such has been represented by Democrat Jesse Laslovich since 2004. In the Montana House of Representatives it is in the 85th district and as such has been represented by Democrat Cynthia Hiner since 2004.[22]
Communities
- Anaconda
- Galen
- Georgetown
- Opportunity
- Warm Springs
Note that the town of Deer Lodge is in neighboring Powell County.
Notable residents
- Lucille Ball - actress
- John H. Collins - classical scholar.
- Frank Cope - New York Giants offensive lineman
- Marcus Daly - founder of Anaconda, and one of the "Copper Kings" of Butte.
- Wayne Estes - college basketball star
- Raymond Hunthausen - Archbishop of Seattle
- Rob Johnson - San Diego Padres catcher
- Nancy Keenan - politician, NARAL president
- George A. Lingo - politician in the Alaska Territory
- George Leo Thomas - Roman Catholic Bishop of Helena
- Lester Thurow - economist
- John H. Tolan, later a United States Congressman from California, was an attorney of the county from 1904 through 1906.
See also
- Atlantic Cable Quartz Lode
- List of cemeteries in Deer Lodge County, Montana
- List of lakes in Deer Lodge County, Montana
- List of mountains in Deer Lodge County, Montana
- National Register of Historic Places listings in Deer Lodge County, Montana
References
- 1 2 "State & County QuickFacts". United States Census Bureau. Retrieved September 15, 2013.
- ↑ "Find a County". National Association of Counties. Retrieved 2011-06-07.
- ↑ "Montana Place Names Companion". Montana Place Names From Alzada to Zortman. Montana Historical Society Research Center. Retrieved December 1, 2014.
- ↑ Merrill, Andrea; Judy Jacobson (1997). Montana almanac. Helena, Montana: Falcon Publishing. ISBN 1-56044-493-2.
- ↑ Where It All Began, pp 163
- ↑ Where It All Began, pp 165-6
- ↑ "2010 Census Gazetteer Files". United States Census Bureau. August 22, 2012. Retrieved November 28, 2014.
- ↑ Montana Dept. of Labor and Industry (September 2010). "Demographic & Economic Information for Deer Lodge County" (PDF). Retrieved 30 July 2011.
- ↑ "County Totals Dataset: Population, Population Change and Estimated Components of Population Change: April 1, 2010 to July 1, 2015". Retrieved July 2, 2016.
- ↑ "U.S. Decennial Census". United States Census Bureau. Retrieved November 28, 2014.
- ↑ "Historical Census Browser". University of Virginia Library. Retrieved November 28, 2014.
- ↑ "Population of Counties by Decennial Census: 1900 to 1990". United States Census Bureau. Retrieved November 28, 2014.
- ↑ "Census 2000 PHC-T-4. Ranking Tables for Counties: 1990 and 2000" (PDF). United States Census Bureau. Retrieved November 28, 2014.
- ↑ "American FactFinder". United States Census Bureau. Retrieved 2008-01-31.
- 1 2 3 "DP-1 Profile of General Population and Housing Characteristics: 2010 Demographic Profile Data". United States Census Bureau. Retrieved 2016-01-09.
- ↑ "Population, Housing Units, Area, and Density: 2010 - County". United States Census Bureau. Retrieved 2016-01-09.
- ↑ "DP02 SELECTED SOCIAL CHARACTERISTICS IN THE UNITED STATES – 2006-2010 American Community Survey 5-Year Estimates". United States Census Bureau. Retrieved 2016-01-09.
- ↑ "DP03 SELECTED ECONOMIC CHARACTERISTICS – 2006-2010 American Community Survey 5-Year Estimates". United States Census Bureau. Retrieved 2016-01-09.
- ↑ Geographie Electorale
- ↑ The New York Times electoral map (Zoom in on Montana)
- ↑ David Leip's Election Atlas
- ↑ Montana government site
Sources
- Powell County Museum and Arts Foundation: Historic Action Committee (1989). Powell County: Where It All Began. Powell County Museum and Arts Foundation.
External links
| Wikimedia Commons has media related to Deer Lodge County, Montana. |
Coordinates: 46°07′14″N 112°59′15″W / 46.12062°N 112.98746°W
 |
Granite County | Powell County | | |
| Ravalli County | |
Jefferson County | ||
| ||||
| | ||||
| Beaverhead County | Silver Bow County |
Municipalities and communities of Deer Lodge County, Montana, United States | ||
|---|---|---|
| City | | |
| Unincorporated communities | ||
| Ghost town | ||