East Whittier, California
| East Whittier | |
|---|---|
| census-designated place | |
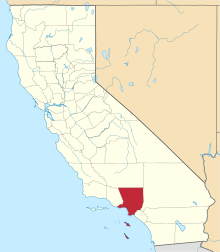
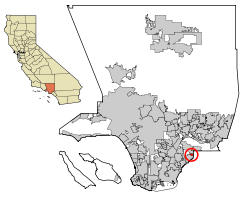 Location of East Whittier in Los Angeles County, California. | |
 East Whittier Location in the United States | |
| Coordinates: 33°55′28″N 117°59′20″W / 33.92444°N 117.98889°WCoordinates: 33°55′28″N 117°59′20″W / 33.92444°N 117.98889°W | |
| Country |
|
| State |
|
| County | Los Angeles |
| Area[1] | |
| • Total | 1.090 sq mi (2.824 km2) |
| • Land | 1.090 sq mi (2.824 km2) |
| • Water | 0 sq mi (0 km2) 0% |
| Elevation | 226 ft (69 m) |
| Population (2010) | |
| • Total | 9,757 |
| • Density | 9,000/sq mi (3,500/km2) |
| Time zone | PST (UTC-8) |
| • Summer (DST) | PDT (UTC-7) |
| ZIP code | 90604 |
| Area code(s) | 562 |
| FIPS code | 06-21292 |
| GNIS feature ID | 1867017 |
East Whittier is a census-designated place (CDP) in Los Angeles County, California, United States. The population was 9,757 at the 2010 census, up from 9,538 at the 2000 census.The name was changed from East La Mirada in 2012, likely due to its precise location in relation to the city of Whittier.[2][3] The previous delineation of East Whittier CDP occurred during the 1960 census, when the area recorded a population of 19,884.[4]
Geography
East Whittier is located at 33°55′28″N 117°59′20″W / 33.92444°N 117.98889°W (33.924403, -117.988975).[5]
According to the United States Census Bureau, the CDP has a total area of 1.1 square miles (2.8 km2), all land.
Demographics
| Historical population | |||
|---|---|---|---|
| Census | Pop. | %± | |
| 1970 | 12,339 | — | |
| 1980 | 9,688 | −21.5% | |
| 1990 | 9,367 | −3.3% | |
| 2000 | 9,538 | 1.8% | |
| 2010 | 9,757 | 2.3% | |
| source:[6][7] | |||
2010
The 2010 United States Census[8] reported that the CDP had a population of 9,757. The population density was 8,947.4 people per square mile (3,454.6/km²). The racial makeup of the CDP was 7,022 (72.0%) White (41.5% Non-Hispanic White),[9] 178 (1.8%) African American, 78 (0.8%) Native American, 462 (4.7%) Asian, 20 (0.2%) Pacific Islander, 1,557 (16.0%) from other races, and 440 (4.5%) from two or more races. Hispanic or Latino of any race were 4,907 persons (50.3%).
The Census reported that 9,742 people (99.8% of the population) lived in households, 15 (0.2%) lived in non-institutionalized group quarters, and 0 (0%) were institutionalized.
There were 3,295 households, out of which 1,298 (39.4%) had children under the age of 18 living in them, 1,826 (55.4%) were opposite-sex married couples living together, 479 (14.5%) had a female householder with no husband present, 201 (6.1%) had a male householder with no wife present. There were 195 (5.9%) unmarried opposite-sex partnerships, and 21 (0.6%) same-sex married couples or partnerships. 619 households (18.8%) were made up of individuals and 303 (9.2%) had someone living alone who was 65 years of age or older. The average household size was 2.96. There were 2,506 families (76.1% of all households); the average family size was 3.36.
The population was spread out with 2,356 people (24.1%) under the age of 18, 1,117 people (11.4%) aged 18 to 24, 2,636 people (27.0%) aged 25 to 44, 2,389 people (24.5%) aged 45 to 64, and 1,259 people (12.9%) who were 65 years of age or older. The median age was 36.2 years. For every 100 females there were 94.2 males. For every 100 females age 18 and over, there were 91.9 males.
There were 3,391 housing units at an average density of 3,109.6 per square mile (1,200.6/km²), of which 2,125 (64.5%) were owner-occupied, and 1,170 (35.5%) were occupied by renters. The homeowner vacancy rate was 0.6%; the rental vacancy rate was 4.6%. 6,598 people (67.6% of the population) lived in owner-occupied housing units and 3,144 people (32.2%) lived in rental housing units.
According to the United States Census Bureau, East Whittier has a median household income of $68,110, with 5.1% of the population living below the federal poverty line.[10]
2000
As of the census[11] of 2000, there were 9,538 people, 3,321 households, and 2,480 families residing in the CDP. The population density was 8,559.0 inhabitants per square mile (3,317.7/km²). There were 3,382 housing units at an average density of 3,034.9 per square mile (1,176.4/km²). The racial makeup of the CDP was 75.29% White, 1.79% Black or African American, 0.77% Native American, 3.65% Asian, 0.14% Pacific Islander, 13.48% from other races, and 4.89% from two or more races. 38.16% of the population were Hispanic or Latino of any race.
There were 3,321 households out of which 36.7% had children under the age of 18 living with them, 58.1% were married couples living together, 12.0% had a female householder with no husband present, and 25.3% were non-families. 19.8% of all households were made up of individuals and 8.6% had someone living alone who was 65 years of age or older. The average household size was 2.86 and the average family size was 3.32.
In the CDP the population was spread out with 27.5% under the age of 18, 9.2% from 18 to 24, 30.0% from 25 to 44, 20.8% from 45 to 64, and 12.5% who were 65 years of age or older. The median age was 35 years. For every 100 females there were 94.6 males. For every 100 females age 18 and over, there were 91.3 males.
The median income for a household in the CDP was $51,440, and the median income for a family was $59,063. Males had a median income of $46,395 versus $31,670 for females. The per capita income for the CDP was $20,613. About 4.3% of families and 5.8% of the population were below the poverty line, including 2.7% of those under age 18 and 10.3% of those age 65 or over.
Government
In the California State Legislature, East Whittier is in the 32nd Senate District, represented by Democrat Tony Mendoza, and in the 57th Assembly District, represented by Democrat Ian Calderon.[12]
In the United States House of Representatives, East Whittier is in California's 38th congressional district, represented by Democrat Linda Sánchez.[13]
Climate
According to the Köppen Climate Classification system, East Whittier has a warm-summer Mediterranean climate, abbreviated "Csa" on climate maps.[14]
| Climate data for East Whittier, California | |||||||||||||
|---|---|---|---|---|---|---|---|---|---|---|---|---|---|
| Month | Jan | Feb | Mar | Apr | May | Jun | Jul | Aug | Sep | Oct | Nov | Dec | Year |
| Average high °C (°F) | 19 (66) |
19 (67) |
19 (67) |
21 (69) |
21 (70) |
23 (73) |
25 (77) |
26 (78) |
26 (78) |
24 (75) |
22 (71) |
19 (67) |
22 (71) |
| Average low °C (°F) | 9 (49) |
10 (50) |
11 (51) |
12 (53) |
13 (56) |
15 (59) |
17 (62) |
17 (63) |
17 (62) |
15 (59) |
12 (54) |
10 (50) |
13 (56) |
| Average precipitation mm (inches) | 104 (4.1) |
124 (4.9) |
89 (3.5) |
23 (0.9) |
8 (0.3) |
3 (0.1) |
0 (0) |
5 (0.2) |
8 (0.3) |
15 (0.6) |
36 (1.4) |
61 (2.4) |
475 (18.7) |
| Source: Weatherbase [15] | |||||||||||||
References
- ↑ "2010 Census U.S. Gazetteer Files – Places – California". United States Census Bureau.
- ↑ U.S. Census Geographic Change Notes: California
- ↑ Boundary Map and Geodata for the CDP of East Whittier in California.
- ↑ Census of Population, 1960: Total Population Counts for California, Volume 1, Part 1
- ↑ "US Gazetteer files: 2010, 2000, and 1990". United States Census Bureau. 2011-02-12. Retrieved 2011-04-23.
- ↑ "CENSUS OF POPULATION AND HOUSING (1790-2000)". U.S. Census Bureau. Retrieved 2010-07-17.
- ↑ http://factfinder2.census.gov/faces/tableservices/jsf/pages/productview.xhtml?pid=DEC_10_PL_GCTPL1.ST13&prodType=table US Census Bureau
- ↑ "2010 Census Interactive Population Search: CA - East La Mirada CDP". U.S. Census Bureau. Retrieved July 12, 2014.
- ↑ http://quickfacts.census.gov/qfd/states/06/0620746.html. Missing or empty
|title=(help) - ↑ http://quickfacts.census.gov/qfd/states/06/0621292.html. Missing or empty
|title=(help) - ↑ "American FactFinder". United States Census Bureau. Retrieved 2008-01-31.
- ↑ "Statewide Database". Regents of the University of California. Retrieved April 9, 2015.
- ↑ "California's 38th Congressional District - Representatives & District Map". Civic Impulse, LLC.
- ↑ Climate Summary for East Whittier, California
- ↑ "Weatherbase.com". Weatherbase. 2013. Retrieved on November 2, 2013.