Energy in Belgium
.jpg)
Energy in Belgium describes energy and electricity production, consumption and import in Belgium.
It is governed by the energy policy of Belgium, which is split over several levels of government. For example, the regional level is responsible for awarding green certificates (except for offshore wind parks) and the national level for anything concerning nuclear power. As a member country of the European Union Belgium also complies to its energy policy.
Overview
| Energy in Belgium[1] | ||||||
|---|---|---|---|---|---|---|
| Capita | Prim. energy | Production | Import | Electricity | CO2-emission | |
| Million | TWh | TWh | TWh | TWh | Mt | |
| 2004 | 10.4 | 671 | 157 | 605 | 89 | 116 |
| 2007 | 10.6 | 663 | 167 | 603 | 92 | 106 |
| 2008 | 10.7 | 681 | 169 | 656 | 91 | 111 |
| 2009 | 10.8 | 665 | 178 | 577 | 85 | 101 |
| 2012 | 11.0 | 687 | 212 | 575 | 89 | 109 |
| 2012R | 11.1 | 651 | 185 | 545 | 88.9 | 104.6 |
| 2013 | 11.1 | 655 | 173 | 574 | 89.1 | 89.1 |
| Change 2004-09 | 3.6 % | -0.8 % | 13.2 % | -4.7 % | -4.5 % | -13.2 % |
| Mtoe = 11.63 TWh. Prim. energy includes energy losses that are 2/3 for nuclear power[2]
2012R = CO2 calculation criteria changed, numbers updated | ||||||
Primary energy consumption

Primary energy is the amount of extractable energy present in fuels as they are found in nature. It is often expressed in tonnes of oil equivalent (toe) or watt-hour (Wh). Unless stated otherwise the lower heating value is used in the remainder of this text. A portion of primary energy is converted into other forms before it is used, depending on the energy conversion efficiency of the installation and method employed this number differs significantly from the final energy as consumed by end users.
| Gross primary energy by source(Mtoe)[3][4] | |||||||
|---|---|---|---|---|---|---|---|
| Coal | Oil | Natural gas | Nuclear | Renewable &
waste-to-energy |
Other (electricity
import/export) |
Total | |
| 2006 | 5.165 | 23.782 | 15.044 | 12.154 | 2.293 | +0.960 | 59.398 |
| 2007 | 4.612 | 23.073 | 14.969 | 12.566 | 2.917 | +0.682 | 58.819 |
| 2008 | 4.713 | 24.882 | 14.879 | 11.873 | 2.347 | +1.027 | 59.721 |
| 2009 | 3.257 | 24.615 | 15.153 | 12.304 | 2.706 | −0.021 | 58.014 |
| 2010 | 3.394 | 25.880 | 17.006 | 12.492 | 2.872 | +0.260 | 61.940 |
| share in 2010 | 5.48% | 41.8% | 27.5% | 20.2% | 4.64% | 0.42% | |
Production
In recent years own production is about 25%. However this is mostly due to nuclear power generation, which by convention is counted as domestic production despite the uranium being imported. Renewable energy sources account for the rest of own production.[3]
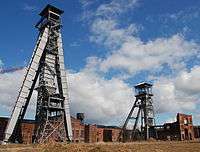
Historically, up until 1992, coal was mined in Belgium. Since 2000 the quantities of Coalbed methane have been researched.[5] These show that a concession of Limburgse Reconversie Maatschappij would contain 7 billion cubic meters of mine gas. In 2012 a deal was made with the Australian Dart Energy to investigate the practical extraction of this mine gas.[6]
Import
In 2010, crude oil was imported mainly from Russia (44%), and OPEC countries (23%). Norway was the largest (37%) supplier of natural gas followed by The Netherlands (29%). While 39% of coal was imported from the United States and 22% from Australia.[3]
Energy carrier conversions
Oil refining
At the end of 2011 Belgium had a distillation capacity 41 Mt. That year 72% of the capacity was used. [7]
Electricity
Electrabel is main producer of electricity, followed by EDF Luminus.
With the exception of 2009 Belgium has been a net importer in recent years.
Short term trading is done via the Belpex energy exchange, which is now part of APX-ENDEX. The Belgian transmission grid, operated by Elia System Operator, has a central position in the Synchronous grid of Continental Europe. This allows Belgium to trade electricity with its neighbours. Though currently there are only physical connections with the Netherlands and France. Direct links with Germany(Alegro) and The United Kingdom(Nemo) are planned. Currently a maximum of 3500 MW can be imported.[8] In comparison, the net installed generation capacity in Belgium is estimated to be 19,627 MW.[9]
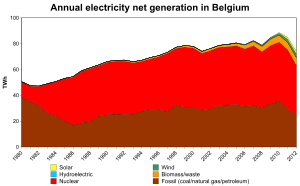
In 2010, Belgium produced 95 TWh of electricity. After subtraction of the electricity used in the production process and losses and addition of the net import 84 TWh was consumed by end users.[3]
According to the GEMIX report the potential of renewable energy sources is 17 TWh per year.[10] Edora, the union of renewable energy producers in Wallonia refers to studies claiming that 7.8 TWh may come from renewable sources in 2015.[11] In 2000, renewable energy (including biomass) was used for producing 0.95% of the 78.85 TWh of electricity produced domestically[12] In 2011 wind and solar power generated 3.8 TWh.[9]
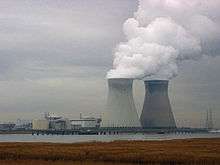
Nuclear power
Nuclear power typically contributes between 50% and 60% of the electricity produced domestically (50.4% in 2010).[3]
Belgium has two nuclear power plants:
- Nuclear Plant Doel with four reactors of 392, 433, 1006 and 1008 MWe (1975)
- Nuclear Plant Tihange with three reactors of 962, 1008 and 1015 MWe (1975)
By law[13] the nuclear power plants are to be phased-out. The first reactors are scheduled to be taken out of service in 2014, the last ones by 2025. It is widely assumed that the government will replace that law.
Two reactors are scheduled to be shut down by 2015. The lifetime of one old reactor has been extended through to 2025.
Fossil fuels
The use of coal in thermal power plants has been decreasing, in 2000 it was still used to produce 14.25% of electricity,[12] by 2006 this had dropped to about 10%. In 2010 it was down to 6.3%.[3] The conventional coal units of the thermal power plants in Mol and Kallo were closed.[14] Oil is also playing an increasingly less prominent role in 2010 it accounted only for 0.4% of gross electricity production.
This reduction is mostly compensated by a rise in popularity of natural gas. Where in 2000 gas only accounted for 23% it was up to 33%(including blast furnace gas) of gross electricity generated in 2010.[3][12] Natural gas power plants are less polluting and have a short start-up time,
Fluxys is the main operator in natural gas transmission.
Several power stations use a combined cycle including: Drogenbos, Amercoeur, Tessenderlo. Building permits are processed for plants in Seneffe and Visé.
Wind power
At the start of 2012, there were 498 operational wind turbines in Belgium, with a capacity of 1080 MW.[15] The amount of electricity generated from wind energy has surpassed 2 TWh per year.[16]
On Sunday 6 February 2011, 12% of the consumed electricity was generated by wind turbines. Due to high winds. [16]
There are seven large-scale offshore wind farm projects. Northwind (216MW), Thorntonbank Wind Farm (325 MW), Belwind Wind Farm (330 MW) are operational. The others are in various stages of planning.
| EU and Belgium Wind Energy Capacity (MW)[17][18][19][20] | ||||||||||||||||
|---|---|---|---|---|---|---|---|---|---|---|---|---|---|---|---|---|
| No | Country | 2012 | 2011 | 2010 | 2009 | 2008 | 2007 | 2006 | 2005 | 2004 | 2003 | 2002 | 2001 | 2000 | 1999 | 1998 |
| – | EU-27 | 105,696 | 93,957 | 84,074 | 74,767 | 64,712 | 56,517 | 48,069 | 40,511 | 34,383 | 28,599 | 23,159 | 17,315 | 12,887 | 9,678 | 6,453 |
| 15 | Belgium | 1,375 | 1,078 | 911 | 563 | 415 | 287 | 194 | 167 | 96 | 68 | 35 | 32 | 13 | 6 | 6 |
Solar power
The exploitation of Solar power is on the rise in Belgium. In 2014 the installed capacity expanded to almost 3 GWp, nearly all of it was grid connected. Belgium's 2953 MWp of photovoltaics produced an estimated 2752 GWh of electricity in 2014.[21]
| Year | Photovoltaics | CSP | ||
|---|---|---|---|---|
| MWp | GWh | MWp | GWh | |
| 2008 | 70.9 | |||
| 2009 | 574 | 488 | ||
| 2010 | 787 | 560 | ||
| 2011 | 1812 | 1282 | ||
| 2012 | 2506 | 2149 | ||
| 2013 | 2758 | 2640 | ||
| 2014 | 2953 | 2752 |
Biomass and waste
In 2009, biomass and biogas were used to generate 3.5 TWh or 3.8% of gross domestic electricity production.[4]
In 2010 5.07 million tonnes of waste was produced in Belgium, of which 1.75 Mt was incinerated. Nearly always (99.8% of the time) energy was recovered during incineration. Non renewable waste was used for producing 1.4% of the gross domestic electricity production. 1.9 Mt was recycled and 1 Mt was composted or fermented; only 0.062 Mt was dumped.[25] Ten years earlier this was only 0.71%.[12]
Hydroelectric power
Belgium has two pumped storage hydroelectric power stations: Coo-Trois-Ponts (1164 MW) and Plate-Taille (143 MW). Pumped storage stations are a net consumer of electricity, but they contributed 1.4% to the gross electricity production in 2010.[3]
Despite the limited potential there are also a number of stations generating hydroelectric power. With a combined capacity of about 100 MW. Contributing 0.3% of gross domestic production in 2010.[3]
Almost all of this capacity is realised in the Walloon Region. Even though hydroelectric power was used extensively in Flanders prior to the industrial revolution, there are no rivers where it can be generated on a large scale.[26] The region's 15 installations have a combined capacity just shy of 1 MW (994 kW).[27]
Final energy consumption
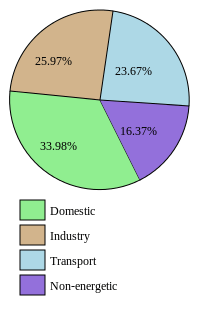
In 2010 the largest share (34%) of final energy was for domestic use (this includes: households, service sector, commerce, and agriculture). Transport and industrial sector both consumed about a quarter. Fossil fuels are also used as raw material in several manufacturing processes, this non-energetic use accounts for the remainder of the final energy.[3]
A more detailed picture of the energy and type of fuel used by various activities is given in the table below.
| final energy by activity(ktoe)[4] | ||||||||
|---|---|---|---|---|---|---|---|---|
| Electricity | Natural gas | Coal | Oil | Renewable | Heat | Total | Share of final energy | |
| Domestic usage (2009) | ||||||||
| Households | 1738 | 3322 | 264 | 2756 | 231 | 13 | 8324 | 20.2% |
| Commerce and services | 1847 | 1728 | 952 | 9 | 69 | 4605 | 11.2% | |
| Agriculture | 88 | 235 | 433 | 35 | 25 | 816 | 2.0% | |
| Other | 9 | 9 | 46 | 64 | 0.2% | |||
| Industrial usage (2009) | ||||||||
| Chemical | 746 | 1979 | 13 | 149 | 18 | 370 | 3275 | 7.9% |
| Iron and steel | 447 | 678 | 578 | 11 | 1714 | 4.2% | ||
| Non metal minerals | 168 | 290 | 202 | 269 | 94 | 1023 | 2.5% | |
| Food/beverage/tobacco | 400 | 531 | 56 | 51 | 18 | 30 | 1086 | 2.6% |
| Printing/paper pulp | 205 | 148 | 33 | 15 | 307 | 50 | 758 | 1.8% |
| Construction | 110 | 197 | 63 | 3 | 370 | 0.9% | ||
| Non ferro metals | 114 | 96 | 22 | 111 | 343 | 0.8% | ||
| Machinery | 151 | 66 | 2 | 17 | 2 | 238 | 0.6% | |
| Textile and leather | 108 | 97 | 3 | 1 | 3 | 212 | 0.5% | |
| Transportation items | 87 | 92 | 4 | 183 | 0.4% | |||
| Wood | 67 | 9 | 103 | 179 | 0.4% | |||
| Extractive industries | 54 | 11 | 65 | 0.2% | ||||
| Other | 152 | 42 | 6 | 218 | 14 | 432 | 1.0% | |
| Transport usage (2009) | ||||||||
| Road | 8881 | 231 | 9112 | 22.1% | ||||
| Air | 1295 | 1295 | 3.1% | |||||
| Rail | 151 | 35 | 186 | 0.5% | ||||
| Inland navigation | 165 | 165 | 0.4% | |||||
| Total final usage (2010)[3] | ||||||||
| Absolute 2010 | 7163 | 11960 | 1363 | 21746 | 1156 | 640 | 44028 | |
| Share 2010 | 16.3% | 27.2% | 3.1% | 49.4% | 2.6% | 1.5% | 100% | |
Brussels-Capital Region
In the Brussels-Capital Region, the electricity and natural gas net are operated by Sibelga. In 2011, the natural gas consumption was 10,480 GWh and the electricity consumption was 5,087 GWh.[28]
Sibelga invests in combined heat and power (CHP) installations for which it receives green certificates. In 2011 its eleven installations had a combined capacity of 17.8 MWe and 19.7 MWth and generated 50.5 GWh of electricity.[28]
The Region of Brussels-Capital also encourages MicroCHP[29] and implemented the European directive of 2002/91/CE on Energy Performance of Buildings.
Corporations
The companies Umicore, BASF, Solvay, Duferco, Tessenderlo Chemie, ArcelorMittal, and Air Liquide together account for about 15% of the total electricity consumption of Belgium in 2006.[30]
Greenhouse gas emissions
In 1990, the greenhouse gas (GHG) emissions were 146.9 million tons of CO2 equivalent (Mt CO2 eq), whose 88 million tons came from the Flemish Region, 54.8 from the Walloon Region and 4 Mt from the Brussels-capital Region.[31]
Being a member of the European Union, Belgium, applied the European Union Emission Trading Scheme set up by the Directive 2003/87/EC. The Kyoto protocol sets a 7.5% reduction of greenhouse gas emission target compared to 1990. Belgium set up a National Allocation Plan at the federal level with target for each of the three regions.
Belgium takes part in the United Nations Framework Convention on Climate Change and has ratified the Kyoto Protocol.
On 14 November 2002, Belgium signed the Cooperation Agreement for the implementation of a National Climate Plan and reporting in the context of the UNFCCC and the Kyoto protocol. The first National Allocation Plan was for the period from 2005 to 2007. The European commission approved it on 20 October 2004. The second allocation plan was for the period 2008–2012 and aims a reduction of 7.5% of green house gas emissions compared to 1990.
Business
According to Forbes list of billionaires (2011), the Belgian billionaire Wang Xingchun ($1 B 2011) made his wealth in coal business.[32] Wang is a resident of Singapore who holds a Belgian citizenship. Wang is chairman of minerals concern Winsway Coking Coal, an importer of coal to China from Mongolia that went public in Hong Kong 2010.[33]
See also
| Wikimedia Commons has media related to Energy in Belgium. |
References
- ↑ IEA Key World Energy Statistics Statistics 2015, 2014 (2012R as in November 2015 + 2012 as in March 2014 is comparable to previous years statistical calculation criteria, 2013, 2012, 2011, 2010, 2009, 2006 IEA October, crude oil p.11, coal p. 13 gas p. 15
- ↑ Energy in Sweden 2010. Facts and figures. The Swedish Energy Agency. Table 8 Losses in nuclear power stations Table 9 Nuclear power brutto
- 1 2 3 4 5 6 7 8 9 10 11 "Energie Observatorium Kerncijfers 2010" (PDF) (in Dutch). FOD Economie. Retrieved 10 November 2012.
- 1 2 3 "De energiemarkt in 2009" (PDF). FOD Economie,K.M.O,Middenstand en Energie. Retrieved 12 November 2012.
- ↑ "Nieuwsbrief Nr 12" (PDF). VITO. March 2000. Retrieved 20 December 2012.
- ↑ "Belgium". Dart Energy. Retrieved 20 December 2012.
- ↑ "Jaarverslag 2011" (PDF). Belgische Petroleum Federatie. p. 2. Retrieved 17 November 2012.
- ↑ "Factsheet elia" (PDF). Elia. Retrieved 17 November 2012.
- 1 2 "Jaarverslag 2011" (PDF). FEBEG. Retrieved 17 November 2012.
- ↑ http://economie.fgov.be/fr/binaries/rapport_gemix_2009_fr_tcm326-76356.pdf
- ↑ http://edora.org/doc/news_24/091002%20CP%20EDORA%20_sortie%20nucleaire.pdf
- 1 2 3 4 "DRAFT of Belgian National Allocation Plan for CO2-emission allowances 2008–2012" (PDF). September 2006.
- ↑ 31 Januari 2003. – Wet houdende de geleidelijke uitstap uit kernenergie voor industriële elektriciteitsproductie."Belgisch Staatsblad N. 66 (jaargang 173)" (pdf) (in Dutch and French). Belgisch Staatsblad. 28 February 2003. pp. 17662–17665.
- ↑ "Activities and Sustainable Development Report 2010" (PDF). Electrabel. Retrieved 17 November 2012.
- ↑ Environ 500 éoliennes en Belgique, Lalibre.be, 11 janvier 2012
- 1 2 "Record aan stroom uit windmolens". Gazet van Antwerpen. 8 February 2011. Retrieved 5 November 2012.
- ↑ EWEA Staff (2010). "Cumulative installed capacity per EU Member State 1998 – 2009 (MW)". European Wind Energy Association. Retrieved 2010-05-22.
- ↑ EWEA Staff (February 2011). "EWEA Annual Statistics 2010" (PDF). European Wind Energy Association. Retrieved 2011-01-31.
- ↑ EWEA Staff (February 2012). "EWEA Annual Statistics 2011" (PDF). European Wind Energy Association. Retrieved 2011-02-18.
- ↑ Wind in power: 2012 European statistics February 2013
- 1 2 "APERe - Observatoire photovoltaïque". www.apere.org. Retrieved 2015-10-30.
- ↑ Photovoltaic Barometer 2012
- ↑ Photovoltaic Barometer 2010
- ↑ Photovoltaic Barometer 2011
- ↑ "Key Figures 2012" (PDF). Retrieved 18 November 2012.
- ↑ "Kleine Waterkracht" (PDF) (in Dutch). ODE (Organisatie voor duurzame energie). Retrieved 29 November 2012.
- ↑ "Geïnstalleerd vermogen en aantal groenestroominstallaties per provincie" (PDF) (in Dutch). VREG. June 2012.
- 1 2 "Rapport annuel 2011" (PDF) (in French). Sibelga. Retrieved 9 November 2012.
- ↑ http://www.curbain.be/download/CONF_09.1c-09-06-24_QuelAvenirPourLaMicrocogeneration.pdf
- ↑ http://www.solvay.com/EN/NewsPress/Documents/2006/20061011_bluesky_EN.pdf
- ↑ Federal Public Service of Public Health, Food Chain Safety and Environment (September 2006). Draft of Belgian National Allocation Plan for CO2-emission allowances 2008–2012 (PDF). Brussels.
- ↑ Forbes list of billionaires (2011) Forbes list of billionaires (2011) Energy Forbes 10 March 2011
- ↑ Forbes profile Wang Xingchun Forbes Belgium