Elections in Belgium
 |
| This article is part of a series on the politics and government of Belgium |
| Constitution |
|
| Foreign relations |
Elections in Belgium are organised for legislative bodies only, and not for executive functions. Direct elections take place for the European Parliament, the bicameral Federal Parliament, the Parliaments of the Communities and Regions, the provincial councils, the municipal councils and a few district councils. Voting is mandatory and all elections use proportional representation which in general requires coalition governments.
The method of election, the elected bodies, and the political party system have changed drastically since the founding of Belgium in 1830. At first, there were only municipal, provincial and national elections with only few people being able to vote on the national level. Over time, voting rights were extended and eventually made compulsory. In the second half the 20th century, political parties split along linguistic lines and the number of parties increased. In 1979, the European Parliament became a directly elected supranational body and as a result of the federalisation of the country, the Communities and Regions of Belgium also got their own legislatures which have been directly elected since 1993.
Election method

Belgium has a multi-party system, with numerous political parties in which no one party often has a chance of gaining power alone, and parties must work with each other to form coalition governments.
Several months before an election, each party forms a list of candidates for each district. Parties are allowed to place as many candidates on their "ticket" as there are seats available. The formation of the list is an internal process that varies with each party. The place on the list influences the election of a candidate, but its influence has diminished since the last electoral reform.
Political campaigns in Belgium are relatively short, lasting only about one month, and there are restrictions on the use of billboards. For all of their activities, campaigns included, the political parties have to rely on government subsidies and dues paid by their members.
Since no single party holds an absolute majority, after the election the strongest party or party family will usually create a coalition with some of the other parties to form the government.
Voting is compulsory in Belgium; more than 90% of the population participates. Belgian voters are given five options when voting. They may—
- Vote for a list as a whole, thereby showing approval of the order established by the party they vote for
- Vote for one or more individual candidates belonging to one party, regardless of his or her ranking on the list. This is a "preference vote"
- Vote for one or more of the "alternates (substitutes)"
- Vote for one or more candidates, and one or more alternates, all of the same party
- Vote invalid or blank so no one receives the vote
Voting in Belgium is done by paper voting or electronic voting on a computer depending on the place of voting. A few weeks before the actual election, every Belgian older than 18 receives a voting card with the details of where and when to vote. The voting cards are sent by the municipal administration to all of the municipality's inhabitants based on the national population register. Voting bureaus are usually in schools. On polling day, always a Sunday, a volunteer at the voting bureau checks the voter in. After taking the voter's electronic identity card and voting card, the volunteer issues a magnetic card to operate the voting machine. After the voter has finished, the volunteer verifies that the magnetic card was used to cast a valid vote, then returns the voter's ID and voting card, now stamped as proof of having voted.
Levels of election
European elections
Belgian voters elect 21 members to the European Parliament. This number gradually decreased following the accession of new member states to the European Union, the latest being Croatia in 2013. Direct elections take place since 1979.
There are three constituencies, organised by linguistic community:
| Constituency | 1979 & 1984 & 1989 | 1994 & 1999 | 2004 | 2009 | 2014 |
|---|---|---|---|---|---|
| Dutch-speaking electoral college | 13 / 24 | 14 / 25 | 14 / 24 | 13 / 22 | 12 / 21 |
| French-speaking electoral college | 11 / 24 | 10 / 25 | 9 / 24 | 8 / 22 | 8 / 21 |
| German-speaking electoral college | 1 / 25 | 1 / 24 | 1 / 22 | 1 / 21 |
Federal elections
Belgium elects its bicameral federal legislature, the Federal Parliament (Federaal Parlement/Parlement fédéral/Föderales Parlament).
- The Chamber of Representatives (Kamer van Volksvertegenwoordigers/Chambre des Représentants/Abgeordnetenkammer) consists of 150 members, each elected for a five-year term by proportional representation. Prior to the 1993 state reform, it had 212 members.
- The Senate (Senaat/Sénat/Senat) has 60 members, of which 50 are appointed by the community and regional parliaments, and 10 are co-opted (i.e., appointed by the other senators). Before 2014 (due to the sixth Belgian state reform) the Senate had 71 members, of which 40 were directly elected.
Elections for the Federal Parliament are normally held every five years, coinciding with the European (and consequently also regional) elections. Early elections are possible, after which the legislature lasts until the next European election. Before the sixth Belgian state reform, the term was four years without any link to the other elections.
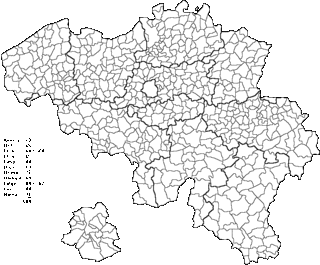
There are eleven constituencies coinciding with the ten provinces and the Brussels-Capital Region. Previous to 2012, Brussels formed together with half of the province of Flemish Brabant the Brussels-Halle-Vilvoorde constituency.
Number of seats by constituency:
| Constituency | 2002–2012 | 2012–present |
|---|---|---|
| Antwerp | 24 / 150 | |
| East Flanders | 20 / 150 | |
| Hainaut | 19 / 150 | 18 / 150 |
| West Flanders | 16 / 150 | |
| Brussels-Capital Region | 15 / 150 | |
| Brussels-Halle-Vilvoorde | 22 / 150 | |
| Flemish Brabant | 15 / 150 | |
| Leuven | 7 / 150 | |
| Liège | 15 / 150 | |
| Limburg | 12 / 150 | |
| Namur | 6 / 150 | |
| Walloon Brabant | 5 / 150 | |
| Luxembourg | 4 / 150 | |
Regional elections
Since the 1993 state reform, the Parliaments of the federated entities (Communities and Regions) are directly elected with elections always coinciding with European Parliament elections (thus with fixed terms of five years). Previously, these Parliaments consisted of the federal representatives elected in the respective region.
The Flemish Parliament, Walloon Parliament, the Brussels Regional Parliament and the Parliament of the German-speaking Community are directly elected. The Parliament of the French Community consists of all members of the Walloon Parliament as well as 19 members chosen by the French-speaking members of the Brussels Regional Parliament.
|
|
|
Local elections

Starting with the 2006 local elections, these elections are organised by the three Regions (Flanders, Brussels and Wallonia). These elections still coincide, with legislatures of 6 years. The last local elections were the 2012 elections; the next ones are in 2018 unless a Region changes its electoral law by then.
Provincial elections
The Flemish and Walloon Region both have five provinces each. These ten have directly elected provincial councils. Both regions decreased the number of provincial councillors starting with the 2012 elections.
Municipal elections
All three regions have municipalities with municipal councils. Unlike all other levels, the seats in the municipal councils are apportioned using the Imperiali quota, which slightly favours larger parties to ensure more stable coalitions.
District elections
The largest cities in Belgium have the possibility of installing urban districts. Only the city of Antwerp made use of this, which consequently has nine districts with their own directly elected district councils in addition to the municipal council of Antwerp.
Referendums
Binding referendums in Belgium are not legally possible because of the constitutional principle that the country's powers are exercised by the nation and not by the people. Consequently, Belgium is a representative democracy, almost without any form of direct democracy.
The Constitution did neither allow for non-binding referenda, but in 1950 a referendum was organised anyway with the question whether King Leopold III should return to the throne. There were large regional differences in the results, and no national referendum has been held ever since.
In the 1990s though, new laws and eventually a constitutional amendment allowed for non-binding referenda on the municipal and provincial level. A 2005 constitutional change made the Regions responsible for these local referenda. They are however still rarely organised. The sixth Belgian state reform of 2011 foresees a constitutional change to allow for regional referenda as well; this has however not yet been done as of 2013.
Past elections
The latest federal elections took place on 25 May 2014, coinciding with the European and regional elections.
2014 federal election
| ← 2010 • 2014 • 2019 → | ||||||||
| Party | Leader(s) | Votes | % | +/– | E.c. % | Seats | +/– | |
|---|---|---|---|---|---|---|---|---|
| New Flemish Alliance (N-VA) | Bart De Wever | 1,366,414 | 20.26 | 2.86 |
32.22 | 33 / 150 |
6 | |
| Socialist Party (PS) | Elio Di Rupo | 787,165 | 11.67 | 2.05 |
31.43 | 23 / 150 |
3 | |
| Christian Democratic & Flemish (CD&V) | Wouter Beke | 783,060 | 11.61 | 0.77 |
18.47 | 18 / 150 |
1 | |
| Open Flemish Liberals and Democrats (Open Vld) | Gwendolyn Rutten | 659,582 | 9.78 | 1.17 |
15.55 | 14 / 150 |
1 | |
| Reformist Movement (MR) | Charles Michel | 650,290 | 9.64 | 0.31 |
25.96 | 20 / 150 |
2 | |
| Socialist Party–Differently (sp.a) | Bruno Tobback | 595,486 | 8.83 | 0.36 |
14.04 | 13 / 150 |
0 | |
| Green (Groen) | Wouter Van Besien | 358,947 | 5.32 | 0.94 |
8.46 | 6 / 150 |
1 | |
| Humanist Democratic Centre (cdH) | Benoît Lutgen | 336,281 | 4.99 | 0.59 |
13.43 | 9 / 150 |
0 | |
| Workers' Party (PTB–GO!/PVDA+) |
Peter Mertens PVDA+ PTB–GO! |
251,289 118,246 132,685 |
3.72 1.76 1.97 |
2.17 |
— 3.24 5.31 |
2 / 150 |
| |
| Flemish Interest (Vlaams Belang) | Gerolf Annemans | 247,746 | 3.67 | 4.07 |
5.84 | 3 / 150 |
9 | |
| Ecolo | Olivier Deleuze & Emily Hoyos | 222,551 | 3.30 | 1.50 |
8.89 | 6 / 150 |
2 | |
| Francophone Democratic Federalists (FDF) | Olivier Maingain | 121,403 | 1.80 | new | 4.85 | 2 / 150 |
2 | |
| People's Party (Parti Populaire) | Mischaël Modrikamen | 102,599 | 1.51 | 0.24 |
4.10 | 1 / 150 |
0 | |
| Libertarian, Direct, Democratic (LDD) | Jean-Marie Dedecker | 28,414 | 0.42 | 1.88 |
0.67 | 0 / 150 |
1 | |
| Others (parties that received less than 1% of the overall vote) | 233,805 | 3.47 | — | — | 0 / 150 |
0 | ||
| Valid votes | 6,745,059 | 94.24 | ||||||
| Blank and invalid votes | 412,439 | 5.76 | ||||||
| Totals | 7,157,498 | 100.00 | — | — | 150 / 150 |
0 | ||
| Electorate and voter turnout | 8,001,278 | 89.45 | 0.23 |
|||||
| Source: Federal Portal − Chamber Elections 2014 Notes: 1) E.c. = electoral college (Dutch- and French-speaking) | ||||||||
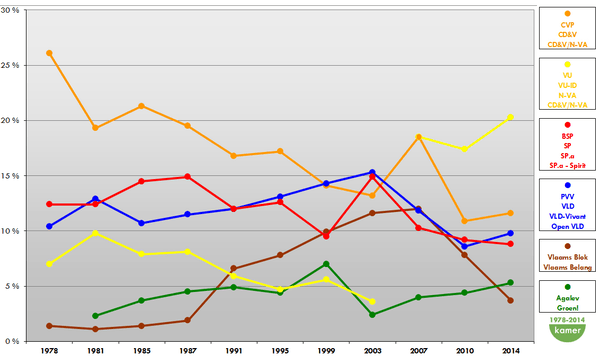
Evolution of election results

Results
- Flemish elections
| Year | CVP CD&V |
VB | SP SP.A |
VLD | VU VU-ID N-VA |
LDD | AGALEV GROEN |
UF | PVDA | Others |
|---|---|---|---|---|---|---|---|---|---|---|
| 1995 regional | 26.78 | 12.33 | 19.45 | 20.18 | 8.96 | — | 7.08 | 1.17 | 0.58 | |
| 1999 regional | 22.09 | 15.54 | 15.00 | 22.04 | 9.25 | — | 11.62 | 0.94 | 0.61 | |
| 2004 regional | 26.09 | 24.15 | 19.66 | 19.79 | * | — | 7.60 | 1.07 | 0.56 | |
| 2007 federal | 29.6 | 19.0 | 16.3 | 18.8 | * | 6.5 | 6.3 | — | — | |
| 2009 regional | 22.86 | 15.28 | 15.27 | 14.99 | 13.06 | 7.62 | 6.77 | 1.15 | 1.04 | |
| 2010 federal | 17.60 | 12.60 | 14.99 | 14.02 | 28.23 | 3.74 | 7.11 | — | 1.3 | |
| 2014 federal | 18.7 | 5.9 | 14.2 | 15.7 | 32.6 | 0.7 | 8.6 | — | 2.8 |
See also
- Electronic voting in Belgium
- Political parties in Belgium
- Political parties in Flanders
- List of elections in Belgium
- Electoral calendar
- Electoral system
External links
- Belgian Election Database in Dutch and in French
- Adam Carr's Election Archive
- NSD: European Election Database - Belgium publishes regional level election data; allows for comparisons of election results, 1991-2010
- Flemish election results, Flemish government