Demographics of Belgium
| Demographics of Kingdom of Belgium | |
|---|---|
|
1948-2009 | |
| Population | 11,200,000 (2013) |
| Growth rate | 0.82% (2008) |
| Birth rate | 11.7 births/1,000 population (2008) |
| Death rate | 9.2 deaths/1,000 population (2008) |
| Life expectancy | 80.38 years (2012) |
| • male | 78.0 years (2013 est.) |
| • female | 83.0 years (2013 est.) |
| Fertility rate | 1.85 children born/woman (2009 est.) |
| Infant mortality rate | 4,62 |
| Age structure | |
| 0–14 years | 16.1% (male 857,373/female 822,303) |
| 15–64 years | 66.3% (male 3,480,072/female 3,419,721) |
| 65 and over | 17.6% (male 760,390/female 1,074,477) (2009 est.) |
| Sex ratio | |
| At birth | 1.04 male(s)/female (2009 est.) |
| Under 15 | 1.04 male(s)/female |
| 15–64 years | 1.02 male(s)/female |
| 65 and over | 0.72 male(s)/female |
| Nationality | |
| Nationality | noun: Belgian(s) adjective: Belgian |
| Major ethnic | 58% Flemish |
| Minor ethnic | 31% Walloon, 11% Mixed/Other |
| Language | |
| Spoken | Dutch, French, German |
This article is about the demographic features of the population of Belgium, including ethnicity, education level, health of the populace, economic status, religious affiliations and other aspects of the population. All figures are from the National Institute for Statistics unless otherwise indicated.[1]
Population
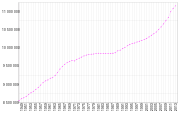
Belgium had a population of 11,190,846 people on 1 January 2015 as compared to 10,839,905 people on 1 January 2010, an increase of 601,000 in comparison to 2000 (10,239,085 inhabitants). Between 1990 (9,947,782 inhabitants) and 2000 the increase was only 291,000. The population of Flanders, Wallonia and Brussels on January 1, 2010 was 6,251,983 (57.7%), 3,498,384 (32.3%) and 1,089,538 (10.1%), respectively.
Immigration
In the beginning of 2012, people of foreign background and their descendants were estimated to have formed 25% of the total population.[2]
Of these 'New Belgians', 1,200,000 (49%) are of European ancestry and 1,350,000 (51%)[3] are from non-Western countries.
Since the relaxation of the Belgian nationality law more than 1.3 million migrants have acquired Belgian citizenship and are now considered new Belgians. 89.2% of inhabitants of Turkish origin have been naturalized, as have 88.4% of people of Moroccan background, 75.4% of Italians, 56.2% of the French and 47.8% of Dutch people.[3]
In 2007, there were 1.38 million foreign-born residents in Belgium, corresponding to 12.9% of the total population. Of these, 685 000 (6.4%) were born outside the EU and 695 000 (6.5%) were born in another EU Member State.[4]
Vital statistics
Births and deaths
Note: Territorial changes in East-Belgium occurred in 1925, 1940 and 1944.
| Average population (x 1,000) | Live births | Deaths | Natural change | Crude birth rate (per 1,000) | Crude death rate (per 1,000) | Natural change (per 1,000) | Fertility rates | |
|---|---|---|---|---|---|---|---|---|
| 1900 | 6,719 | 193,789 | 129,046 | 64,743 | 28.8 | 19.2 | 9.6 | |
| 1901 | 6,747 | 200,077 | 116,077 | 84,000 | 29.7 | 17.2 | 12.4 | |
| 1902 | 6,848 | 195,871 | 119,330 | 76,541 | 28.6 | 17.4 | 11.2 | |
| 1903 | 6,941 | 192,301 | 118,675 | 73,626 | 27.7 | 17.1 | 10.6 | |
| 1904 | 7,030 | 191,721 | 119,506 | 72,215 | 27.3 | 17.0 | 10.3 | |
| 1905 | 7,118 | 187,437 | 118,343 | 69,094 | 26.3 | 16.6 | 9.7 | |
| 1906 | 7,200 | 186,271 | 118,884 | 67,387 | 25.9 | 16.5 | 9.4 | |
| 1907 | 7,278 | 185,138 | 115,347 | 69,791 | 25.4 | 15.8 | 9.6 | |
| 1908 | 7,352 | 183,834 | 121,964 | 61,870 | 25.0 | 16.6 | 8.4 | |
| 1909 | 7,419 | 176,431 | 117,571 | 58,860 | 23.8 | 15.8 | 7.9 | |
| 1910 | 7,438 | 176,413 | 112,826 | 63,587 | 23.7 | 15.2 | 8.5 | |
| 1911 | 7,457 | 171,802 | 122,843 | 48,959 | 23.0 | 16.5 | 6.6 | |
| 1912 | 7,531 | 171,187 | 112,378 | 58,809 | 22.7 | 14.9 | 7.8 | |
| 1913 | 7,605 | 171,099 | 111,227 | 59,872 | 22.5 | 14.6 | 7.9 | |
| 1914 | 7,662 | 156,389 | 108,720 | 47,669 | 20.4 | 14.2 | 6.2 | |
| 1915 | 7,697 | 124,291 | 100,674 | 23,617 | 16.1 | 13.1 | 3.1 | |
| 1916 | 7,701 | 99,360 | 101,044 | -1,684 | 12.9 | 13.1 | -0.2 | |
| 1917 | 7,667 | 86,675 | 124,824 | -38,149 | 11.3 | 16.3 | -5.0 | |
| 1918 | 7,599 | 85,056 | 157,340 | -72,284 | 11.2 | 20.7 | -9.5 | |
| 1919 | 7,566 | 123,314 | 113,732 | 9,582 | 16.3 | 15.0 | 1.3 | |
| 1920 | 7,491 | 164,950 | 102,505 | 62,445 | 22.0 | 13.7 | 8.3 | |
| 1921 | 7,444 | 164,603 | 102,908 | 61,695 | 22.1 | 13.8 | 8.3 | |
| 1922 | 7,511 | 154,871 | 106,615 | 48,256 | 20.6 | 14.2 | 6.4 | |
| 1923 | 7,573 | 156,600 | 100,084 | 56,516 | 20.7 | 13.2 | 7.5 | |
| 1924 | 7,646 | 154,083 | 99,653 | 54,430 | 20.2 | 13.0 | 7.1 | |
| 1925 | 7,748 | 155,330 | 99,569 | 55,761 | 20.0 | 12.9 | 7.2 | |
| 1926 | 7,843 | 151,009 | 101,018 | 49,991 | 19.3 | 12.9 | 6.4 | |
| 1927 | 7,903 | 146,296 | 103,007 | 43,289 | 18.5 | 13.0 | 5.5 | |
| 1928 | 7,968 | 148,071 | 102,270 | 45,801 | 18.6 | 12.8 | 5.7 | |
| 1929 | 8,032 | 147,311 | 115,901 | 31,410 | 18.3 | 14.4 | 3.9 | |
| 1930 | 8,076 | 152,530 | 103,397 | 49,133 | 18.9 | 12.8 | 6.1 | 2.37 |
| 1931 | 8,126 | 149,657 | 103,773 | 45,884 | 18.4 | 12.8 | 5.6 | 2.30 |
| 1932 | 8,186 | 145,835 | 104,221 | 41,614 | 17.8 | 12.7 | 5.1 | 2.22 |
| 1933 | 8,231 | 136,757 | 104,640 | 32,117 | 16.6 | 12.7 | 3.9 | 2.07 |
| 1934 | 8,262 | 133,514 | 96,851 | 36,663 | 16.2 | 11.7 | 4.4 | 2.01 |
| 1935 | 8,288 | 128,432 | 102,132 | 26,300 | 15.5 | 12.3 | 3.2 | 1.92 |
| 1936 | 8,315 | 127,751 | 101,595 | 26,156 | 15.4 | 12.2 | 3.1 | 1.91 |
| 1937 | 8,346 | 128,696 | 104,163 | 24,533 | 15.4 | 12.5 | 2.9 | 1.89 |
| 1938 | 8,374 | 133,610 | 104,684 | 28,926 | 16.0 | 12.5 | 3.5 | 1.96 |
| 1939 | 8,391 | 130,019 | 110,393 | 19,626 | 15.5 | 13.2 | 2.3 | 2.09 |
| 1940 | 8,301 | 112,497 | 125,083 | -12,586 | 13.6 | 15.1 | -1.5 | 1.67 |
| 1941 | 8,276 | 100,616 | 118,670 | -18,054 | 12.2 | 14.3 | -2.2 | 1.49 |
| 1942 | 8,246 | 108,603 | 117,291 | -8,688 | 13.2 | 14.2 | -1.1 | 1.61 |
| 1943 | 8,241 | 123,349 | 107,767 | 15,582 | 15.0 | 13.1 | 1.9 | 1.84 |
| 1944 | 8,291 | 127,122 | 124,861 | 2,261 | 15.3 | 15.1 | 0.3 | 1.89 |
| 1945 | 8,339 | 130,526 | 121,155 | 9,371 | 15.7 | 14.5 | 1.1 | 1.93 |
| 1946 | 8,367 | 152,962 | 110,413 | 42,549 | 18.3 | 13.2 | 5.1 | 2.22 |
| 1947 | 8,450 | 150,227 | 108,136 | 42,091 | 17.8 | 12.8 | 5.0 | 2.16 |
| 1948 | 8,557 | 150,416 | 108,016 | 42,400 | 17.6 | 12.6 | 5.0 | 2.18 |
| 1949 | 8,614 | 147,854 | 111,104 | 36,750 | 17.2 | 12.9 | 4.3 | 2.13 |
| 1950 | 8,639 | 145,672 | 108,236 | 37,436 | 16.9 | 12.5 | 4.3 | 2.34 |
| 1951 | 8,678 | 142,314 | 109,763 | 32,551 | 16.4 | 12.6 | 3.8 | 2.29 |
| 1952 | 8,730 | 146,064 | 104,178 | 41,886 | 16.7 | 11.9 | 4.8 | 2.33 |
| 1953 | 8,778 | 146,125 | 105,863 | 40,262 | 16.6 | 12.1 | 4.6 | 2.33 |
| 1954 | 8,819 | 148,538 | 105,033 | 43,505 | 16.8 | 11.9 | 4.9 | 2.39 |
| 1955 | 8,868 | 149,195 | 108,743 | 40,452 | 16.8 | 12.3 | 4.6 | 2.40 |
| 1956 | 8,924 | 150,210 | 108,761 | 41,449 | 16.8 | 12.2 | 4.6 | 2.42 |
| 1957 | 8,989 | 152,871 | 107,840 | 45,031 | 17.0 | 12.0 | 5.0 | 2.47 |
| 1958 | 9,053 | 155,048 | 106,051 | 48,997 | 17.1 | 11.7 | 5.4 | 2.52 |
| 1959 | 9,104 | 158,237 | 103,933 | 54,304 | 17.4 | 11.4 | 6.0 | 2.59 |
| 1960 | 9,153 | 154,787 | 113,938 | 40,849 | 16.9 | 12.4 | 4.5 | 2.55 |
| 1961 | 9,184 | 158,431 | 106,985 | 51,446 | 17.3 | 11.6 | 5.6 | 2.64 |
| 1962 | 9,251 | 155,061 | 112,758 | 42,303 | 16.8 | 12.2 | 4.6 | 2.59 |
| 1963 | 9,328 | 159,192 | 116,718 | 42,474 | 17.1 | 12.5 | 4.6 | 2.68 |
| 1964 | 9,428 | 160,838 | 110,100 | 50,738 | 17.1 | 11.7 | 5.4 | 2.73 |
| 1965 | 9,499 | 155,496 | 115,045 | 40,451 | 16.4 | 12.1 | 4.3 | 2.60 |
| 1966 | 9,528 | 151,096 | 115,613 | 35,483 | 15.9 | 12.1 | 3.7 | 2.53 |
| 1967 | 9,581 | 146,193 | 115,212 | 30,981 | 15.3 | 12.0 | 3.2 | 2.42 |
| 1968 | 9,619 | 141,984 | 121,744 | 20,240 | 14.8 | 12.7 | 2.1 | 2.31 |
| 1969 | 9,660 | 141,799 | 120,471 | 21,328 | 14.7 | 12.5 | 2.2 | 2.26 |
| 1970 | 9,656 | 142,168 | 118,660 | 23,508 | 14.7 | 12.3 | 2.4 | 2.20 |
| 1971 | 9,695 | 140,966 | 118,853 | 22,113 | 14.5 | 12.3 | 2.3 | 2.18 |
| 1972 | 9,711 | 136,304 | 117,424 | 18,880 | 14.0 | 12.1 | 1.9 | 2.09 |
| 1973 | 9,742 | 129,424 | 118,254 | 11,170 | 13.3 | 12.1 | 1.1 | 1.95 |
| 1974 | 9,772 | 123,674 | 116,159 | 7,515 | 12.7 | 11.9 | 0.8 | 1.83 |
| 1975 | 9,801 | 119,693 | 119,425 | 268 | 12.2 | 12.2 | 0.0 | 1.74 |
| 1976 | 9,818 | 121,034 | 118,641 | 2,393 | 12.3 | 12.1 | 0.2 | 1.73 |
| 1977 | 9,830 | 121,852 | 112,672 | 9,180 | 12.4 | 11.5 | 0.9 | 1.71 |
| 1978 | 9,840 | 122,592 | 115,388 | 7,204 | 12.5 | 11.7 | 0.7 | 1.69 |
| 1979 | 9,848 | 123,825 | 112,010 | 11,815 | 12.6 | 11.4 | 1.2 | 1.69 |
| 1980 | 9,849 | 124,398 | 113,699 | 10,699 | 12.6 | 11.5 | 1.1 | 1.67 |
| 1981 | 9,859 | 123,792 | 112,326 | 11,466 | 12.6 | 11.4 | 1.2 | 1.67 |
| 1982 | 9,856 | 120,231 | 111,871 | 8,360 | 12.2 | 11.4 | 0.8 | 1.61 |
| 1983 | 9,856 | 117,145 | 114,534 | 2,611 | 11.9 | 11.6 | 0.3 | 1.56 |
| 1984 | 9,855 | 115,715 | 109,658 | 6,057 | 11.7 | 11.1 | 0.6 | 1.59 |
| 1985 | 9,858 | 114,030 | 110,770 | 3,260 | 11.6 | 11.2 | 0.3 | 1.49 |
| 1986 | 9,862 | 117,102 | 111,343 | 5,759 | 11.9 | 11.3 | 0.6 | 1.54 |
| 1987 | 9,870 | 117,334 | 105,426 | 11,908 | 11.9 | 10.7 | 1.2 | 1.55 |
| 1988 | 9,902 | 119,456 | 104,552 | 14,904 | 12.1 | 10.6 | 1.5 | 1.56 |
| 1989 | 9,938 | 121,117 | 107,619 | 13,498 | 12.2 | 10.8 | 1.4 | 1.57 |
| 1990 | 9,967 | 123,726 | 104,818 | 18,908 | 12.4 | 10.5 | 1.9 | 1.62 |
| 1991 | 10,004 | 126,068 | 105,150 | 20,918 | 12.6 | 10.5 | 2.1 | 1.57 |
| 1992 | 10,045 | 124,774 | 104,200 | 20,574 | 12.4 | 10.4 | 2.0 | 1.56 |
| 1993 | 10,084 | 120,998 | 108,170 | 12,828 | 12.0 | 10.7 | 1.3 | 1.61 |
| 1994 | 10,116 | 116,449 | 104,894 | 11,555 | 11.5 | 10.4 | 1.1 | 1.55 |
| 1995 | 10,137 | 115,638 | 105,933 | 9,705 | 11.4 | 10.5 | 1.0 | 1.57 |
| 1996 | 10,157 | 115,214 | 104,140 | 11,074 | 11.3 | 10.3 | 1.1 | 1.55 |
| 1997 | 10,181 | 115,864 | 103,802 | 12,062 | 11.4 | 10.2 | 1.2 | 1.60 |
| 1998 | 10,203 | 114,276 | 104,583 | 9,693 | 11.2 | 10.3 | 1.0 | 1.59 |
| 1999 | 10,226 | 113,469 | 104,904 | 8,565 | 11.1 | 10.3 | 0.8 | 1.62 |
| 2000 | 10,251 | 114,883 | 104,903 | 9,980 | 11.2 | 10.2 | 1.0 | 1.67 |
| 2001 | 10,278 | 114,172 | 103,447 | 10,725 | 11.1 | 10.1 | 1.0 | 1.66 |
| 2002 | 10,333 | 111,225 | 105,642 | 5,583 | 10.8 | 10.2 | 0.5 | 1.66 |
| 2003 | 10,376 | 112,149 | 107,039 | 5,110 | 10.8 | 10.3 | 0.5 | 1.63 |
| 2004 | 10,421 | 115,618 | 101,946 | 13,672 | 11.1 | 9.8 | 1.3 | 1.71 |
| 2005 | 10,479 | 118,002 | 103,278 | 14,724 | 11.3 | 9.9 | 1.4 | 1.75 |
| 2006 | 10,548 | 121,382 | 101,587 | 19,795 | 11.5 | 9.6 | 1.9 | 1.79 |
| 2007 | 10,626 | 120,663 | 100,658 | 20,005 | 11.4 | 9.5 | 1.9 | 1.78 |
| 2008 | 10,710 | 128,049 | 104,587 | 23,462 | 12.0 | 9.8 | 2.2 | 1.86 |
| 2009 | 10,796 | 127,297 | 104,509 | 22,788 | 11.8 | 9.7 | 2.1 | 1.85 |
| 2010 | 10,840 | 130,100 | 105,152 | 24,948 | 11.9 | 9.6 | 2.3 | 1.86 |
| 2011 | 10,951 | 128,678 | 104,247 | 24,431 | 11.6 | 9.5 | 2.1 | 1.81 |
| 2012 | 11,035 | 128,051 | 109,076 | 18,975 | 11.5 | 9.9 | 1.6 | 1.79 |
| 2013 | 11,099 | 125,606 | 109,334 | 16,272 | 11.2 | 9.8 | 1.4 | 1.75 |
| 2014 | 11,150 | 125,014 | 104,755 | 20,259 | 11.1 | 9.3 | 1.8 | 1.73 |
| 2015 | 11,209 | 122,274 | 110,541 | 11,733 | 10.9 | 9.8 | 1.1 | 1.68 |
Infant mortality rate
4.8 in 2010
3.4 in 2011
Total fertility rate
The total fertility rate (TFR) gradually increased during the last decade from 1.60 in 1997, 1.65 in 2002 and 1.82 in 2007. The rates in Brussels are higher than the national average (1.79 in 1997, 1.93 in 2002 and 2.09 in 2007), while they are below the average in Flanders (1.54 in 1997, 1.56 in 2002 and 1.77 in 2007), due to the higher percentage of non-European immigrants with higher birth rates in Brussels.
Life expectancy
Male: 74.4 in 1999, 77.2 in 2009
Female: 80.9 in 1999, 82.4 in 2009
Total: 77.7 in 1999, 79.8 in 2009
Ethnic groups
The country is populated by a Flemish majority of about 6,400,000 people speaking Dutch, a Walloon minority of 4,100,000 people speaking French, as well as 73,000 German speaking people in Wallonia, near the German border. However, David Levinson reports that "the Flemish and Walloon groups are described by experts as "communities" rather than as ethnic groups, and individuals can move easily from one community to the other by learning to speak the other language".[5]
The largest group of immigrants and their descendants in Belgium are Italians, with more than 450,000[2] people, which is well over 4% of Belgium's total population. The Moroccans are the third-largest group, and the largest Muslim ethnic group, numbering 220,000.[2][6]
The rest consists mostly of French-speaking people from Brussels, Turks, Dutch, French, Portuguese, Spaniards, Greeks, Bosniaks, Algerians, Congolese, Vietnamese, Poles, Indians, and Guineans (around 23% of Belgium's population is of non-Belgian origin)[7]
The exact number of French-speakers in Brussels is hard to determine, but it is estimated that 80% of the people living in Brussels use French and 20% use Dutch in their households, as the sole language or secondary language, while Arabic is also largely spoken. See the Brussels article for more details.
Languages
Belgium's three official languages are Dutch, spoken by 59% of the population, French, spoken by 40%, and German, spoken by less than 1%. The vast majority of Belgium's population, 99%, is literate as defined by the Belgian government, i.e. capable of reading and writing in an official language by the time a citizen has reached the age of 15.
Religion
Most, 58% of Belgians, are nominally Roman Catholic. Muslims, other Christians and other minority religions comprise 14% of the population. 27% are agnostic, atheist or other non-believer.[8]
CIA World Factbook demographic statistics
The following demographic statistics are from the CIA World Factbook, unless otherwise indicated.
Population
- 10,449,361 (July 2014 est.)
Age structure
Age structure:
- 0-14 years: 15.6% (male 830,980/female 797,624)
- 15-24 years: 11.7% (male 624,486/female 598,904)
- 25-54 years: 40.4% (male 2,131,869/female 2,086,212)
- 55-64 years: 13.3% (male 690,395/female 704,284)
- 65 years and over: 19% (male 836,685/female 1,147,922) (2014 est.)
0–14 years: 16.1% (male 857,373/female 822,303)
15–64 years: 66.3% (male 3,480,072/female 3,419,721)
65 years and over: 17.6% (male 760,390/female 1,047,477) (2009 est.)
Median age
- Total: 43.1 years
- Male: 41.7 years
- Female: 44.4 years (2014 est.)
Population growth rate
- 0.05% (2014 est.)
Birth rate
- 11,9 births/1,000 population (2014 est.)
Death rate
10.76 deaths/1,000 population (2014 est.)
Net migration rate
- 1.22 migrant(s)/1,000 population (2014 est.)
Sex ratio
- At birth: 1.05 male(s)/female
- 0-14 years: 1.04 male(s)/female
- 15-24 years: 1.04 male(s)/female
- 25-54 years: 1.02 male(s)/female
- 55-64 years: 0.96 male(s)/female
- 65 years and over: 0.72 male(s)/female
- Total population: 0.96 male(s)/female (2014 est.)
At birth: 1.04 male(s)/female
Under 15 years: 1.04 male(s)/female
15–64 years: 1.02 male(s)/female
65 years and over: 0.71 male(s)/female
Total population: 0.96 male(s)/female (2009 est.)

Life expectancy at birth
- Total population: 79.92 years
- Male: 76.76 years
- Female: 83.22 years (2014 est.)
Literacy
Definition: age 15 and over can read and write (2003 est.)
Total population: 99%
Male: 99%
Female: 99%
Education expenditures
6.6% of total GDP (2010)
- country comparison to the world: 30
Nationality
noun: Belgian(s)
adjective: Belgian
See also
References
![]() This article incorporates public domain material from the CIA World Factbook document "2008 edition".
This article incorporates public domain material from the CIA World Factbook document "2008 edition".
- ↑ Nationaal Instituut voor Statistiek
- 1 2 3 http://www.npdata.be/BuG/155-Vreemde-afkomst/Vreemde-afkomst.htm
- 1 2 http://www.npdata.be/BuG/159-Verkiezingen-2012/Verkiezingen-2012.htm
- ↑ L'IMMIGRATION EN BELGIQUE. EFFECTIFS, MOUVEMENTS. ET MARCHE DU TRAVAIL. Rapport 2009. Direction générale Emploi et marché du travai
- ↑ Levinson, David (1998). Ethnic Groups Worldwide: A Ready Reference Handbook. Phoenix, AZ: Oryx Press. p. 14. ISBN 1-57356-019-7.
- ↑ Voor het eerst meer Marokkaanse dan Italiaanse migranten, hbvl.be, 21 May 2007
- ↑ http://www.npdata.be/BuG/125-Vreemde-afkomst/
- ↑ http://ec.europa.eu/public_opinion/archives/ebs/ebs_393_en.pdf
Bold denotes ethnic groups that (partly) originate from within contemporary and historic parts of the Belgium |