Ichimoku Kinkō Hyō

Ichimoku Kinko Hyo (一目均衡表 Ichimoku Kinkō Hyō) usually just called ichimoku is a technical analysis method that builds on candlestick charting to improve the accuracy of forecast price moves.[1] It was developed in the late 1930s by Goichi Hosoda (細田悟一 Hosoda Goichi), a Japanese journalist who used to be known as Ichimoku Sanjin, which can be translated as "what a man in the mountain sees". He spent 30 years perfecting the technique before releasing his findings to the general public in the late 1960s.[2]
Ichimoku Kinko Hyo translates to one glance equilibrium chart or instant look at the balance chart and is sometimes referred to as "one glance cloud chart" based on the unique "clouds" that feature in ichimoku charting.[3][4]
Ichimoku is a moving average-based trend identification system and because it contains more data points than standard candlestick charts, it provides a clearer picture of potential price action.[5] The main difference between how moving averages are plotted in ichimoku as opposed to other methods is that ichimoku's lines are constructed using the 50% point of the highs and lows as opposed to the candle's closing price.
Ichimoku factors in time as an additional element along with the price action, similar to William Delbert Gann's trading ideas.
In the Western World is solely known for its “Graphic Environment” due to the authors that have translated the original manual into English, German nor Spanish. However Ichimoku is also integrated by three other theories that improves and enhances the indicator:
Time Theory [6]
Wave Movement Theory [7]
Target Price Theory [8]
The key elements of Ichimoku's Graphic Environment
Tenkan-sen
Tenkan-sen (転換線) calculation: (highest high + lowest low)/2 for the last 9 periods.
It is primarily used as a signal line and a minor support/resistance line.Tenkan Sen (red line): This is also known as the turning line and is derived by averaging the highest high and the lowest low for the past nine periods. The Tenkan Sen is an indicator of the market trend. If the red line is moving up or down, it indicates that the market is trending. If it moves horizontally, it signals that the market is ranging.
Kijun-sen
Kijun-sen (基準線) calculation: (highest high + lowest low)/2 for the past 26 periods.
This is a confirmation line, a support/resistance line, and can be used as a trailing stop line. The Kijun Sen acts as an indicator of future price movement. If the price is higher than the blue line, it could continue to climb higher. If the price is below the blue line, it could keep dropping.
Senkou span A
Senkou (先行) span A calculation: (Tenkan-sen + kijun-sen)/2 plotted 26 periods ahead.
Also called leading span 1, this line forms one edge of the kumo, or cloud
If the price is above the Senkou span, the top line serves as the first support level while the bottom line serves as the second support level.
If the price is below the Senkou span, the bottom line forms the first resistance level while the top line is the second resistance level.
Senkou span B
Senkou span B calculation: (highest high + lowest low)/2 calculated over the past 52 time periods and plotted 26 periods ahead.
Also called leading span 2, this line forms the other edge of the kumo.
Kumo
Kumo (雲, cloud) is the space between senkou span A and B. The cloud edges identify current and potential future support and resistance points.
The Kumo cloud changes in shape and height based on price changes. This height represents volatility as larger price movements form thicker clouds, which creates a stronger support and resistance. As thinner clouds offer only weak support and resistance, prices can and tend to break through such thin clouds.
Generally, markets are bullish when Senkou Span A is above Senkou Span B and vice versa when markets are bearish. Traders often look for Kumo Twists in future clouds, where Senkou Span A and B exchange positions, a signal of potential trend reversals.
In addition to thickness, the strength of the cloud can also be ascertained by its angle; upwards for bullish and downwards for bearish. Any clouds behind price are also known as Kumo Shadows.
Chikou span
Chikou (遅行) span calculation: today's closing price projected back 26 days on the chart.
Also called the lagging span it is used as a support/resistance aid.
If the Chikou Span or the green line crosses the price in the bottom-up direction, that is a buy signal. If the green line crosses the price from the top-down, that is a sell signal.
The key elements of Ichimoku's Time Theory
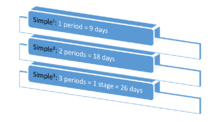
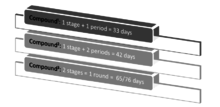
Goichi Hosoda also developed the time theory by differentiating 3 time ranges and two different levels: Simple and compound.
Numerical values
Simple ranges
Compound ranges
Equality in the numerical values or Taitou-Suchi
Hen-Gi: Using a numerical value that happened before and applying it from another
Jyu-Gi: Proposing a numerical value that happened before and applying it from a point between the time range
The key elements of Ichimoku's Wave Movement Theory
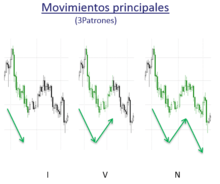
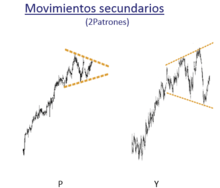
Hosoda knew about Elliot’s wave principle but his renderings about it were not as complex as Elliot’s. Goichi opted for a simpler version which is focused on pattern detection. Those patterns allowed him to monitor any trend structure but not to define clear target levels or take profits. He classified two main movements:
Primary movements
Secondary movements
The key elements of Ichimoku's Price Theory
In order to define target levels, Ichimoku uses 4 different ways to calculate them.
Value NT: just in case of minor corrections
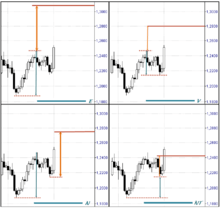
Those target prices left us a range at 1,2750 –1,2800 which is invalid to set as a possible target. This invalid level match with the range between Values V & N.
References
- ↑ "Ichimoku complementing candlestick chart" section of the page "Ichimoku cloud". ForexAbode.com.
- ↑ Kumotrader Ichimoku Wiki
- ↑ "The History of Ichimoku 1968 - Present Day". ichi-mo-ku.com. Archived from the original on 22 June 2012. Retrieved 13 May 2013.
- ↑ Ichimoku Chinkou Cross
- ↑ Ichimoku Cloud Filters Information Storm
- ↑ "Ichimoku Time Theory" section of the page "Ichimoku TimeTheory". Ichimoku.com.
- ↑ "Ichimoku Wave Movement Theory" section of the page "Ichimoku TimeTheory". Ichimoku.com.
- ↑ "Ichimoku Price Theory" section of the page "Ichimoku TimeTheory". Ichimoku.com.