Latin Americans
| Total population | |
|---|---|
|
(650,000,000 or more (in 2013)[1]) | |
| Regions with significant populations | |
| Latin America: 561,183,291[2] | |
| 201,032,714[3] | |
| 114,975,406[4] | |
| 48,400,368[5] | |
| 42,192,494[6] | |
| 33,221,865[7] | |
| 29,549,517[8] | |
| 17,067,369[9] | |
| 15,223,680[10] | |
| 14,099,032[11] | |
| 11,075,244[12] | |
| 10,290,003[13] | |
| 10,088,598[14] | |
| 9,801,664[15] | |
| 8,296,693[16] | |
| 6,541,590[17] | |
| 6,090,646[18] | |
| 5,727,707[19] | |
| 4,636,340[20] | |
| 3,690,923[21] | |
| 3,510,045[22] | |
| 3,316,328[23] | |
| +50,000,000[24][25] | |
| +1,700,000[26] | |
| 544,380[27] | |
| +345,000[28] | |
| 186,500[29] | |
| ~100,000[30] | |
| 93,795[31] | |
| Languages | |
|
Primarily Spanish and Portuguese. Regionally Quechua, Mayan languages, Guaraní, Aymara, Nahuatl, French and others | |
| Religion | |
|
Predominantly Roman Catholic Christianity. Other significant minorities. | |
Latin Americans (Spanish: latinoamericanos, Portuguese: latino-americanos) are the citizens of the Latin American countries and dependencies. Latin American countries are multi-ethnic, home to people of different ethnic and national backgrounds. As a result, some Latin Americans don't take their nationality as an ethnicity, but identify themselves with both their nationality and their ancestral origins.[32] Aside from the indigenous Amerindian (aka Native American) population, all Latin Americans or their ancestors immigrated within the past five centuries. Latin America has the largest diasporas of Spaniards, Portuguese, Black Africans, Italians, Arabs, and Japanese in the world.
The specific ethnic and/or racial composition varies from country to country: many have a predominance of European-Amerindian, or Mestizo, population; in others, Amerindians are a majority; some are mostly inhabited by people of European ancestry; and others are primarily Mulatto.[33] Various Black, Asian, and Zambo (mixed Black and Amerindian) minorities are also identified in most countries.[33] White Latin Americans are the largest single group.[32] Together with the people of part-European ancestry they combine for approximately 80% of the population,[34] or even more.[32]
Latin Americans and their descendants can be found almost everywhere in the world, particularly in densely populated urban areas. The most important migratory destinations for Latin Americans are found in the United States, Spain, Canada, and Japan.
Definition

Latin America (Spanish: América Latina or Latinoamérica; Portuguese: América Latina; French: Amérique latine) is the region of the Americas where Romance languages (i.e., those derived from Latin—particularly Spanish and Portuguese, and variably French—are primarily spoken.[35][36]
It includes more than 20 nations: Mexico in North America; Guatemala, Honduras, El Salvador, Nicaragua, Costa Rica and Panama in Central America; Colombia, Venezuela, Ecuador, Peru, Bolivia, Chile, French Guyana, Paraguay, Brazil, Argentina and Uruguay in South America; Cuba, the Dominican Republic, Haiti, and Puerto Rico in the Caribbean—in summary, Hispanic America, Brazil, and Haiti.
If we consider this definition strictly, we should consider Canada and in particular Quebec as part of Latin America. The reason behind this is that Canada has French as one of its official languages along with English, and in particular Quebec, which is the only Canadian province with a predominantly French-speaking population and the only one whose sole official language is French at the provincial level. But this region is rarely considered so, since its history, distinctive culture and economy, and British-inspired political institutions are generally deemed too closely intertwined with the rest of Canada.[37]
Latin America, therefore, can be defined as all those parts of the Americas that were once part of the French, Spanish, or Portuguese Empires.[38]
Demographics
Ethnic groups


.jpg)
.jpg)


The population of Latin America comprises a variety of ancestries, ethnic groups, and races, making the region one of the most diverse in the world. The specific composition varies from country to country: many have a predominance of European-Native American, or Mestizo, population; in others, Native American are a majority; some are dominated by inhabitants of European ancestry; and some countries' populations are primarily Mulatto. Black, Asian, and Zambo (mixed Black and Native American) minorities are also identified regularly. White people are the largest single group, accounting for more than a third.[32][34]
- Native American. The indigenous population of Latin America, the Native Americans, arrived during the Lithic stage. In post-Columbian times they experienced tremendous population decline, particularly in the early decades of colonization. They have since recovered in numbers, surpassing sixty million (by some estimates[34]), though with the growth of the other groups meanwhile, they now compose a majority only in Bolivia and Peru. In Guatemala, Native American are a large minority that comprises two-fifths of the population. Mexico's 14%[32] (9.8% in the official 2005 census) is the next largest ratio, and one of the largest Amerindian population in the Americas in absolute numbers. Most of the remaining countries have Native American minorities, in every case making up less than one-tenth of the respective country's population. In many countries, people of mixed Native American and European ancestry make up the majority of the population (see Mestizo).
- Asians. People of Asian descent number several million in Latin America. The first Asians to settle in the region were Filipino, as a result of Spain's trade involving Asia and the Americas. The majority of Asian Latin Americans are of Japanese or Chinese ancestry and reside mainly in Brazil and Peru; there is also a growing Chinese minority in Panama. Brazil is home to perhaps two million people of Asian descent, which includes the largest ethnic Japanese community outside Japan itself, estimated as high as 1.5 million, and circa 200,000 ethnic Chinese and 100,000 ethnic Koreans.[39][40] Ethnic Koreans also number tens of thousands of individuals in Argentina and Mexico.[41] Peru, with 1.47 million people of Asian descent,[42][43] has one of the largest Chinese communities in the world, with nearly one million Peruvians being of Chinese ancestry. There is a strong ethnic-Japanese presence in Peru, where a past president and a number of politicians are of Japanese descent. The Martiniquais population includes an African-White-Indian mixed population, and an East Indian (Asian Indian) population.[44] The Guadeloupean East Indian population is estimated at 14% of the population.
- Blacks. Millions of African slaves were brought to Latin America from the 16th century onward, the majority of whom were sent to the Caribbean region and Brazil. Today, people identified as "Black" are most numerous in Brazil (more than 10 million) and in Haiti (more than 7 million).[45] Among the Hispanic nations and Brazil, Puerto Rico leads this category in relative numbers, with a 15% ratio. Significant populations are also found in Cuba, Dominican Republic, Ecuador, Panama, and Colombia. Latin Americans of mixed Black and White ancestry, called Mulattoes, are far more numerous than Blacks.
- Mestizos. Intermixing between Europeans and Native Americans began early in the colonial period and was extensive. The resulting people, known as Mestizos, make up the majority of the population in half of the countries of Latin America. Additionally, Mestizos compose large minorities in nearly all the other mainland countries.
- Mulattoes. Mulattoes are people of mixed European and African ancestry, mostly descended from Spanish or Portuguese settlers on one side and African slaves on the other, during the colonial period. Brazil is home to Latin America's largest mulatto population. Mulattoes form a majority in the Spanish-speaking Caribbean places which are the Dominican Republic, Puerto Rico and depending on source, Cuba as well, and are also numerous in Nicaragua, Costa Rica, Panama, Peru, Colombia, and Ecuador. Smaller populations of mulattoes are found in other Latin American countries.[34]
- Whites. Beginning in the late 15th century, large numbers[32] of Iberian colonists settled in what became Latin America (Portuguese in Brazil and Spaniards elsewhere in the region), and at present most white Latin Americans are of Spanish or Portuguese origin. Iberians brought the Spanish and Portuguese languages, the Catholic faith, and many Iberian traditions. Brazil, Argentina and Mexico contain the largest numbers of whites in Latin America in pure numbers.[32] Whites make up the majorities of Argentina, Costa Rica, and Uruguay, also, whites make up roughly half of Brazil and Chile's population as well.[32][46] Of the millions of immigrants since most of Latin America gained independence in the 1810s–1820s, Italians formed the largest group, and next were Spaniards and Portuguese.[47] Many others arrived, such as French, Germans, Greeks, Poles, Ukrainians, Russians, Estonians, Latvians, Jews, Irish and Welsh. Also included are Middle Easterners of Lebanese, Syrian, and Palestinian descent; Most of them are Christian.[48] Whites presently compose the largest racial group in Latin America (36% in the table herein), and, whether as White, Mestizo, or Mulatto, the vast majority of Latin Americans have white ancestry.[49]
- Zambos: Intermixing between Africans and Native Americans was especially prevalent in Colombia and Brazil, often due to slaves's running away (becoming cimarrones: maroons) and being taken in by Amerindian villagers. In Spanish speaking nations, people of this mixed ancestry are known as Zambos[50] or (in Middle America), and Cafuzos in Brazil.
- Multi-ethnic/Multi-racials: In addition to the foregoing groups, Latin America also has millions of multiracial peoples (Triracial/Quadracial) of mixed European, Middle Eastern, African, Native American (Indigenous), and Asian (Japanese, Chinese, Filipino and Indian) ancestry. Most are found in Colombia, Puerto Rico, and Brazil, with a much smaller presence in other countries and parts of Mexico. In Brazil they are called Pardos. This intermixing inspired Mexican philosopher José Vasconcelos to publish an essay in 1925 titled "La Raza Cósmica"(The Cosmic Race). The essay expressed the ideology of a future "fifth race" in the Americas; an agglomeration of all the races in the world with no respect to color or number to erect a new civilization: Universópolis. Genetic studies have shown results of various degrees of admixture between various ethnic groups that has taken place throughout Latin America since the arrival of Spanish European explorers in 1492.
| Country | Population[2] | Native American | Whites | Mestizos | Mulattoes | Blacks | Zambos | Asians |
|---|---|---|---|---|---|---|---|---|
| |
40,134,425 | 1.0% | 85.0% | 11.1% | 0.0% | 0.0% | 0.0% | 2.9% |
| |
10,907,778 | 55.0% | 15.0% | 28.0% | 2.0% | 0.0% | 0.0% | 0.0% |
| |
192,272,890 | 0.4% | 47.7% | 19.4% | 19.1% | 6.2% | 0.0% | 1.1% [51] |
| |
17,063,000 | 3.0% | 53.0% | 44.0% | 0.0% | 0.0% | 0.0% | 0.0% |
| |
48,219,645 | 1.8% | 37.0% | 49.0% | 21.0% | 3.9% | 0.1% | 0.0% |
| |
4,253,897 | 0.8% | 82.0% | 15.0% | 0.0% | 0.0% | 2.0% | 0.2% |
| |
11,236,444 | 0.0% | 65.0% | 0.0% | 13.0%' | 11.0% | 0.0% | 1.0% |
| |
8,562,541 | 0.0% | 14.6% | 0.0% | 75.0% | 7.7% | 2.3% | 0.4% |
| |
13,625,000 | 39.0% | 9.9% | 41.0% | 5.0% | 5.0% | 0.0% | 0.1% |
| |
6,134,000 | 1.0% | 12.0% | 86.0% | 0.0% | 0.0% | 0.0% | 0.0% |
| |
13,276,517 | 39.8% | 18.5% | 41.9% | 0.0% | 0.0% | 0.2% | 0.8% |
| |
7,810,848 | 7.7% | 1.0% | 85.6% | 1.7% | 0.0% | 3.3% | 0.7% |
| |
112,322,757 | 14% | 15% | 70% | 0.5% | 0.0% | 0.0% | 0.5% |
| |
5,891,199 | 5% | 17% | 69% | 6% | 3% | 0.6% | 0.2% |
| |
3,322,576 | 8.0% | 10.0% | 32.0% | 27.0% | 5.0% | 14.0% | 4.0% |
| |
6,349,000 | 1.5% | 3.5% | 90.5% | 3.5% | 0.0% | 0.0% | 0.5% |
| |
29,461,933 | 45.5% | 12.0% | 32.0% | 9.7% | 0.0% | 0.0% | 0.8% |
| |
3,967,179 | 0.0% | 74.8% | 0.0% | 10.0% | 15.0% | 0.0% | 0.2% |
| |
3,494,382 | 0.0% | 88.0% | 8.0% | 4.0% | 0.0% | 0.0% | 0.0% |
| |
33,221,865 | 2.7% | 42.2% | 42.9% | 0.7% | 2.8% | 0.0% | 2.2% |
| Total | 561,183,291 | 9.2% | 36.1% | 30.3% | 20.3% | 3.2% | 0.2% | 0.7% |
Note: Puerto Rico is a territory of the United States.
Ethnic groups according to self-identification
The Latinobarómetro surveys have asked respondents in 18 Latin American countries what race they considered themselves to belong to. The figures shown below are averages for 2007 through 2011.[52]
| Country | Mestizo | White | Mulatto | Black | Amerindian | Asian | Other | DK/NR1 |
|---|---|---|---|---|---|---|---|---|
| | 15% | 73% | 1% | 1% | 1% | 0% | 3% | 7% |
| | 40% | 6% | 1% | 0% | 47% | 0% | 1% | 4% |
| | 18% | 45% | 15% | 15% | 2% | 2% | 0% | 2% |
| | 26% | 60% | 0% | 0% | 7% | 1% | 1% | 5% |
| | 43% | 29% | 5% | 7% | 5% | 0% | 1% | 9% |
| | 16% | 66% | 9% | 2% | 3% | 1% | 1% | 5% |
| | 28% | 16% | 23% | 25% | 5% | 2% | 0% | 2% |
| | 78% | 5% | 3% | 3% | 7% | 1% | 0% | 3% |
| | 62% | 14% | 3% | 2% | 5% | 1% | 2% | 11% |
| | 29% | 17% | 2% | 1% | 44% | 1% | 2% | 6% |
| | 61% | 9% | 3% | 3% | 12% | 2% | 1% | 10% |
| | 60% | 15% | 2% | 0% | 15% | 1% | 3% | 4% |
| | 54% | 19% | 3% | 4% | 7% | 1% | 1% | 11% |
| | 55% | 15% | 5% | 11% | 5% | 4% | 1% | 4% |
| | 36% | 35% | 1% | 1% | 2% | 0% | 4% | 20% |
| | 72% | 12% | 2% | 1% | 7% | 0% | 1% | 5% |
| | 6% | 80% | 3% | 2% | 1% | 0% | 2% | 6% |
| | 45% | 33% | 5% | 7% | 4% | 1% | 0% | 5% |
| Weighted average2 | 34% | 33% | 8% | 6% | 11% | 0% | 2% | 7% |
1 Don't know/No response.
2 Weighted using 2011 population.
Language
Spanish and Portuguese are the predominant languages of Latin America. Portuguese is spoken only in Brazil, the biggest and most populous country in the region. Spanish is the official language of most of the rest of the countries on the Latin American mainland, as well as in Puerto Rico (where it is co-official with English), Cuba and the Dominican Republic. French is spoken in some Caribbean islands, including Guadeloupe, Martinique, and Haiti, as well as in the overseas departments of French Guiana (South America). Dutch is the official language of some Caribbean islands and in Suriname on the continent; however, as Dutch is a Germanic language, these territories are not considered part of Latin America.
Native American languages are widely spoken in Peru, Guatemala, Bolivia, Paraguay, and to a lesser degree, in Mexico, Chile and Ecuador. In Latin American countries not named above, the population of speakers of indigenous languages is small or non-existent.
In Peru, Quechua is an official language, alongside Spanish and any other indigenous language in the areas where they predominate. In Ecuador, while holding no official status, the closely related Quichua is a recognized language of the indigenous people under the country's constitution; however, it is only spoken by a few groups in the country's highlands. In Bolivia, Aymara, Quechua and Guaraní hold official status alongside Spanish. Guarani is, along with Spanish, an official language of Paraguay, and is spoken by a majority of the population (who are, for the most part, bilingual), and it is co-official with Spanish in the Argentine province of Corrientes. In Nicaragua, Spanish is the official language, but on the country's Caribbean coast English and indigenous languages such as Miskito, Sumo, and Rama also hold official status. Colombia recognizes all indigenous languages spoken within its territory as official, though fewer than 1% of its population are native speakers of these. Nahuatl is one of the 62 native languages spoken by indigenous people in Mexico, which are officially recognized by the government as "national languages" along with Spanish.
Other European languages spoken in Latin America include: English, by some groups in Argentina, Costa Rica, Nicaragua, Panama, and Puerto Rico, as well as in nearby countries that may or may not be considered Latin American, like Belize and Guyana (English is used as a major foreign language in Latin American commerce and education); German, in southern Brazil, southern Chile, Argentina, portions of northern Venezuela, and Paraguay; Italian, in Brazil, Argentina, Uruguay, and Venezuela; and Welsh,[53][54][55][56][57][58] in southern Argentina.
In several nations, especially in the Caribbean region, creole languages are spoken. The most widely spoken creole language in the Caribbean and Latin America in general is Haitian Creole, the predominant language of Haiti; it is derived primarily from French and certain West African tongues with Amerindian, English, Portuguese and Spanish influences as well. Creole languages of mainland Latin America, similarly, are derived from European languages and various African tongues.
Religion
The vast majority of Latin Americans are Christians (90%),[59] mostly Roman Catholics.[60] About 71% of the Latin American population consider themselves Catholic.[61] Membership in Protestant denominations is increasing, particularly in Brazil, Guatemala, and Puerto Rico. Argentina hosts the largest communities of both Jews[62][63][64] and Muslims[65][66][67] in Latin America.
Migration
Due to economic, social and security developments that are affecting the region in recent decades, a change has taken place from net immigration to net emigration. About 10 million Mexicans live in the United States.[68] 28.3 million Americans listed their ancestry as Mexican as of 2006.[69] According to the 2005 Colombian census or DANE, about 3,331,107 Colombians currently live abroad.[70] The number of Brazilians living overseas is estimated at about 2 million people.[71] An estimated 1.5 to two million Salvadorians reside in the United States.[72] At least 1.5 million Ecuadorians have gone abroad, mainly to the United States and Spain.[73] Approximately 1.5 million Dominicans live abroad, mostly in the US.[74] More than 1.3 million Cubans live abroad, most of them in the US.[75] It is estimated that over 800,000 Chileans live abroad, mainly in Argentina, Canada, United States and Spain. Other Chilean nationals may be located in countries like Costa Rica, Mexico and Sweden.[76] An estimated 700,000 Bolivians were living in Argentina as of 2006 and another 33,000 in the United States.[77] Central Americans living abroad in 2005 were 3,314,300,[78] of which 1,128,701 were Salvadorans,[79] 685,713 were Guatemalans,[80] 683,520 were Nicaraguans,[81] 414,955 were Hondurans,[82] 215,240 were Panamanians,[83] 127,061 were Costa Ricans[84] and 59,110 were Belizeans.
As of 2006, Costa Rica and Chile were the only two countries with global positive migration rates.[85]
Gallery
.jpg)

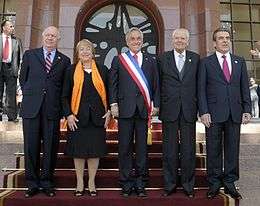 Past Presidents of Chile.
..jpg) Haitian schoolgirls
Haitian schoolgirls Native Emberá child from Panama.
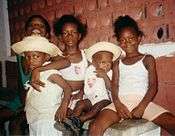 Garifuna children in Livingston, Guatemala.
.jpg) German Venezuelans celebrate Oktoberfest in the Colonia Tovar.
German Venezuelans celebrate Oktoberfest in the Colonia Tovar. Representation of a Mestizo in an 18th-century Pintura de Castas by José Joaquín Magón.
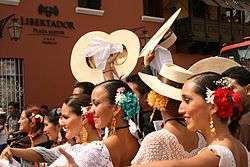
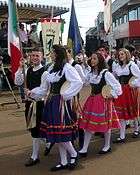
 Arab Argentine folkloric dancers.
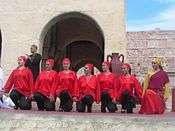
 Guatemalan Maya girls in traditional dress.
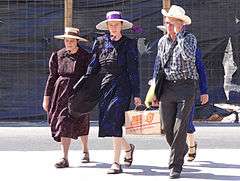
 Chinese Mexican restaurant owner from Mexicali.
 Italian Argentine youths- about 50% of Argentina's population has Italian ancestry.
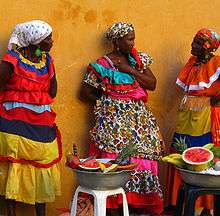
.jpg) Woman offering a cup of Colombian coffee.
Woman offering a cup of Colombian coffee. 16th century depiction of Zambo Caciques in Esmeraldas, Ecuador by Adrián Sánchez Galque.
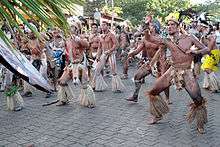 Rapa Nui dancers from Easter Island, Chile.
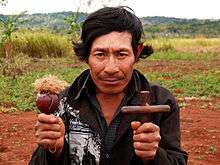 Guaraní shaman from Paraguay
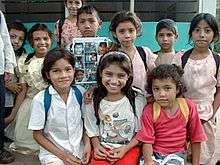
 Salvadoran schoolchildren in Metapán.
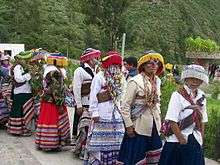
 Indigenous Peruvian women at the celebrations of Inti Raymi.
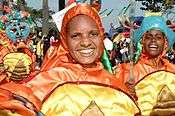 Carnival in the Dominican Republic.
 Bolivian boys from Tarata.
 Venezuelan dancers of La Guasa
 Big family in Uruguay.
 Native Yaqui of Northwest Mexico performing the Deer Dance.
 Nicaraguan women in Managua.
.jpg) Brazilian football fans.
Brazilian football fans.
Notable Latin Americans
See also
- History of Latin America
- Culture of Latin America
- Latinos
- Latins
- Miami
- Dekasegi
- Argentines
- Bolivians
- Brazilians
- Californios
- Chileans
- Colombians
- Costa Ricans
- Cubans
- Dominicans
- Ecuadorians
- Guatemalans
- Haitians
- Hondurans
- Mexicans
- Neomexicanos
- Nuyoricans
- Nicaraguans
- Panamanians
- Paraguayans
- Peruvians
- Puerto Ricans
- Salvadorans
- Tejanos
- Uruguayans
- Venezuelans
References
- ↑ Based on recent estimates, as of 2010. Sources by country: Argentina "Proyecciones provinciales de población por sexo y grupos de edad 2001–2015" (pdf). Gustavo Pérez (in Spanish). INDEC. p. 16. Retrieved 2008-06-24.; Australia Australian Bureau of Statistics 20680-Ancestry (full classification list) by Sex - Australia; Bolivia "Bolivia". World Gazetteer. Retrieved 2010-01-07.; Brazil Brazil 2009 Estimate IGBE: Instituto Brasileiro de Geografia e Estatística. Retrieved 2 January 2010; Canada 2006 census"Ethnocultural Portrait of Canada Highlight Tables, 2006 Census". Statistics Canada. Retrieved 2008-05-10.; Colombia "Departamento Administrativo Nacional de Estadística". Dane.gov.co. Retrieved 2010-05-16.; Costa Rica "Costa Rica". CIA The World Factbook.; Cuba Anuario Estadístico de Cuba 2008. Edición 2009, Oficina Nacional de Estadísticas, República de Cuba. Accessed on May 19, 2010; Dominican Republic "Presidencia de la República; Generalidades". Retrieved 2009-12-14.; Ecuador Department of Economic and Social Affairs Population Division (2009). "World Population Prospects, Table A.1" (PDF). 2008 revision. United Nations. Retrieved 2009-03-12.; El Salvador"UNdata El Salvador". UN. 2008. Retrieved 2010-07-04.; Guatemala"Demographic Information 2010". INE. 2010. Retrieved 2010-03-23.; Mexico "INEGI Datos oficiales censo de población 2010". INEGI. 2010-06-12. Retrieved 2010-11-27.; Paraguay Department of Economic and Social Affairs Population Division (2009). "World Population Prospects, Table A.1" (PDF). 2008 revision. United Nations. Retrieved 2009-03-12.; Peru Instituto Nacional de Estadística e Informática (INEI) del PerúINEI. Retrieved on June 10, 2010; Portugal POPULAÇÃO ESTRANGEIRA EM TERRITÓRIO NACIONAL, SERVIÇO DE ESTRANGEIROS E FRONTEIRAS 2008; Spain INE, Revisión del Padrón municipal 2007. Datos a nivel nacional, comunidad autónoma y provincia. (Spanish); INE, Notas de Prensa 2008 (Spanish); Uruguay Central Intelligence Agency. "Uruguay". The World Factbook. Retrieved January 5, 2010.; USA (Self-identified ethnicity rather than birthplace) "Detailed Hispanic Origin: 2007" (PDF). Pew Hispanic Center. Retrieved 2009-04-13.; "United States - Selected Population Profile in the United States (Brazilian (360-364))". 2008 American Community Survey 1-Year Estimates. United States Census Bureau. Retrieved 2010-03-16.
- 1 2 3 Based on recent estimates, as of 2010. Sources by country: Argentina "Proyecciones provinciales de población por sexo y grupos de edad 2001–2015" (pdf). Gustavo Pérez (in Spanish). INDEC. p. 16. Retrieved 2008-06-24.; Bolivia "Bolivia". World Gazetteer. Retrieved 2010-01-07.; Brazil Brazil 2009 Estimate IGBE: Instituto Brasileiro de Geografia e Estatística. Retrieved 2 January 2010; Colombia "Departamento Administrativo Nacional de Estadística". Dane.gov.co. Retrieved 2010-05-16.; Costa Rica "Costa Rica". CIA The World Factbook.; Cuba Anuario Estadístico de Cuba 2008. Edición 2009, Oficina Nacional de Estadísticas, República de Cuba. Accessed on May 19, 2010; Dominican Republic "Presidencia de la República; Generalidades". Retrieved 2009-12-14.; Ecuador Department of Economic and Social Affairs Population Division (2009). "World Population Prospects, Table A.1" (PDF). 2008 revision. United Nations. Retrieved 2009-03-12.; El Salvador"UNdata El Salvador". UN. 2008. Retrieved 2010-07-04.; Mexico "CIA - The World Factbook - Mexico". Cia.gov. Retrieved 2009-11-04.; Paraguay Department of Economic and Social Affairs Population Division (2009). "World Population Prospects, Table A.1" (PDF). 2008 revision. United Nations. Retrieved 2009-03-12.; Peru Instituto Nacional de Estadística e Informática (INEI) del PerúINEI. Retrieved on June 10, 2010; Uruguay Central Intelligence Agency. "Uruguay". The World Factbook. Retrieved January 5, 2010.
- ↑ "CIA factbook". Retrieved 2012-11-23.
- ↑ "CIA factbook". Retrieved 2012-11-23.
- ↑ "Animated clock". Government of Colombia. Retrieved 2015-06-10.
- ↑ "CIA factbook". Retrieved 2012-11-23.
- ↑ "CIA factbook". Retrieved 2012-11-23.
- ↑ "CIA factbook". Retrieved 2012-11-23.
- ↑ "CIA factbook". Retrieved 2012-11-23.
- ↑ "CIA factbook". Retrieved 2012-11-23.
- ↑ "CIA factbook". Retrieved 2012-11-23.
- ↑ "CIA factbook". Retrieved 2012-11-23.
- ↑ "CIA factbook". Retrieved 2012-11-23.
- ↑ "CIA factbook". Retrieved 2012-11-23.
- ↑ "CIA factbook". Retrieved 2012-11-23.
- ↑ "CIA factbook". Retrieved 2012-11-23.
- ↑ "CIA factbook". Retrieved 2012-11-23.
- ↑ "CIA factbook". Retrieved 2012-11-23.
- ↑ "CIA factbook". Retrieved 2012-11-23.
- ↑ "CIA factbook". Retrieved 2012-11-23.
- ↑ "CIA factbook". Retrieved 2012-11-23.
- ↑ "CIA factbook". Retrieved 2012-11-23.
- ↑ "CIA factbook". Retrieved 2012-11-23.
- ↑ (Self-identified ethnicity rather than birthplace) "Detailed Hispanic Origin: 2007" (PDF). Pew Hispanic Center. Retrieved 2009-04-13.
- ↑ "United States - Selected Population Profile in the United States (Brazilian (360-364))". 2008 American Community Survey 1-Year Estimates. United States Census Bureau. Retrieved 2010-03-16.
- ↑ Foreign population in Spain (2009), Spanish National Statistics Institute press report, INE (Spain). June 3, 2009. (Spanish)
- ↑ 2006 census"Ethnocultural Portrait of Canada Highlight Tables, 2006 Census". Statistics Canada. Retrieved 2008-05-10.
- ↑ "Registered Foreigners in Japan by Nationality" (PDF). Statistics Bureau. Archived from the original (PDF) on 24 August 2005. Retrieved 7 November 2011.
- ↑ "No Longer Invisible: The Latin American community in London" (PDF). Trust for London. Retrieved 19 May 2011.
- ↑ POPULAÇÃO ESTRANGEIRA EM TERRITÓRIO NACIONAL, SERVIÇO DE ESTRANGEIROS E FRONTEIRAS 2008;
- ↑ "Redirect to Census data page". abs.gov.au. Retrieved 22 September 2015.
- 1 2 3 4 5 6 7 8 9 Lizcano Fernández, Francisco (May–August 2005). "Composición Étnica de las Tres Áreas Culturales del Continente Americano al Comienzo del Siglo XXI" (PDF). Convergencia (in Spanish). Mexico: Universidad Autónoma del Estado de México, Centro de Investigación en Ciencias Sociales y Humanidades. 38: 185–232; table on p. 218. ISSN 1405-1435. Archived from the original (PDF) on 2008-09-20.
- 1 2 "América Latina". . External link in
|publisher=(help) - 1 2 3 4 "CIA — The World Factbook -- Field Listing — Ethnic groups". Retrieved 2008-02-20.
- ↑ Colburn, Forrest D (2002). Latin America at the End of Politics. Princeton University Press. ISBN 0-691-09181-1.
- ↑ "Latin America."The New Oxford Dictionary of English. Pearsall, J., ed. 2001. Oxford, UK: Oxford University Press; p. 1040: "The parts of the American continent where Spanish or Portuguese is the main national language (i.e.Mexico and, in effect, the whole of Central and South America including many of the Caribbeanislands)."
- ↑ Bethell, Leslie (ed.) (1984). The Cambridge History of Latin America. 1. Cambridge: Cambridge University Press. p. xiv. ISBN 978-0-521-23223-4.
- ↑ Rangel, Carlos (1977). The Latin Americans: Their Love-Hate Relationship with the United States. New York: Harcourt Brace Jovanovich. pp. 3–5. ISBN 0-15-148795-2. Skidmore, Thomas E.; Peter H. Smith (2005). Modern Latin America (6 ed.). Oxford and New York: Oxford University Press. pp. 1–10. ISBN 0-19-517013-X.
- ↑ Shoji, Rafael (2004), "Reinterpretação do Budismo Chinês e Coreano no Brasil" (PDF), Revista de Estudos da Religião (Nº 3), pp. 74–87, ISSN 1677-1222, retrieved 2010-06-02
- ↑ "Japan-Brazil Relations". Ministry of Foreign Affairs of Japan. Retrieved 22 September 2015.
- ↑ 재외동포현황/Current Status of Overseas Compatriots, South Korea: Ministry of Foreign Affairs and Trade, 2009, archived from the original on 2010-10-23, retrieved 2009-05-21
- ↑ ":: Overseas Compatriot Affairs Commission, R.O.C. ::". Ocac.gov.tw. 2004-08-24. Archived from the original on 2013-11-23. Retrieved 2010-07-26.
- ↑ "DESAFIOS-QUE-NOS-ACERCAN — Noticias — Universia Perú". Universia.edu.pe. Archived from the original on 2009-04-15. Retrieved 2010-07-26.
- ↑ "The World Factbook". USA: CIA. 2003. Retrieved 2013-09-23.
- ↑ "La trata de negros". La trata de negros. Retrieved 22 September 2015.
- ↑ "Resultado Básico del XIV Censo Nacional de Población y Vivienda 2011" (PDF) (in Spanish). Ine.gov.ve. p. 14. Retrieved 2012-11-25.
- ↑ "South America :: Postindependence overseas immigrants". Britannica Online Encyclopedia. Retrieved 2008-02-10.
- ↑ "En detrimento de Israel - Acercamiento arabe a America Latina por Natalio Steiner, co-director de Comunidades - Periódico Judío Independiente". delacole.com. Retrieved 22 September 2015.
- ↑ seis/grosfoguel.pdf "Latinoamérica" Check
|url=value (help) (PDF). Retrieved 2013-09-23. - ↑ Stranded in Paradise: Shipwrecked Hundreds of Years Ago, the Garifuna Are Still Trying to Find Their Way by Teresa Wiltz, The Washington Post.
- ↑ "Cor ou Raça" (PDF). Censo Demográfico 2010: Características gerais da população, religião e pessoas com deficiência. Instituto Brasileiro de Geografia e Estatística. 2010. Retrieved 5 October 2013.
- ↑ Informe Latinobarómetro, Latinobarómetro.
- ↑ Not Panicking Ltd (21 November 2011). "h2g2 - Y Wladfa - The Welsh in Patagonia - Edited Entry". bbc.co.uk. Retrieved 22 September 2015.
- ↑ "The Welsh Immigration to Argentina". 1stclassargentina.com. Retrieved 22 September 2015.
- ↑ Jeremy Howat. "Opening page: The Welsh in Patagonia". argbrit.org. Retrieved 22 September 2015.
- ↑ "Gaiman, Trelew y Rawson". patagonline.com. Retrieved 22 September 2015.
- ↑ "Y Wladfa - Patagonia". andesceltig.com. Retrieved 22 September 2015.
- ↑ Reference for Welsh language in southern Argentina, Welsh immigration to Patagonia
- ↑ "Christians". Pew Research Center's Religion & Public Life Project. 18 December 2012. Retrieved 22 September 2015.
- ↑ "CIA — The World Factbook -- Field Listing — Religions". Retrieved 2009-03-17.
- ↑ Fraser, Barbara J., In Latin America, Catholics down, church's credibility up, poll says Catholic News Service June 23, 2005
- ↑ LeElef, Ner. "World Jewish Population". Retrieved 2008-01-09.
- ↑ The Jewish People Policy Planning Institute; Annual Assessment, 2007
- ↑ United Jewish Communities; Global Jewish Populations
- ↑ "Argentina". U.S. Department of State. Retrieved 22 September 2015.
- ↑ "Argentina". U.S. Department of State. Retrieved 22 September 2015.
- ↑ "BBC Mundo - A fondo - Árabes y musulmanes en América Latina". bbc.co.uk. Retrieved 22 September 2015.
- ↑ Watching Over Greater Mexico: Mexican Migration Policy and Governance of Mexicanos Abroad
- ↑ United States Census Bureau. "Detailed Tables — American FactFinder. B03001. Hispanic or Latino origin by specific origin". 2006 American Community Survey. Retrieved 2007-12-15.
- ↑ Archived January 31, 2009, at the Wayback Machine.
- ↑ Brasileiros no Exterior — Portal da Câmara dos Deputados Archived July 21, 2009, at the Wayback Machine.
- ↑ Country Overview: El Salvador Archived January 1, 2010, at the Wayback Machine., United States Agency for International Development
- ↑ Chavistas in Quito, Forbes.com, January 7, 2008
- ↑ "Dominican Republic: Remittances for Development". ipsnews.net. Retrieved 22 September 2015.
- ↑ Cubans Abroad, Radiojamaica.com
- ↑ Chile: Moving Towards a Migration Policy, Migration Information Source
- ↑ "South America: Brazil, Mercosur - Migration News - Migration Dialogue". ucdavis.edu. Retrieved 22 September 2015.
- ↑ "Prospects - Migration and Remittances Factbook 2011". worldbank.org. Retrieved 22 September 2015.
- ↑ "Latin America & Caribbean (ElSalvador)" (PDF). World Bank. 2006. Retrieved 2010-07-26.
- ↑ "Latin America & Caribbean (Guatemala)" (PDF). World Bank. 2006. Retrieved 2010-07-26.
- ↑ "Latin America & Caribbean (Nicaragua)" (PDF). World Bank. 2006. Retrieved 2010-07-26.
- ↑ "Latin America & Caribbean (Honduras)" (PDF). World Bank. 2006. Retrieved 2010-07-26.
- ↑ "Latin America & Caribbean (Panama)" (PDF). World Bank. 2006. Retrieved 2010-07-26.
- ↑ "Latin America & Caribbean (CostaRica)" (PDF). World Bank. 2006. Retrieved 2010-07-26.
- ↑ United Nations Population Division