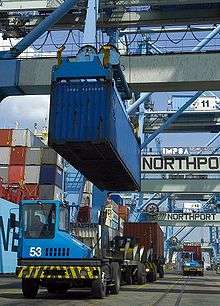
List of the largest trading partners of the European Union

EU
Top 10(2010)
Top 20(2010)
According to the European Commission Directorate-General for Trade. The 10 largest trading partners of the European Union with their total trade (sum of imports and exports) in millions of euro for calendar year 2015 are as follows.[1]
These figures do not include foreign direct investment or trade in services, but only trade in goods.
| Rank | Country | Exports | Imports | Total Trade | Trade Balance |
|---|---|---|---|---|---|
| - | World | 1,791,534 | 1,727,125 | 3,518,659 | +64,410 |
| 1 | 371,223 | 248,437 | 619,660 | +122,786 | |
| 2 | 170,484 | 350,424 | 520,909 | -179,940 | |
| 3 | 150,875 | 102,323 | 253,199 | +48,552 | |
| 4 | 73,911 | 135,711 | 209,622 | -61,800 | |
| 5 | 79,107 | 61,607 | 140,714 | +17,499 | |
| 6 | 48,869 | 74,260 | 123,128 | -25,391 | |
| 7 | 56,550 | 59,768 | 116,318 | -3,218 | |
| 8 | 47,901 | 42,347 | 90,248 | +5,554 | |
| 9 | 38,141 | 39,448 | 77,589 | -1,307 | |
| 10 | 34,600 | 31,067 | 65,666 | +3,533 | |
| - | Remaining Countries | 719,873 | 581,733 | 1,301,606 | +138,140 |
See also
- European Union free trade agreements
- List of the largest trading partners of India
- List of the largest trading partners of the United States
- List of the largest trading partners of the People's Republic of China
References
- ↑ Top Trading Partners Client and Supplier Countries of the EU28 in Merchandise Trade (value %) (2015, excluding intra-EU trade). Accessed 29 October 2016
This article is issued from Wikipedia - version of the 11/7/2016. The text is available under the Creative Commons Attribution/Share Alike but additional terms may apply for the media files.
