Lower Lake, California
| Lower Lake, California | |
|---|---|
| Census-designated place | |
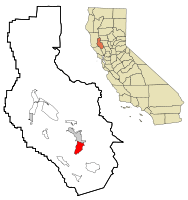 Location within Lake County and California | |
| Coordinates: 38°54′38″N 122°36′37″W / 38.91056°N 122.61028°WCoordinates: 38°54′38″N 122°36′37″W / 38.91056°N 122.61028°W | |
| Country |
|
| State |
|
| County | Lake |
| Area[1] | |
| • Total | 2.692 sq mi (6.971 km2) |
| • Land | 2.667 sq mi (6.907 km2) |
| • Water | 0.025 sq mi (0.064 km2) 0.92% |
| Elevation[2] | 1,371 ft (418 m) |
| Population (2010) | |
| • Total | 1,294 |
| • Density | 480/sq mi (190/km2) |
| Time zone | Pacific (PST) (UTC-8) |
| • Summer (DST) | PDT (UTC-7) |
| ZIP code | 95457 |
| Area code(s) | 707 |
| FIPS code | 06-44350 |
| GNIS feature ID | 0277549 |
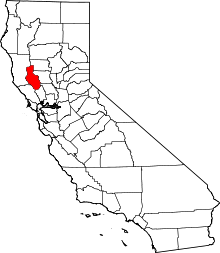
Lower Lake (formerly Grantville) is a census-designated place (CDP) in the southern Clear Lake region of Lake County, in northern California.[2] Lower Lake is also an Indian rancheria of the Koi Nation people.
Geography
Lower Lake is located is 4.5 miles (7.2 km) southwest of the City of Clearlake, and 13 miles (21 km) southeast of Kelseyville.[3] It is at an elevation of 1371 feet (418 m).[2] Lower Lake was at one point the county seat, the Lake County elections of 1867 were hotly contested with the seat moving between what is now the city of Lakeport and the town of Lower Lake, in 1870 the feud was settled and Lakeport controlled the seat. Although some believe the seat was stolen from Lower Lake, it has remained in Lakeport for over a century and no longer a topic of concern for locals. At the 2000 census, according to the United States Census Bureau, the CDP had a total area of 7.9 square miles (20 km2), of which 7.9 square miles (20 km2) was land and 0.1 square miles (0.26 km2) (0.88%) was water.
History
Lower Lake was founded by E. Mitchell in 1858 as Grantville. He built the first house there.[3] The settlement's first post office was opened in 1858.[3]
The population was 1,294 at the 2010 census, down from 1,755 at the 2000 census.
The Clayton Fire started on August 12, 2016 in areas of Lake County not burned in the Valley and Rocky Point Jerusalem Fires which ravaged Lake County in the summer of 2015. On Sunday afternoon, August 14, all residents of the town were evacuated and fire razed large parts of the downtown and other areas of Lower Lake.[4]
Lower Lake Stone Jail
The historic Lower Lake Stone Jail was built in 1876 in Lower Lake, from locally quarried stone. It is claimed to be the smallest jail in the United States.
Demographics
2010
The 2010 United States Census[5] reported that Lower Lake had a population of 1,294. The population density was 480.8 people per square mile (185.6/km²). The racial makeup of Lower Lake was 1,031 (79.7%) White, 20 (1.5%) African American, 18 (1.4%) Native American, 13 (1.0%) Asian, 1 (0.1%) Pacific Islander, 125 (9.7%) from other races, and 86 (6.6%) from two or more races. Hispanic or Latino of any race were 219 persons (16.9%).
The Census reported that 1,291 people (99.8% of the population) lived in households, 3 (0.2%) lived in non-institutionalized group quarters, and 0 (0%) were institutionalized.
There were 552 households, out of which 146 (26.4%) had children under the age of 18 living in them, 216 (39.1%) were opposite-sex married couples living together, 74 (13.4%) had a female householder with no husband present, 32 (5.8%) had a male householder with no wife present. There were 40 (7.2%) unmarried opposite-sex partnerships, and 2 (0.4%) same-sex married couples or partnerships. 190 households (34.4%) were made up of individuals and 73 (13.2%) had someone living alone who was 65 years of age or older. The average household size was 2.34. There were 322 families (58.3% of all households); the average family size was 2.99.
The population was spread out with 259 people (20.0%) under the age of 18, 96 people (7.4%) aged 18 to 24, 254 people (19.6%) aged 25 to 44, 449 people (34.7%) aged 45 to 64, and 236 people (18.2%) who were 65 years of age or older. The median age was 46.5 years. For every 100 females there were 99.7 males. For every 100 females age 18 and over, there were 100.2 males.
There were 705 housing units at an average density of 261.9 per square mile (101.1/km²), of which 389 (70.5%) were owner-occupied, and 163 (29.5%) were occupied by renters. The homeowner vacancy rate was 6.2%; the rental vacancy rate was 13.7%. 938 people (72.5% of the population) lived in owner-occupied housing units and 353 people (27.3%) lived in rental housing units.
2000
As of the census[6] of 2000, there were 1,755 people, 716 households, and 458 families residing in the CDP. The population density was 223.3 people per square mile (86.2/km²). There were 869 housing units at an average density of 110.6/sq mi (42.7/km²). The racial makeup of the CDP was 84.44% White, 1.71% African American, 2.05% Native American, 0.63% Asian, 0.40% Pacific Islander, 5.58% from other races, and 5.19% from two or more races. Hispanic or Latino of any race were 11.05% of the population.
There were 716 households out of which 25.0% had children under the age of 18 living with them, 48.5% were married couples living together, 10.8% had a female householder with no husband present, and 35.9% were non-families. 27.5% of all households were made up of individuals and 12.2% had someone living alone who was 65 years of age or older. The average household size was 2.45 and the average family size was 2.97.
In the CDP the population was spread out with 23.2% under the age of 18, 7.9% from 18 to 24, 22.3% from 25 to 44, 27.2% from 45 to 64, and 19.4% who were 65 years of age or older. The median age was 43 years. For every 100 females there were 100.3 males. For every 100 females age 18 and over, there were 94.0 males.
The median income for a household in the CDP was $24,974, and the median income for a family was $29,896. Males had a median income of $38,750 versus $21,250 for females. The per capita income for the CDP was $13,516. About 9.9% of families and 12.4% of the population were below the poverty line, including 12.0% of those under age 18 and 5.4% of those age 65 or over.
Government
In the California State Legislature, Lower Lake is in the 2nd Senate District, represented by Democrat Mike McGuire, and in the 4th Assembly District, represented by Democrat Cecilia Aguiar-Curry.[7]
In the United States House of Representatives, Lower Lake is in California's 3rd congressional district, represented by Democrat John Garamendi.[8]
References
- ↑ "2010 Census U.S. Gazetteer Files – Places – California". United States Census Bureau.
- 1 2 3 U.S. Geological Survey Geographic Names Information System: Lower Lake, California
- 1 2 3 Durham, David L. (1998). California's Geographic Names: A Gazetteer of Historic and Modern Names of the State. Clovis, Calif.: Word Dancer Press. p. 99. ISBN 1-884995-14-4.
- ↑ http://kymkemp.com/2016/08/14/sheriff-of-lake-county-declares-emergency-civilians-escaping-on-foot/
- ↑ "2010 Census Interactive Population Search: CA - Lower Lake CDP". U.S. Census Bureau. Retrieved July 12, 2014.
- ↑ "American FactFinder". United States Census Bureau. Retrieved 2008-01-31.
- ↑ "Statewide Database". UC Regents. Retrieved December 5, 2014.
- ↑ "California's 3rd Congressional District - Representatives & District Map". Civic Impulse, LLC. Retrieved March 1, 2013.