Optical coherence tomography
| Optical coherence tomography | |
|---|---|
| Intervention | |
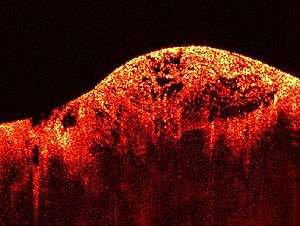 Optical Coherence Tomography (OCT) image of a sarcoma | |
| OPS-301 code | 3-300 |
Optical coherence tomography (OCT) is an established medical imaging technique that uses light to capture micrometer-resolution, three-dimensional images from within optical scattering media (e.g., biological tissue). Optical coherence tomography is based on low-coherence interferometry, typically employing near-infrared light. The use of relatively long wavelength light allows it to penetrate into the scattering medium. Confocal microscopy, another optical technique, typically penetrates less deeply into the sample but with higher resolution.
Depending on the properties of the light source (superluminescent diodes, ultrashort pulsed lasers, and supercontinuum lasers have been employed), optical coherence tomography has achieved sub-micrometer resolution (with very wide-spectrum sources emitting over a ~100 nm wavelength range).
Optical coherence tomography is one of a class of optical tomographic techniques. A relatively recent implementation of optical coherence tomography, frequency-domain optical coherence tomography, provides advantages in signal-to-noise ratio, permitting faster signal acquisition. Commercially available optical coherence tomography systems are employed in diverse applications, including art conservation and diagnostic medicine, notably in ophthalmology and optometry where it can be used to obtain detailed images from within the retina. Recently, it has also begun to be used in interventional cardiology to help diagnose coronary artery disease.[1] It has also shown promise in dermatology to improve the diagnostic process.[2]
Introduction

Starting from white-light interferometry for in vivo ocular eye measurements[3][4] imaging of biological tissue, especially of the human eye, was investigated by multiple groups worldwide. A first two-dimensional in vivo depiction of a human eye fundus along a horizontal meridian based on white light interferometric depth scans was presented at the ICO-15 SAT conference in 1990.[5] Further developed in 1990 by Naohiro Tanno,[6][7] then a professor at Yamagata University, and in particular since 1991 by Huang et al., in Prof. James Fujimoto laboratory at Massachusetts Institute of Technology,[8] optical coherence tomography (OCT) with micrometer resolution and cross-sectional imaging capabilities has become a prominent biomedical tissue-imaging technique; it is particularly suited to ophthalmic applications and other tissue imaging requiring micrometer resolution and millimeter penetration depth.[9] First in vivo OCT images – displaying retinal structures – were published in 1993 and first endoscopic images in 1997.[10][11] OCT has also been used for various art conservation projects, where it is used to analyze different layers in a painting. OCT has interesting advantages over other medical imaging systems.
Medical ultrasonography, magnetic resonance imaging (MRI), confocal microscopy, and OCT are differently suited to morphological tissue imaging: while the first two have whole body but low resolution imaging capability (typically a fraction of a millimeter), the third one can provide images with resolutions well below 1 micrometer (i.e. sub-cellular), between 0 and 100 micrometers in depth, and the fourth can probe as deep as 500 micrometers, but with a lower (i.e. architectural) resolution (around 10 micrometers in lateral and a few micrometers in depth in ophthalmology, for instance, and 20 micrometers in lateral in endoscopy).[12][13]
OCT is based on low-coherence interferometry.[14][15][4] In conventional interferometry with long coherence length (i.e., laser interferometry), interference of light occurs over a distance of meters. In OCT, this interference is shortened to a distance of micrometers, owing to the use of broad-bandwidth light sources (i.e., sources that emit light over a broad range of frequencies). Light with broad bandwidths can be generated by using superluminescent diodes or lasers with extremely short pulses (femtosecond lasers). White light is an example of a broadband source with lower power.
Light in an OCT system is broken into two arms—a sample arm (containing the item of interest) and a reference arm (usually a mirror). The combination of reflected light from the sample arm and reference light from the reference arm gives rise to an interference pattern, but only if light from both arms have traveled the "same" optical distance ("same" meaning a difference of less than a coherence length). By scanning the mirror in the reference arm, a reflectivity profile of the sample can be obtained (this is time domain OCT). Areas of the sample that reflect back a lot of light will create greater interference than areas that don't. Any light that is outside the short coherence length will not interfere. This reflectivity profile, called an A-scan, contains information about the spatial dimensions and location of structures within the item of interest. A cross-sectional tomograph (B-scan) may be achieved by laterally combining a series of these axial depth scans (A-scan). A face imaging at an acquired depth is possible depending on the imaging engine used.
Layperson's explanation


Optical Coherence Tomography, or ‘OCT’, is a technique for obtaining sub-surface images of translucent or opaque materials at a resolution equivalent to a low-power microscope. It is effectively ‘optical ultrasound’, imaging reflections from within tissue to provide cross-sectional images.
OCT has attracted interest among the medical community because it provides tissue morphology imagery at much higher resolution (better than 10 µm) than other imaging modalities such as MRI or ultrasound.
The key benefits of OCT are:
- Live sub-surface images at near-microscopic resolution
- Instant, direct imaging of tissue morphology
- No preparation of the sample or subject
- No ionizing radiation
OCT delivers high resolution because it is based on light, rather than sound or radio frequency. An optical beam is directed at the tissue, and a small portion of this light that reflects from sub-surface features is collected. Note that most light is not reflected but, rather, scatters off at large angles. In conventional imaging, this diffusely scattered light contributes background that obscures an image. However, in OCT, a technique called interferometry is used to record the optical path length of received photons allowing rejection of most photons that scatter multiple times before detection. Thus OCT can build up clear 3D images of thick samples by rejecting background signal while collecting light directly reflected from surfaces of interest.
Within the range of noninvasive three-dimensional imaging techniques that have been introduced to the medical research community, OCT as an echo technique is similar to ultrasound imaging. Other medical imaging techniques such as computerized axial tomography, magnetic resonance imaging, or positron emission tomography do not use the echo-location principle.
The technique is limited to imaging 1 to 2 mm below the surface in biological tissue, because at greater depths the proportion of light that escapes without scattering is too small to be detected. No special preparation of a biological specimen is required, and images can be obtained ‘non-contact’ or through a transparent window or membrane. It is also important to note that the laser output from the instruments is low – eye-safe near-infra-red light is used – and no damage to the sample is therefore likely.
Theory
The principle of OCT is white light or low coherence interferometry. The optical setup typically consists of an interferometer (Fig. 1, typically Michelson type) with a low coherence, broad bandwidth light source. Light is split into and recombined from reference and sample arm, respectively.
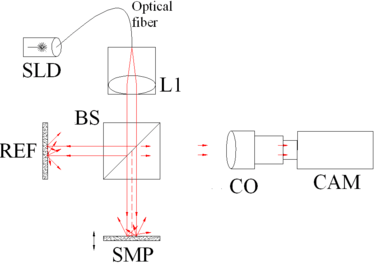 Fig. 1 Full-field OCT optical setup. Components include: super-luminescent diode (SLD), convex lens (L1), 50/50 beamsplitter (BS), camera objective (CO), CMOS-DSP camera (CAM), reference (REF), and sample (SMP). The camera functions as a two-dimensional detector array, and with the OCT technique facilitating scanning in depth, a non-invasive three dimensional imaging device is achieved. |

 Fig. 3 Spectral discrimination by swept-source OCT. Components include: swept source or tunable laser (SS), beamsplitter (BS), reference mirror (REF), sample (SMP), photodetector (PD), and digital signal processing (DSP) |
Time domain
In time domain OCT the pathlength of the reference arm is translated longitudinally in time. A property of low coherence interferometry is that interference, i.e. the series of dark and bright fringes, is only achieved when the path difference lies within the coherence length of the light source. This interference is called auto correlation in a symmetric interferometer (both arms have the same reflectivity), or cross-correlation in the common case. The envelope of this modulation changes as pathlength difference is varied, where the peak of the envelope corresponds to pathlength matching.
The interference of two partially coherent light beams can be expressed in terms of the source intensity, , as

![I = k_1 I_S + k_2 I_S + 2 \sqrt { \left ( k_1 I_S \right ) \cdot \left ( k_2 I_S \right )} \cdot Re \left [\gamma \left ( \tau \right ) \right] \qquad (1)](../I/m/e90b482fe73988b986f3ebc89f0ff288bf6d67d9.svg)
where represents the interferometer beam splitting ratio, and is called the complex degree of coherence, i.e. the interference envelope and carrier dependent on reference arm scan or time delay , and whose recovery of interest in OCT. Due to the coherence gating effect of OCT the complex degree of coherence is represented as a Gaussian function expressed as[4]


![\gamma \left ( \tau \right ) = \exp \left [- \left ( \frac{\pi\Delta\nu\tau}{2 \sqrt{\ln 2} } \right )^2 \right] \cdot \exp \left ( -j2\pi\nu_0\tau \right ) \qquad \quad (2)](../I/m/83da0d10e1049d9b461ab144e7b9dd7e58e85c45.svg)
where represents the spectral width of the source in the optical frequency domain, and is the centre optical frequency of the source. In equation (2), the Gaussian envelope is amplitude modulated by an optical carrier. The peak of this envelope represents the location of sample under test microstructure, with an amplitude dependent on the reflectivity of the surface. The optical carrier is due to the Doppler effect resulting from scanning one arm of the interferometer, and the frequency of this modulation is controlled by the speed of scanning. Therefore, translating one arm of the interferometer has two functions; depth scanning and a Doppler-shifted optical carrier are accomplished by pathlength variation. In OCT, the Doppler-shifted optical carrier has a frequency expressed as


where is the central optical frequency of the source, is the scanning velocity of the pathlength variation, and is the speed of light.


The axial and lateral resolutions of OCT are decoupled from one another; the former being an equivalent to the coherence length of the light source and the latter being a function of the optics. The axial resolution of OCT is defined as


Frequency domain
In frequency domain OCT (FD-OCT) the broadband interference is acquired with spectrally separated detectors (either by encoding the optical frequency in time with a spectrally scanning source or with a dispersive detector, like a grating and a linear detector array). Due to the Fourier relation (Wiener-Khintchine theorem between the auto correlation and the spectral power density) the depth scan can be immediately calculated by a Fourier-transform from the acquired spectra, without movement of the reference arm.[16][17] This feature improves imaging speed dramatically, while the reduced losses during a single scan improve the signal to noise proportional to the number of detection elements. The parallel detection at multiple wavelength ranges limits the scanning range, while the full spectral bandwidth sets the axial resolution.
Spatially encoded
Spatially encoded frequency domain OCT (SEFD-OCT, spectral domain or Fourier domain OCT) extracts spectral information by distributing different optical frequencies onto a detector stripe (line-array CCD or CMOS) via a dispersive element (see Fig. 4). Thereby the information of the full depth scan can be acquired within a single exposure. However, the large signal to noise advantage of FD-OCT is reduced due to the lower dynamic range of stripe detectors with respect to single photosensitive diodes, resulting in an SNR (signal to noise ratio) advantage of ~10 dB at much higher speeds. This is not much of a problem when working at 1300 nm, however, since dynamic range is not a serious problem at this wavelength range.
The drawbacks of this technology are found in a strong fall-off of the SNR, which is proportional to the distance from the zero delay and a sinc-type reduction of the depth dependent sensitivity because of limited detection linewidth. (One pixel detects a quasi-rectangular portion of an optical frequency range instead of a single frequency, the Fourier-transform leads to the sinc(z) behavior). Additionally the dispersive elements in the spectroscopic detector usually do not distribute the light equally spaced in frequency on the detector, but mostly have an inverse dependence. Therefore, the signal has to be resampled before processing, which can not take care of the difference in local (pixelwise) bandwidth, which results in further reduction of the signal quality. However, the fall-off is not a serious problem with the development of new generation CCD or photodiode array with a larger number of pixels.
Synthetic array heterodyne detection offers another approach to this problem without the need for high dispersion.
Time encoded
Time encoded frequency domain OCT (TEFD-OCT, or swept source OCT) tries to combine some of the advantages of standard TD and SEFD-OCT. Here the spectral components are not encoded by spatial separation, but they are encoded in time. The spectrum either filtered or generated in single successive frequency steps and reconstructed before Fourier-transformation. By accommodation of a frequency scanning light source (i.e. frequency scanning laser) the optical setup (see Fig. 5) becomes simpler than SEFD, but the problem of scanning is essentially translated from the TD-OCT reference-arm into the TEFD-OCT light source. Here the advantage lies in the proven high SNR detection technology, while swept laser sources achieve very small instantaneous bandwidths (=linewidth) at very high frequencies (20–200 kHz). Drawbacks are the nonlinearities in the wavelength (especially at high scanning frequencies), the broadening of the linewidth at high frequencies and a high sensitivity to movements of the scanning geometry or the sample (below the range of nanometers within successive frequency steps).
Scanning schemes
Focusing the light beam to a point on the surface of the sample under test, and recombining the reflected light with the reference will yield an interferogram with sample information corresponding to a single A-scan (Z axis only). Scanning of the sample can be accomplished by either scanning the light on the sample, or by moving the sample under test. A linear scan will yield a two-dimensional data set corresponding to a cross-sectional image (X-Z axes scan), whereas an area scan achieves a three-dimensional data set corresponding to a volumetric image (X-Y-Z axes scan), also called full-field OCT.
Single point
Systems based on single point, confocal, or flying-spot time domain OCT, must scan the sample in two lateral dimensions and reconstruct a three-dimensional image using depth information obtained by coherence-gating through an axially scanning reference arm (Fig. 2). Two-dimensional lateral scanning has been electromechanically implemented by moving the sample[17] using a translation stage, and using a novel micro-electro-mechanical system scanner.[18]
Parallel
Parallel or full field OCT using a charge-coupled device (CCD) camera has been used in which the sample is full-field illuminated and en face imaged with the CCD, hence eliminating the electromechanical lateral scan. By stepping the reference mirror and recording successive en face images a three-dimensional representation can be reconstructed. Three-dimensional OCT using a CCD camera was demonstrated in a phase-stepped technique,[19] using geometric phase shifting with a Linnik interferometer,[20] utilising a pair of CCDs and heterodyne detection,[21] and in a Linnik interferometer with an oscillating reference mirror and axial translation stage.[22] Central to the CCD approach is the necessity for either very fast CCDs or carrier generation separate to the stepping reference mirror to track the high frequency OCT carrier.
Smart detector array
A two-dimensional smart detector array, fabricated using a 2 µm complementary metal-oxide-semiconductor (CMOS) process, was used to demonstrate full-field TD-OCT.[23] Featuring an uncomplicated optical setup (Fig. 3), each pixel of the 58x58 pixel smart detector array acted as an individual photodiode and included its own hardware demodulation circuitry.
Selected applications
Optical coherence tomography is an established medical imaging technique. It is widely used, for example, to obtain high-resolution images of the anterior segment of the eye and the retina, which can, for example, provide a straightforward method of assessing axonal integrity in multiple sclerosis,[24] as well as macular degeneration.[25] Research indicates that OCT may be a reliable tool for monitoring the progression of glaucoma. OCT has been widely considered the new standard reference for the assessment of diabetic macular edema.[26]
OCT was also used to image coronary arteries in order to visualize vessel wall lumen morphology and microstructure at a resolution 10 times higher than other existing modalities such as intravascular ultrasounds and x-ray angiography (Intracoronary Optical Coherence Tomography). For this type of application, approximately 1 mm in diameter fiber-optics catheters are used to access artery lumen through semi-invasive interventions, i.e. Percutaneous coronary intervention. The first demonstration of endoscopic OCT was reported in 1997, by researchers in James Fujimoto laboratory at Massachusetts Institute of Technology, including Prof. Guillermo James Tearney and Prof. Brett Bouma.[27] The first TD-OCT imaging catheter and system was commercialized by LightLab Imaging, Inc., a company based in Massachusetts in 2006. The first FD-OCT imaging study was reported by the laboratory of Prof. Guillermo James Tearney and Prof. Brett Bouma based at Massachusetts General Hospital in 2008.[28] Intravascular FD-OCT was first introduced in the market in 2009 by LightLab Imaging, Inc.[29] and Terumo Corporation launched a second solution for coronary artery imaging in 2012. The higher imaging speed of FD-OCT enabled the widespread adoption of this imaging technology for coronary artery imaging. It is estimated that >100,000 FD-OCT coronary imaging cases are performed yearly, and that the market is increasing of approximately 20% every year.[30] Endoscopic OCT is also applied to other medical conditions, including detection and diagnosis of cancer and precancerous lesions, such as Barrett's esophagus and esophagus dysplasia.[31]
Researchers have used OCT to produce detailed images of mice brains, through a "window" made of zirconia that has been modified to be transparent and implanted in the skull.[32] Optical coherence tomography is also applicable and increasingly used in industrial applications, such as nondestructive testing (NDT), material thickness measurements,[33] and in particular thin silicon wafers[34][35] and compound semiconductor wafers thickness measurements[36][37] surface roughness characterization, surface and cross-section imaging[38][39] and volume loss measurements. OCT systems with feedback can be used to control manufacturing processes. With high speed data acquisition,[40] and sub-micron resolution, OCT is adaptable to perform both inline and off-line.[41] Due to the high volume of produced pills, an interesting field of application is in the pharmaceutical industry to control the coating of tablets.[42] Fiber-based OCT systems are particularly adaptable to industrial environments.[43] These can access and scan interiors of hard-to-reach spaces,[44] and are able to operate in hostile environments — whether radioactive, cryogenic, or very hot.[45] Novel optical biomedical diagnostic and imaging technologies are currently being developed to solve problems in biology and medicine.[46] As of 2014, attempts have been made to use optical coherence tomography to identify root canals in teeth, specifically canal in the maxillary molar, however, there's no difference with the current methods of dental operatory microscope.[47] Research conducted in 2015 was successful in utilizing a smartphone as an OCT platform, although much work remains to be done before such a platform would be commercially viable.[48]
See also
- Angle-resolved low-coherence interferometry
- Ballistic photon
- Interferometry
- Leica Microsystems
- Novacam Technologies
- Optical heterodyne detection
- Optical projection tomography
- Terahertz tomography
- Tomography
References
- ↑ Bezerra, Hiram G.; Costa, Marco A.; Guagliumi, Giulio; Rollins, Andrew M.; Simon, Daniel I. (November 2009). "Intracoronary Optical Coherence Tomography: A Comprehensive Review". JACC: Cardiovascular Interventions. 2 (11): 1035–1046. doi:10.1016/j.jcin.2009.06.019. PMID 19926041.
- ↑ Chua, Shunjie (2015). "High-Definition Optical Coherence Tomography for the Study of Evolution of a Disease" (PDF). Dermatology Bulletin. 26 (1): 2–3. Retrieved 28 May 2015.
- ↑ Fercher, A.F.; Roth, E. (15 September 1986). "Ophthalmic laser interferometry". Proc. SPIE. 658: 48–51. doi:10.1117/12.938523.
- 1 2 3 Fercher, A. F.; Mengedoht, K.; Werner, W. (1988). "Eye-length measurement by interferometry with partially coherent light". Optics Letters. 13 (3): 186–8. Bibcode:1988OptL...13..186F. doi:10.1364/OL.13.000186. PMID 19742022.
- ↑ Fercher, A.F. (12–16 August 1990). "Ophthalmic interferometry". In von Bally, G.; Khanna, S. Proceedings of the International Conference on Optics in Life Sciences. Garmisch-Partenkirchen, Germany. pp. 221–228. ISBN 0-444-89860-3.
- ↑ Naohiro Tanno, Tsutomu Ichikawa, Akio Saeki: "Lightwave Reflection Measurement," Japanese Patent # 2010042 (1990) (Japanese Language)
- ↑ Shinji Chiba; Naohiro Tanno (1991). Backscattering Optical Heterodyne Tomography. 14th Laser Sensing Symposium (in Japanese).
- ↑ Huang, D; Swanson, EA; Lin, CP; Schuman, JS; Stinson, WG; Chang, W; Hee, MR; Flotte, T; et al. (1991). "Optical coherence tomography". Science. 254 (5035): 1178–81. Bibcode:1991Sci...254.1178H. doi:10.1126/science.1957169. PMID 1957169.
- ↑ Zysk, AM; Nguyen, FT; Oldenburg, AL; Marks, DL; Boppart, SA (2007). "Optical coherence tomography: a review of clinical development from bench to bedside.". Journal of biomedical optics. 12 (5): 051403. Bibcode:2007JBO....12e1403Z. doi:10.1117/1.2793736. PMID 17994864.
- ↑ Fercher, A.F.; Hitzenberger, C.K.; Drexler, W.; Kamp, G.; Sattmann, H. (15 July 1993). "In Vivo Optical Coherence Tomography". American Journal of Ophthalmology. 116 (1): 113–114. doi:10.1016/S0002-9394(14)71762-3. PMID 8328536.
- ↑ Swanson, E. A.; Izatt, J. A.; Hee, M. R.; Huang, D.; Lin, C. P.; Schuman, J. S.; Puliafito, C. A.; Fujimoto, J. G. (1993). "In vivo retinal imaging by optical coherence tomography". Optics Letters. 18 (21): 1864–6. Bibcode:1993OptL...18.1864S. doi:10.1364/OL.18.001864. PMID 19829430.
- ↑ Drexler, Wolfgang; Morgner, Uwe; Ghanta, Ravi K.; Kärtner, Franz X.; Schuman, Joel S.; Fujimoto, James G. (2001). "Ultrahigh-resolution ophthalmic optical coherence tomography". Nature Medicine. 7 (4): 502–7. doi:10.1038/86589. PMC 1950821
 . PMID 11283681.
 - ↑ Kaufman, S; Musch, DC; Belin, MW; Cohen, EJ; Meisler, DM; Reinhart, WJ; Udell, IJ; Van Meter, WS (2004). "Confocal microscopy: A report by the American Academy of Ophthalmology". Ophthalmology. 111 (2): 396–406. doi:10.1016/j.ophtha.2003.12.002. PMID 15019397.
- ↑ Riederer, S.J. (2000). "Current technical development of magnetic resonance imaging". IEEE Engineering in Medicine and Biology Magazine. 19 (5): 34–41. doi:10.1109/51.870229. PMID 11016028.
- ↑ M. Born; E. Wolf (2000). Principles of Optics: Electromagnetic Theory of Propagation, Interference, and Diffraction of Light. Cambridge University Press. ISBN 0-521-78449-2.
- ↑ Schmitt, J.M. (1999). "Optical coherence tomography (OCT): a review". IEEE Journal of Selected Topics in Quantum Electronics. 5 (4): 1205–1215. doi:10.1109/2944.796348.
- 1 2 Fercher, A; Hitzenberger, C.K.; Kamp, G.; El-Zaiat, S.Y. (1995). "Measurement of intraocular distances by backscattering spectral interferometry". Optics Communications. 117: 43–48. Bibcode:1995OptCo.117...43F. doi:10.1016/0030-4018(95)00119-S.
- ↑ Yeow, J.T.W.; Yang, V.X.D.; Chahwan, A.; Gordon, M.L.; Qi, B.; Vitkin, I.A.; Wilson, B.C.; Goldenberg, A.A. (2005). "Micromachined 2-D scanner for 3-D optical coherence tomography". Sensors and Actuators A: Physical. 117 (2): 331. doi:10.1016/j.sna.2004.06.021.
- ↑ Dunsby, C; Gu, Y; French, P (2003). "Single-shot phase-stepped wide-field coherencegated imaging". Optics Express. 11 (2): 105–15. Bibcode:2003OExpr..11..105D. doi:10.1364/OE.11.000105. PMID 19461712.
- ↑ Roy, M; Svahn, P; Cherel, L; Sheppard, CJR (2002). "Geometric phase-shifting for low-coherence interference microscopy". Optics and Lasers in Engineering. 37 (6): 631–641. Bibcode:2002OptLE..37..631R. doi:10.1016/S0143-8166(01)00146-4.
- ↑ Akiba, M.; Chan, K. P.; Tanno, N. (2003). "Full-field optical coherence tomography by two-dimensional heterodyne detection with a pair of CCD cameras". Optics Letters. 28 (10): 816–8. Bibcode:2003OptL...28..816A. doi:10.1364/OL.28.000816. PMID 12779156.
- ↑ Dubois, A; Vabre, L; Boccara, AC; Beaurepaire, E (2002). "High-resolution full-field optical coherence tomography with a Linnik microscope". Applied Optics. 41 (4): 805–12. Bibcode:2002ApOpt..41..805D. doi:10.1364/AO.41.000805. PMID 11993929.
- ↑ Bourquin, S.; Seitz, P.; Salathé, R. P. (2001). "Optical coherence topography based on a two-dimensional smart detector array". Optics Letters. 26 (8): 512–4. Bibcode:2001OptL...26..512B. doi:10.1364/OL.26.000512. PMID 18040369.
- ↑ Dörr, Jan; Wernecke, KD; Bock, M; Gaede, G; Wuerfel, JT; Pfueller, CF; Bellmann-Strobl, J; Freing, A; Brandt, AU; Friedemann, P (8 April 2011). "Association of retinal and macular damage with brain atrophy in multiple sclerosis.". PLoS ONE. 6 (4): e18132. Bibcode:2011PLoSO...618132D. doi:10.1371/journal.pone.0018132. PMC 3072966. PMID 21494659. Retrieved 21 November 2012.

- ↑ Keane, PA; Patel, PJ; Liakopoulos, S; Heussen, FM; Sadda, SR; Tufail, A (September 2012). "Evaluation of age-related macular degeneration with optical coherence tomography". Survey of Ophthalmology. 57 (5): 389–414. doi:10.1016/j.survophthal.2012.01.006. PMID 22898648.
- ↑ Virgili, G; Menchini, F; Casazza, G; Hogg, R; Das, RR; Wang, X; Michelessi, M (7 January 2015). "Optical coherence tomography (OCT) for detection of macular oedema in patients with diabetic retinopathy". Cochrane Database Syst Rev. 10: CD008081. doi:10.1002/14651858.CD008081.pub3. PMID 25564068.
- ↑ Tearney, GJ; Brezinski, ME; Bouma, BE; Boppart, SA; Pitris, C; Southern, JF; Fujimoto, JG (27 June 1997). "In vivo endoscopic optical biopsy with optical coherence tomography". Science. 276 (5321): 2037–2039. PMID 9197265.
- ↑ Tearney, GJ; Waxman, S; Shishkov, M; Vakoc, BJ; Suter, MJ; Freilich, MI; Desjardins, AE; Oh, WY; Bartlett, LA; Rosenberg, M; Bouma, BE (November 2008). "Three-Dimensional Coronary Artery Microscopy by Intracoronary Optical Frequency Domain Imaging". JACC Cardiovascular Imaging. 1 (6): 752–761. doi:10.1016/j.jcmg.2008.06.007. PMC 2852244. PMID 19356512.
- ↑ "LightLab launches FD-OCT in Europe". Retrieved 9 September 2016.
- ↑ Swanson, Eric (13 June 2016). "Optical Coherence Tomography: Beyond better clinical care: OCT's economic impact". BioOptics World. Retrieved 9 September 2016.
- ↑ "Next-gen OCT for the esophagus". BioOptics World. 1 May 2013. Retrieved 9 September 2016.
- ↑ Damestani, Yasaman; Reynolds, Carissa L.; Szu, Jenny; Hsu, Mike S.; Kodera, Yasuhiro; Binder, Devin K.; Park, B. Hyle; Garay, Javier E.; Rao, Masaru P.; Aguilar, Guillermo (2013). "Transparent nanocrystalline yttria-stabilized-zirconia calvarium prosthesis". Nanomedicine. Elsevier. 9 (8): 1135–8. doi:10.1016/j.nano.2013.08.002. PMID 23969102. Retrieved September 11, 2013. Lay summary – Los Angeles Times (September 4, 2013).
- ↑ B1 US patent 7116429 B1, Walecki, Wojciech J. & Van, Phuc, "Determining thickness of slabs of materials", issued 2006-10-03, assigned to Walecki, Wojciech J. and Van, Phuc.
- ↑ Walecki, Wojtek J.; Szondy, Fanny (2008). "Integrated quantum efficiency, reflectance, topography and stress metrology for solar cell manufacturing". Proc. SPIE. 7064: 70640A. doi:10.1117/12.797541.
- ↑ Walecki, Wojciech J.; Lai, Kevin; Pravdivtsev, Alexander; Souchkov, Vitali; Van, Phuc; Azfar, Talal; Wong, Tim; Lau, S.H.; Koo, Ann (2005). "Low-coherence interferometric absolute distance gauge for study of MEMS structures". Proc. SPIE. 5716,: 182. doi:10.1117/12.590013.
- ↑ Walecki, W.J.; Lai, K.; Souchkov, V.; Van, P.; Lau, S.; Koo, A. (2005). "Novel noncontact thickness metrology for backend manufacturing of wide bandgap light emitting devices". Physica status solidi (c). 2: 984–989. doi:10.1002/pssc.200460606.
- ↑ Walecki, Wojciech; Wei, Frank; Van, Phuc; Lai, Kevin; Lee, Tim; Lau, S.H.; Koo, Ann (2004). "Novel low coherence metrology for nondestructive characterization of high-aspect-ratio microfabricated and micromachined structures". Proc. SPIE. 5343: 55. doi:10.1117/12.530749.
- ↑ Guss, G.; Bass, I.; Hackel, R.; Demos, S.G. (November 6, 2007). High-resolution 3-D imaging of surface damage sites in fused silica with Optical Coherence Tomography (PDF) (Report). Lawrence Livermore National Laboratory. UCRL-PROC-236270. Retrieved December 14, 2010.
- ↑ Walecki, W; Wei, F; Van, P; Lai, K; Lee, T (2004). Interferometric Metrology for Thin and Ultra-Thin Compound Semiconductor Structures Mounted on Insulating Carriers (PDF). CS Mantech Conference.
- ↑ Walecki, Wojciech J.; Pravdivtsev, Alexander; Santos, Manuel, II; Koo,, Ann (August 2006). "High-speed high-accuracy fiber optic low-coherence interferometry for in situ grinding and etching process monitoring". Proc. SPIE. 6293: 62930D. doi:10.1117/12.675592.
- ↑ See, for example: "ZebraOptical Optoprofiler: Interferometric Probe".
- ↑ EP application 2799842, Markl, Daniel; Hannesschläger, Günther & Leitner, Michael et al., "A device and a method for monitoring a property of a coating of a solid dosage form during a coating process forming the coating of the solid dosage form", published 2014-11-05; GB application 2513581; US application 20140322429 A1.
- ↑ Walecki, Wojtek J.; Szondy, Fanny (30 April 2009). "Fiber optics low-coherence IR interferometry for defense sensors manufacturing" (PDF). Proc. SPIE. 7322: 73220K. doi:10.1117/12.818381.
- ↑ Dufour, Marc; Lamouche, Guy; Gauthier, Bruno; Padioleau, Christian; Monchalin, Jean-Pierre (13 December 2006). "Inspection of hard-to-reach industrial parts using small diameter probes" (PDF). SPIE - The International Society for Optical Engineering. doi:10.1117/2.1200610.0467. Retrieved December 15, 2010.
- ↑ Dufour, M. L.; Lamouche, G.; Detalle, V.; Gauthier, B.; Sammut, P. (April 2005). "Low-Coherence Interferometry, an Advanced Technique for Optical Metrology in Industry". Insight - Non-Destructive Testing and Condition Monitoring. 47 (4): 216–219. doi:10.1784/insi.47.4.216.63149. ISSN 1354-2575.
- ↑ Boppart, Stephen (11 June 2014). "Developing new optical imaging techniques for clinical use". SPIE. doi:10.1117/2.3201406.03.
- ↑ Iino, Y; Ebihara, A; Yoshioka, T; Kawamura, J; Watanabe, S; Hanada, T; Nakano, K; Sumi, Y; Suda, H (November 2014). "Detection of a second mesiobuccal canal in maxillary molars by swept-source optical coherence tomography". Journal of Endodontics. 40 (11): 1865–1868. doi:10.1016/j.joen.2014.07.012. PMID 25266471.
- ↑ Subhash, Hrebesh M.; Hogan, Josh N.; Leahy, Martin J. (May 2015). "Multiple-reference optical coherence tomography for smartphone applications". SPIE. doi:10.1117/2.1201503.005807.