United States House of Representatives elections, 1834
| | |||||||||||||||||||||||||||||||||||||||||||||||||||||||||||||||
| |||||||||||||||||||||||||||||||||||||||||||||||||||||||||||||||
| |||||||||||||||||||||||||||||||||||||||||||||||||||||||||||||||
|
| |||||||||||||||||||||||||||||||||||||||||||||||||||||||||||||||
| |||||||||||||||||||||||||||||||||||||||||||||||||||||||||||||||
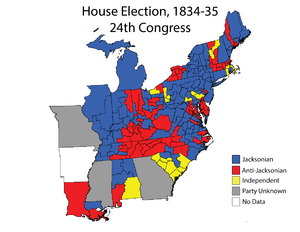
Elections to the United States House of Representatives for the 24th Congress were held in 1834 and 1835.
In this election, the dominant Jacksonian Party, or Democrats, retained their majority, neither gaining nor losing seats from 1832–1833. However, their primary opponents, the Anti-Jacksonians, who by this time were transitioning into becoming the Whig Party, gained at the expense of the Jacksonians as well as the two single-issue parties, the Anti-Masonic Party (an anti-Masonry movement) and the Nullifier Party (a John C. Calhoun-led states' rights party that supported South Carolina during the Nullification Crisis in 1832 and 1833).
The Whig Party, which evolved from the National Republican Party, attempted to change its image and reach out to new groups, including conservative Jacksonians, anti-Masons, and former Federalists. The Whigs would soon be able to gain a number of seats due to the unpopularity in some regions of Andrew Jackson's brash style. A number of former Jacksonians left the party and joined the newly formed Whigs in opposition to the perceived autocratic style of the president.
As the President's party lost no seats, this was the smallest loss by a President's party in the House as a result of the so-called six-year itch.
Election summaries
The States of Arkansas and Michigan were admitted during this Congress, adding 1 seat each.[1][2]
| 143 | 8 | 16 | 75 |
| Jacksonian | N | AM | Anti-Jacksonian |
| State | Type | Date | Total seats |
Jacksonian | Anti-Jacksonian | Anti-Masonic | Nullifier | ||||
|---|---|---|---|---|---|---|---|---|---|---|---|
| Seats | Change | Seats | Change | Seats | Change | Seats | Change | ||||
| Delaware | At-large | November 11, 1834 | 1 | 0 | 1 | 0 | 0 | ||||
| Georgia | At-large | October 6, 1834 | 9 | 9 | 0 | 0 | 0 | ||||
| Illinois | District (3) | August 4, 1834 | 3 | 3 | 0 | 0 | 0 | ||||
| Louisiana | District (3) | July 7–9, 1834 | 3 | 1 | 2 | 0 | 0 | ||||
| Maine | District (8) | September 8, 1834 | 8 | 6 | 2 | 0 | 0 | ||||
| Massachusetts | District (12) | November 10, 1834 | 12 | 1 | 8 | 3 | 0 | ||||
| New Jersey | At-large | October 14, 1834 | 6 | 6 | 0 | 0 | 0 | ||||
| New York | District (33[Note 4]) | November 3–5, 1834 | 40 | 31 | 9 | 0 | 0 | ||||
| Ohio | District (19) | October 14, 1834 | 19 | 9 | 9 | 1 | 0 | ||||
| Pennsylvania | District (25[Note 5]) | October 14, 1834 | 28 | 17 | 3 | 8 | 0 | ||||
| South Carolina | District (9) | October 13–14, 1834 | 9 | 2 | 0 | 0 | 7 | ||||
| Vermont | District (5) | September 2, 1834 | 5 | 0 | 3 | 2 | 0 | ||||
| 1835 elections | |||||||||||
| Alabama | District (5) | August 3, 1835 | 5 | 3 | 1 | 0 | 1 | ||||
| Connecticut | At-large | April 9, 1835 | 6 | 6 | 0 | 0 | 0 | ||||
| Indiana | District (7) | August 3, 1835 | 7 | 6 | 1 | 0 | 0 | ||||
| Kentucky | District (13) | August 5, 1835 | 13 | 4 | 9 | 0 | 0 | ||||
| Maryland | District (7[Note 6]) | October 5, 1835 | 8 | 4 | 4 | 0 | 0 | ||||
| Michigan[Note 7] | At-large | October 5, 1835 | 1 | 1 | 0 | 0 | 0 | ||||
| Mississippi | At-large | November 3–5, 1835 | 2 | 1 | 1 | 0 | 0 | ||||
| Missouri | At-large | August 3, 1835 | 2 | 1 | 1 | 0 | 0 | ||||
| New Hampshire | At-large | March 10, 1835 | 5 | 5 | 0 | 0 | 0 | ||||
| North Carolina | District (13) | August 13, 1835 | 13 | 6 | 7 | 0 | 0 | ||||
| Rhode Island | At-large | August 25, 1835 | 2 | 0 | 0 | 2 | 0 | ||||
| Tennessee | District (13) | August 5–6, 1835 | 13 | 4 | 9 | 0 | 0 | ||||
| Virginia | District (21) | April, 1835 | 21 | 16 | 5 | 0 | 0 | ||||
| 1836 elections | |||||||||||
| Arkansas[Note 7] | At-large | August 1, 1836 | 1 | 1 | 0 | 0 | 0 | ||||
| Total[Note 2] | 242 | 143 59.1% |
|
75 31.0% |
|
16 6.6% |
|
8 3.3% |
| ||
Complete returns
Pennsylvania
| District | Incumbent | Party | First elected |
Result | Candidates[3][Note 8] |
|---|---|---|---|---|---|
| Pennsylvania 1 | Joel B. Sutherland | Jacksonian | 1826 | Re-elected | Joel B. Sutherland (J) 61.7% James Gowen (?) 38.3% |
| Pennsylvania 2 Plural district with 2 seats |
Horace Binney | Anti-Jacksonian | 1832 | Retired Anti-Jacksonian hold |
Joseph R. Ingersoll (AJ) 60.4% James Harper (AJ) 59.9% James M. Linnard (J) 40.1% Henry Horn (J) 39.6% |
| James Harper | Anti-Jacksonian | 1832 | Re-elected | ||
| Pennsylvania 3 | John G. Watmough | Anti-Jacksonian | 1830 | Lost re-election Jacksonian gain |
Michael W. Ash (J) 55.6% John G. Watmough (AJ) 44.4% |
| Pennsylvania 4 Plural district with 3 seats |
William Hiester | Anti-Masonic | 1830 | Re-elected | William Hiester (AM) 55.0% David Potts, Jr. (AM) 55.0% Edward Darlington (AM) 54.9% Archibald T. Dick (J) 45.1% Benjamin Champneys (J) 45.0% John Morgan (J) 45.0% |
| Edward Darlington | Anti-Masonic | 1832 | Re-elected | ||
| David Potts, Jr. | Anti-Masonic | 1830 | Re-elected | ||
| Pennsylvania 5 | Joel K. Mann | Jacksonian | 1830 | Retired Jacksonian hold |
Jacob Fry, Jr. (J) 55.3% James Royer (?) 44.7% |
| Pennsylvania 6 | Robert Ramsey | Jacksonian | 1832 | Retired Anti-Jacksonian gain |
Mathias Morris (AJ) 52.4% Henry Chapman (J) 47.6% |
| Pennsylvania 7 | David D. Wagener | Jacksonian | 1832 | Re-elected | David D. Wagener (J) 68.1% Alexander E. Brown (?) 31.9% |
| Pennsylvania 8 | Henry King | Jacksonian | 1830 | Retired Jacksonian hold |
Edward B. Hubley (J) 59.6% Walter C. Livingston (?) 40.4% |
| Pennsylvania 9 | Henry A. P. Muhlenberg | Jacksonian | 1828 | Re-elected | Henry A. P. Muhlenberg (J) 69.3% Stanly Kirby (?) 30.7% |
| Pennsylvania 10 | William Clark | Anti-Masonic | 1832 | Re-elected | William Clark (AM) 54.0% John C. Bucher (J) 46.0% |
| Pennsylvania 11 | Charles A. Barnitz | Anti-Masonic | 1832 | Lost re-election Jacksonian gain |
Henry Logan (J) 54.2% Charles A. Barnitz (AM) 45.8% |
| Pennsylvania 12 | George Chambers | Anti-Masonic | 1832 | Re-elected | George Chambers (AM) 59.8% Ludwig Heck (J) 40.2% |
| Pennsylvania 13 | Jesse Miller | Jacksonian | 1832 | Re-elected | Jesse Miller (J) 51.4% Thomas Whiteside (AM) 48.6% |
| Pennsylvania 14 | Joseph Henderson | Jacksonian | 1832 | Re-elected | Joseph Henderson (J) 52.5% James Milliken (AM) 47.5% |
| Pennsylvania 15 | Andrew Beaumont | Jacksonian | 1832 | Re-elected | Andrew Beaumont (J) 56.1% Charles D. Shoemaker (?) 43.9% |
| Pennsylvania 16 | Joseph B. Anthony | Jacksonian | 1832 | Re-elected | Joseph B. Anthony (J) 62.8% Samuel J. Packer (?) 37.2% |
| Pennsylvania 17 | John Laporte | Jacksonian | 1832 | Re-elected | John Laporte (J) 56.8% Horrace Williston 43.2% |
| Pennsylvania 18 | George Burd | Anti-Jacksonian | 1830 | Retired Jacksonian gain |
Job Mann (J) 54.6% Charles Ogle (AM) 45.4% |
| Pennsylvania 19 | Richard Coulter | Jacksonian | 1826 | Lost re-election Jacksonian hold |
John Klingensmith, Jr. (J) 59.7% Richard Coulter (J) 40.3% |
| Pennsylvania 20 | Andrew Stewart | Anti-Masonic | 1820 1830 |
Lost re-election Jacksonian gain |
Andrew Buchanan (J) 58.9% Andrew Stewart (AM) 41.1% |
| Pennsylvania 21 | Thomas M. T. McKennan | Anti-Masonic | 1830 | Re-elected | Thomas M. T. McKennan (AM) 51.3% Thomas Ringland (J) 48.7% |
| Pennsylvania 22 | Harmar Denny | Anti-Masonic | 1829 (special) | Re-elected | Harmar Denny (AM) 53.5% John M. Snowden (J) 46.5% |
| Pennsylvania 23 | Samuel S. Harrison | Jacksonian | 1832 | Re-elected | Samuel S. Harrison (J) 69.9% John Gilmore (?) 30.1% |
| Pennsylvania 24 | John Banks | Anti-Masonic | 1830 | Re-elected | John Banks (AM) 52.2% Samuel Power (J) 47.8% |
| Pennsylvania 25 | John Galbraith | Jacksonian | 1832 | Re-elected | John Galbraith (J) 60.6% Thomas H. Sill (AM) 39.4% |
Two vacancies occurred in Pennsylvania's congressional representation during the 24th Congress. The first occurred in the 24th district when John Banks (AM) resigned on April 2, 1836, and was replaced in a special election by John J. Pearson (AJ). The second occurred in the 13th district when Jesse Miller (J) resigned on October 30, 1836, which vacancy was filled in a special election by James Black (J).
See also
Notes
- ↑ Excludes states admitted during the 24th Congress
- 1 2 3 Includes late elections
- 1 2 3 4 There are significant discrepancies among the sources, e.g. Dubin (pg. 113), Martis (pg. 93), and Moore (pg. 960-963), in regards to the party figures from the 1834 U.S. House elections (particularly on the number of Anti-Mason members (and which members were elected as Anti-Masons or not), and whether Dixon H. Lewis of AL-04 was a "Nullifier" or a Democrat), so deferring to Martis, pg. 93 (and "Party Divisions of the House of Representatives* 1789–Present". Office of the Historian, House of United States House of Representatives.) on the party figures for 1834.
- ↑ Includes 5 plural districts
- ↑ Includes 3 plural districts
- ↑ Includes 1 plural district
- 1 2 New state
- ↑ For plural districts, percent is based on assumption that each voter cast as many votes as there are seats
References
Bibliography
- Dubin, Michael J. (March 1, 1998). United States Congressional Elections, 1788-1997: The Official Results of the Elections of the 1st Through 105th Congresses. McFarland and Company. ISBN 978-0786402830.
- Martis, Kenneth C. (January 1, 1989). The Historical Atlas of Political Parties in the United States Congress, 1789-1989. Macmillan Publishing Company. ISBN 978-0029201701.
- Moore, John L., ed. (1994). Congressional Quarterly's Guide to U.S. Elections (Third ed.). Congressional Quarterly Inc. ISBN 978-0871879967.
- "Party Divisions of the House of Representatives* 1789–Present". Office of the Historian, House of United States House of Representatives. Retrieved January 21, 2015.
External links
- Office of the Historian (Office of Art & Archives, Office of the Clerk, U.S. House of Representatives)


