United States presidential election in Maine, 2000
| Elections in Maine |
|---|
 |
|
|
|
|
|
|
|
|
|
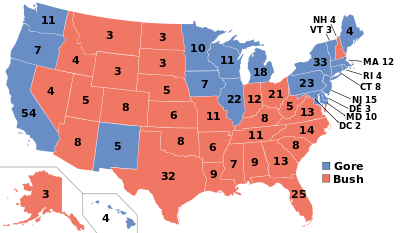
The 2000 United States presidential election in Maine took place on November 7, 2000 throughout all 50 states and D.C., which was part of the 2000 United States presidential election. Maine is one of two states in the U.S. that instead of all of the state's 4 electors of the Electoral College to vote based upon the statewide results of the voters, two of the individual electors vote based on their congressional district because Maine has two congressional districts. The other two electors vote based upon the statewide results.
Maine confirmed its status as a blue state, with Democratic nominee Vice President Al Gore carrying the state with 49.09% of the vote over Republican Governor of Texas George W. Bush, who received 43.97%.[1] Maine has voted Democratic since 1992, and is the only state other than Nebraska to split its electoral votes, doing so in the 2016 United States Presidential election, awarding one electoral vote from the second congressional district to Donald J Trump, the eventual winner of that election. The last time Maine went Republican was for George H. W. Bush and Dan Quayle in 1988.
Results
Statewide
Congressional District
[3]
Results Breakdown
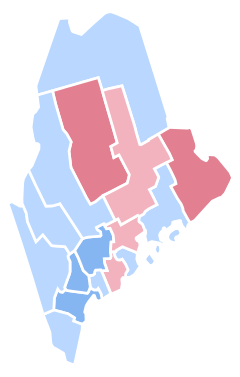
By county
| County |
Gore |
Votes |
Bush |
Votes |
Nader |
Votes |
Others |
Votes |
| Androscoggin |
53.3% |
26,251 |
40.5% |
19,948 |
4.8% |
2,388 |
1.3% |
658 |
| Aroostook |
48.9% |
17,196 |
47.1% |
16,555 |
3.0% |
1,055 |
1.0% |
337 |
| Cumberland |
52.0% |
74,203 |
41.0% |
58,543 |
6.0% |
8,576 |
0.9% |
1,298 |
| Franklin |
49.2% |
7,593 |
41.8% |
6,459 |
7.2% |
1,115 |
1.8% |
281 |
| Hancock |
45.4% |
12,983 |
44.6% |
12,732 |
8.8% |
2,513 |
1.2% |
346 |
| Kennebec |
53.0% |
31,198 |
40.7% |
23,967 |
5.0% |
2,955 |
1.3% |
787 |
| Knox |
46.1% |
9,453 |
43.7% |
8,968 |
8.8% |
1,810 |
1.3% |
270 |
| Lincoln |
43.9% |
8,634 |
48.1% |
9,457 |
6.7% |
1,323 |
1.3% |
257 |
| Oxford |
49.6% |
13,649 |
43.0% |
11,835 |
5.5% |
1,509 |
1.8% |
500 |
| Penobscot |
44.9% |
32,868 |
48.7% |
35,620 |
5.2% |
3,772 |
1.3% |
946 |
| Piscataquis |
40.5% |
3,745 |
52.3% |
4,845 |
5.1% |
471 |
2.1% |
195 |
| Sagadahoc |
48.0% |
8,844 |
43.7% |
8,052 |
6.9% |
1,278 |
1.3% |
232 |
| Somerset |
48.2% |
11,538 |
44.6% |
10,684 |
5.2% |
1,239 |
2.0% |
490 |
| Waldo |
44.3% |
8,477 |
45.4% |
8,689 |
8.8% |
1,690 |
1.5% |
282 |
| Washington |
42.7% |
6,701 |
50.7% |
7,958 |
5.1% |
802 |
1.6% |
247 |
| York |
49.3% |
46,618 |
44.7% |
42,304 |
4.9% |
4,631 |
1.1% |
997 |
References
See also
|
|---|
|
| Candidates | | |
|---|
|
General
articles | |
|---|
|
Local
results | |
|---|
|
Other 2000
elections | |
|---|