United States presidential election in Massachusetts, 2000
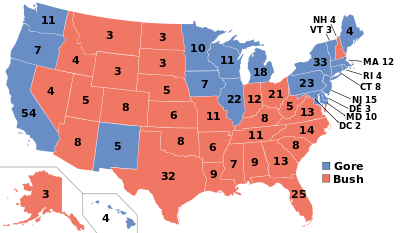
The 2000 United States presidential election in Massachusetts took place on November 7, 2000 throughout all 50 states and D.C., which was part of the 2000 United States presidential election. Voters chose 12 representatives, or electors to the Electoral College, who voted for President and Vice President.
Massachusetts is one of the most reliable blue states in the nation: no Republican has won the state since 1984. The 2000 Presidential election featured Democratic United States Vice President Al Gore versus Republican Texas Governor George W. Bush. Despite Bush's tight victory nationwide, Gore handily won Massachusetts, with a 27% margin of victory against George W. Bush who did not actively campaign there. Gore won every county and congressional district.
Results
| United States presidential election in Massachusetts, 2004 |
| Party |
Candidate |
Votes |
Percentage |
Electoral votes |
|
Democratic |
Al Gore |
1,616,487 |
59.80% |
12 |
|
Republican |
George W. Bush |
878,502 |
32.50% |
0 |
|
Green |
Ralph Nader |
173,564 |
6.42% |
0 |
|
Libertarian |
Harry Browne |
16,366 |
0.61% |
0 |
|
Reform |
Pat Buchanan |
11,149 |
0.41% |
0 |
|
Independent |
Others (Write-In) |
3,990 |
0.15% |
0 |
|
Independent (a) |
John Hagelin |
2,884 |
0.11% |
0 |
|
Socialist |
David McReynolds (Write-In) |
42 |
0.15% |
0 |
|
| Totals |
2,702,984 |
100.0% |
12 |
|}
(a) John Hagelin was the candidate of the Natural Law Party nationally.
Results breakdown
By county
Counties are listed in order of % of Gore vote: the last column shows the county winner in 1996 and the gain of the Democratic party between the two elections.
| County |
Albert Gore Jr. |
George W. Bush |
Ralph Nader |
Others |
1996 result |
| Suffolk |
71.4% |
154,888 |
20.5% |
44,441 |
6.9% |
15,051 |
1.2% |
2,620 |
−1.6 |
| Bristol |
64.5% |
136,325 |
29.7% |
62,848 |
4.5% |
9,554 |
1.2% |
2,610 |
+0.1 |
| Berkshire |
63.9% |
37,934 |
26.6% |
15,805 |
7.5% |
4,472 |
2.0% |
1,200 |
−0.8 |
| Dukes |
61.8% |
5,474 |
26.1% |
2,315 |
11.1% |
983 |
0.9% |
84 |
−4.9 |
| Middlesex |
61.5% |
404,043 |
30.3% |
198,914 |
6.9% |
45,529 |
1.3% |
8,562 |
−1.9 |
| Norfolk |
59.4% |
188,450 |
33.7% |
107,033 |
5.5% |
17,505 |
1.3% |
4,189 |
−0.7 |
| Nantucket |
58.3% |
2,874 |
33.0% |
1,624 |
7.7% |
378 |
1.0% |
50 |
−0.7 |
| Hampden |
58.2% |
100.103 |
34.6% |
59,558 |
6.0% |
10,326 |
1.2% |
2,106 |
−2.8 |
| Essex |
57.5% |
178,400 |
35.4% |
110,010 |
5.8% |
17,955 |
1.3% |
3,968 |
−1.2 |
| Hampshire |
56.2% |
38,543 |
28.0% |
19,202 |
14.6% |
10,010 |
1.3% |
871 |
−7.9 |
| Worcester |
56.0% |
173,679 |
36.8% |
114,139 |
5.9% |
18,177 |
1.3% |
4,063 |
−2.3 |
| Plymouth |
54.5% |
115,376 |
39.1% |
82,751 |
5.2% |
11,021 |
1.1% |
2,429 |
−0.2 |
| Franklin |
53.8% |
17,945 |
30.5% |
10,176 |
13.9% |
4,627 |
1.9% |
618 |
−6.5 |
| Barnstable |
51.5% |
62,363 |
41.0% |
49,686 |
6.6% |
7,976 |
0.9% |
1,061 |
−2.0 |
Results by municipality

Results by town
Gore – 80–90%
Gore – 70–80%
Gore – 60–70%
Gore – 50–60%
Gore – <50%
Bush – <50%
Bush – 50–60%
References
See also
|
|---|
|
| General | |
|---|
|
| Mass. Senate | |
|---|
|
| Mass. House | |
|---|
|
Governor
(with winners) | |
|---|
|
| Gov.'s Council |
- 2002
- 2006
- 2010
- 2012
- 2014
- 2016
|
|---|
|
| U.S. President | |
|---|
|
U.S. Senate
(with winners) | |
|---|
|
| U.S. House |
- 1788
- 1790
- 1792
- 1794
- 1796 [sp: 1st d., 10th d.]
- 1797 [sp: 11th d.]
- 1798
- 1800 [sp: 3rd d., 4th d., 10th d.]
- [[Massachusetts's 4th congressional district special election, 1801|1801 [sp: 4th d.]], 12th d., 14th d.]
- 1802
- 1804 [sp: 12th d.]
- 1806
- 1807 [sp: 12th d.]
- 1808 [sp: 2nd d.]
- 1810 [sp: 10th d., 11th d.]
- 1811 [sp: 4th d.]
- 1812 [sp: 17th d.]
- 1814 [sp: 4th d., 12th d.]
- 1816 [sp: 11th d.]
- 1817 [sp: 1st d.]
- 1818 [sp: 20th d.]
- 1820 [sp: 1st d., 8th d., 13th d.]
- 1822
- 1823 [sp: 10th d.]
- 1824 [sp: 10th d.]
- 1826
- 1828
- 1830
- 1832
- 1834
- 1836
- 1838
- 1840
- 1842
- 1844
- 1846
- 1848
- 1850
- 1852
- 1854
- 1856
- 1858
- 1860
- 1862
- 1864
- 1866
- 1868
- 1870
- 1872
- 1874
- 1876
- 1878
- 1880
- 1882
- 1884
- 1886
- 1888
- 1890
- 1892
- 1894
- 1896
- 1898
- 1900
- 1902
- 1904
- 1906
- 1908
- 1910
- 1912
- 1914
- 1916
- 1918
- 1920
- 1922
- 1924
- 1926
- 1928
- 1930
- 1932
- 1934
- 1936
- 1938
- 1940
- 1942
- 1944
- 1946
- 1948
- 1950
- 1952
- 1954
- 1956
- 1958
- 1960
- 1962
- 1964
- 1966
- 1968
- 1970
- 1972
- 1974
- 1976
- 1978
- 1980
- 1982
- 1984
- 1986
- 1988
- 1990
- 1992
- 1994
- 1996
- 1998
- 2000
- 2001 [sp: 9th d.]
- 2002
- 2004
- 2006
- 2007 [sp: 5th d.]
- 2008
- 2010
- 2012
- 2014
- 2016
|
|---|
|
|
|
|---|
|
| Candidates | | |
|---|
|
General
articles | |
|---|
|
Local
results | |
|---|
|
Other 2000
elections | |
|---|


