Virginia gubernatorial election, 2005
Virginia gubernatorial election, 2005
|
|
|
|
|
|
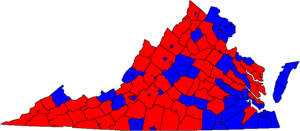
Virginia gubernatorial election results map.
Blue denotes counties/districts won by Kaine.
Red denotes those won by Kilgore. |
|
|
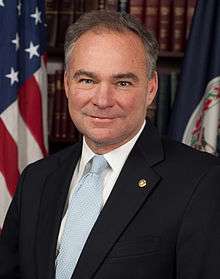
The Virginia gubernatorial election of 2005 was a race for the Governor of Virginia, United States, held on November 8, 2005, and won by Democrat Tim Kaine. Virginia is the only state in the United States to prohibit governors from serving successive terms, so the popular incumbent, Mark R. Warner, could not run for reelection.
Primary elections
Democratic Party
Republican Party
Republican primary results[2]
| Party |
Candidate |
Votes |
% |
|
Republican |
Jerry Kilgore |
145,002 |
82.78 |
|
Republican |
George Fitch |
30,168 |
17.22 |
| Total votes |
175,170 |
100.00 |
Independents
General election
Campaign
The general election itself was expected to be close with Independent candidate Russ Potts as a possible spoiler candidate. Kaine remained behind in polls throughout most of the campaign, at one point 10 points behind Kilgore, but captured a slight lead in the final weeks of the campaign. Kaine led in some polls for the first time in October 2005, and held his lead into the final week before the election.[3]
Kaine closely associated himself with popular outgoing Democratic Governor Mark Warner during his campaign; he won his race by a slightly larger margin than Warner. He promised homeowner tax relief, centrist fiscal leadership, and strong support for education.[4] A number of factors, from the sagging poll numbers of President George W. Bush to a public disgust over the death penalty ads run by Kilgore, have also been cited as key to his decisive win.[5][6]
The election was the most expensive in Virginia history, with the candidates combined raising over $42 million [7]
Opinion Polls
| Source |
Date |
Kaine (D) |
Kilgore (R) |
Potts (I) |
| Survey USA |
November 7, 2005 |
50% |
45% |
4% |
| Mason-Dixon |
November 4, 2005 |
45% |
44% |
4% |
| Rasmussen |
November 4, 2005 |
49% |
46% |
2% |
| Roanoke College |
November 2, 2005 |
44% |
36% |
5% |
| Washington Post |
October 30, 2005 |
47% |
44% |
4% |
| Rasmussen |
October 28, 2005 |
46% |
44% |
4% |
| Mason-Dixon |
October 25, 2005 |
42% |
44% |
5% |
| Rasmussen |
October 24, 2005 |
46% |
48% |
2% |
| Hotline |
October 18, 2005 |
40% |
38% |
5% |
| Survey USA |
October 17, 2005 |
47% |
45% |
4% |
| Rasmussen |
October 12, 2005 |
44% |
46% |
1% |
| Rasmussen |
September 28, 2005 |
45% |
45% |
5% |
| Survey USA |
September 19, 2005 |
43% |
46% |
4% |
| Mason-Dixon |
September 18, 2005 |
40% |
41% |
6% |
| Rasmussen |
September 16, 2005 |
40% |
43% |
5% |
| Survey USA |
August 9, 2005 |
43% |
48% |
3% |
| Rasmussen |
August 4, 2005 |
39% |
45% |
5% |
| Mason-Dixon |
July 24, 2005 |
38% |
37% |
9% |
| Rasmussen |
July 14, 2005 |
41% |
47% |
4% |
| Survey USA |
June 30, 2005 |
39% |
49% |
5% |
| Rasmussen |
June 16, 2005 |
40% |
46% |
2% |
| Survey USA |
May 17, 2005 |
40% |
44% |
5% |
|
Results
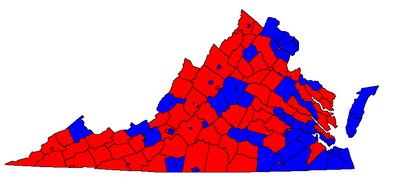
Majority results by county, with Kaine (Dem.) in blue and Kilgore (Rep.) in red.
While the previous Democratic Governor, Mark Warner, was credited with doing especially well for a Democrat in rural areas of the commonwealth, Kaine's win featured surprising triumphs in traditionally Republican areas such as Virginia Beach, Chesapeake, and the Northern Virginia suburbs of Prince William County and Loudoun County, as well as impressive showings in Democratic strongholds such as Richmond and Norfolk.[9]
Balance of power
See also
|
|---|
|
| Governors | |
|---|
|
| States and Territories | |
|---|
|
| Mayors |
- Allentown, PA
- Atlanta, GA
- Boston, MA
- Buffalo, NY
- Charlotte, NC
- Cincinnati, OH
- Cleveland, OH
- Detroit, MI
- Houston, TX
- Jersey City, NJ
- Minneapolis, MN
- Mobile, AL
- New York, NY
- Pittsburgh, PA
- Raleigh, NC
- San Diego, CA
- Seattle, WA
- St. Paul, MN
|
|---|
References
- ↑ Virginia Department of Elections (2016). "Registration/Turnout Statistics". The Commonwealth of Virginia. Retrieved July 25, 2016.
- ↑ http://www.sbe.virginia.gov/ElectionResults/2005/Junr2005Primary/index.htm
- ↑ VA: Kaine 49% Kilgore 46% – Rasmussen Reports, November 4, 2005
- ↑ Brodnitz, Pete. "Why Tim Kaine Won". www.bsgco.com. Retrieved 3 June 2016.
- ↑ "Death penalty demagoguery". (October 13, 2005). The Roanoke Times.
- ↑ "RealClear Politics – 2005 Virginia Gubernatorial Election". Retrieved November 4, 2005.
- ↑ "Virginia governor's race a costly one", (October 31, 2005) USA Today
- ↑ http://www.sbe.virginia.gov/Files/ElectionResults/2005/nov2005/html/
- ↑ Shear, Michael D. (October 18, 2005). "Kaine Sounds Slow-Growth Note in Exurbs". Washington Post.
External links
