Westmorland and Lonsdale (UK Parliament constituency)
Coordinates: 54°18′43″N 2°52′48″W / 54.312°N 2.880°W
| Westmorland and Lonsdale | |
|---|---|
|
County constituency for the House of Commons | |
|
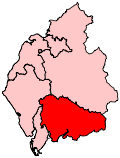
Boundary of Westmorland and Lonsdale in Cumbria. | |
|
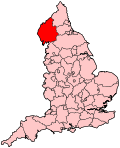
Location of Cumbria within England. | |
| County | Cumbria |
| Electorate | 66,609 (December 2010)[1] |
| Current constituency | |
| Created | 1983 |
| Member of parliament | Tim Farron (Liberal Democrat) |
| Number of members | One |
| Created from | Morecambe and Lonsdale and Westmorland |
| Overlaps | |
| European Parliament constituency | North West England |
Westmorland and Lonsdale is a constituency[n 1] represented in the House of Commons of the UK Parliament since 2005 by Tim Farron, the leader of the Liberal Democrats.
Boundaries
The constituency is based on the South Lakeland district of Cumbria. Important towns by size in the constituency include Kendal, Windermere and Kirkby Lonsdale.[n 2] It is named for the historic county of Westmorland and the Lancashire Hundred of Lonsdale. (The main part of that hundred is still part of Lancashire. However, Westmorland and Lonsdale contains not only the old Westmorland part of geographic Lonsdale, Kirkby Lonsdale, but also the detached part of the old Lancashire administrative hundred of Lonsdale in the Lake District, made up of old Furness and Cartmel, both of which are not geographically in the dale of the River Lune, or "Lonsdale".)
Boundary review
Following their review of parliamentary representation in Cumbria, the Boundary Commission for England created a modified Westmorland and Lonsdale constituency, to deal with population changes.
The electoral wards used to create the modified seat, contested for the first time at the 2010 general election, are entirely within the South Lakeland district.
- Arnside and Beetham, Burneside, Burton and Holme, Cartmel, Coniston, Crooklands, Grange, Hawkshead, Holker, Kendal Castle, Kendal Far Cross, Kendal Fell, Kendal Glebelands, Kendal Heron Hill, Kendal Highgate, Kendal Kirkland, Kendal Mintsfeet, Kendal Nether, Kendal Oxenholme, Kendal Parks, Kendal Stonecross, Kendal Strickland, Kendal Underley, Kirkby Lonsdale, Lakes Ambleside, Lakes Grasmere, Levens, Lyth Valley, Milnthorpe, Natland, Sedbergh, Staveley-in-Cartmel, Staveley-in-Westmorland, Whinfell, Windermere Applethwaite, Windermere Bowness North, Windermere Bowness South and Windermere Town[2]
This removed Broughton-in-Furness from the constituency.
History
Having been a Conservative seat since its creation in 1983, the 1997 election saw the Tory majority cut to less than 5,000 votes. This was further reduced at the 2001 election. In 2005, the constituency featured among a list of seats held by high-profile Conservatives (in this case, the Education spokesperson Tim Collins) targeted by Liberal Democrats by deploying supporters from across each region in what was referred in the media as a "decapitation strategy".[3] In the event, this was the only one of the "decapitation" seats to change hands in 2005, with Tim Farron gaining the seat by a marginal majority.
In the 2010 general election, this constituency recorded the largest swing from the Conservatives to the Liberal Democrats (11.1% Con-LD) in a seat where those two parties were in the top two positions. The constituency also produced the lowest share of the vote for Labour (2.2%, one of five lost deposits for Labour nationally). With 96.2% of votes cast for either the Conservative or Liberal Democrat candidates, Westmorland and Lonsdale also had the highest combined share of the vote cast for the Coalition parties.
Contrasting with its Conservative history the combined Conservative/UKIP vote narrowly failed to reach 40% in 2015. This was also the only constituency in that entire general election in which a Liberal Democrat candidate secured an absolute majority (i.e. over 50%) of all votes cast.
Members of Parliament
| Election | Member[4] | Party | |
|---|---|---|---|
| 1983 | Michael Jopling | Conservative | |
| 1997 | Tim Collins | Conservative | |
| 2005 | Tim Farron | Liberal Democrat | |
Elections
Elections in the 2010s
| Party | Candidate | Votes | % | ± | |
|---|---|---|---|---|---|
| Liberal Democrat | Tim Farron | 25,194 | 51.5 | −8.5 | |
| Conservative | Ann Myatt | 16,245 | 33.2 | −3.0 | |
| UKIP | Alan Piper | 3,031 | 6.2 | +4.6 | |
| Labour | John Bateson | 2,661 | 5.4 | +3.2 | |
| Green | Chris Loynes | 1,798 | 3.7 | N/A | |
| Majority | 8,949 | 18.3 | -5.5 | ||
| Turnout | 48,929 | 74.3 | -1.5 | ||
| Liberal Democrat hold | Swing | −2.75 | |||
| Party | Candidate | Votes | % | ± | |
|---|---|---|---|---|---|
| Liberal Democrat | Tim Farron | 30,896 | 60.0 | +14.1 | |
| Conservative | Gareth McKeever | 18,632 | 36.2 | −8.1 | |
| Labour | Jonathan Todd | 1,158 | 2.2 | −5.6 | |
| UKIP | John Mander | 801 | 1.6 | +0.2 | |
| Majority | 12,264 | 23.8 | +23.3 | ||
| Turnout | 51,487 | 75.8 | +5.1 | ||
| Liberal Democrat hold | Swing | +11.1 | |||
Elections in the 2000s
| Party | Candidate | Votes | % | ± | |
|---|---|---|---|---|---|
| Liberal Democrat | Tim Farron | 22,569 | 45.5 | +5.1 | |
| Conservative | Tim Collins | 22,302 | 44.9 | −2.0 | |
| Labour | John Reardon | 3,796 | 7.6 | −3.3 | |
| UKIP | Robert Gibson | 660 | 1.3 | +0.1 | |
| Independent | Anthony Kemp | 309 | 0.6 | N/A | |
| Majority | 267 | 0.5 | |||
| Turnout | 49,636 | 71.6 | +3.8 | ||
| Liberal Democrat gain from Conservative | Swing | +3.5 | |||
| Party | Candidate | Votes | % | ± | |
|---|---|---|---|---|---|
| Conservative | Tim Collins | 22,486 | 46.9 | +4.7 | |
| Liberal Democrat | Tim Farron | 19,339 | 40.4 | +7.0 | |
| Labour | John Anthony Bateson | 5,234 | 10.9 | −9.7 | |
| UKIP | Robert Gibson | 552 | 1.2 | N/A | |
| Independent | Timothy John Bell | 292 | 0.6 | N/A | |
| Majority | 3,147 | 6.5 | |||
| Turnout | 47,903 | 67.8 | −6.2 | ||
| Conservative hold | Swing | −1.2 | |||
Elections in the 1990s
| Party | Candidate | Votes | % | ± | |
|---|---|---|---|---|---|
| Conservative | Tim Collins | 21,463 | 42.3 | −14.6 | |
| Liberal Democrat | Stanley Bernard Collins | 16,942 | 33.4 | +5.9 | |
| Labour | John Harding | 10,452 | 20.6 | +5.5 | |
| Referendum | Michael H. Smith | 1,924 | 3.8 | N/A | |
| Majority | 4,521 | 9.0 | |||
| Turnout | 50,781 | 74.1 | |||
| Conservative hold | Swing | −10.3 | |||
| Party | Candidate | Votes | % | ± | |
|---|---|---|---|---|---|
| Conservative | Michael Jopling | 31,798 | 56.9 | −0.7 | |
| Liberal Democrat | Stanley Bernard Collins | 15,362 | 27.5 | −1.7 | |
| Labour | Dickon J. Abbott | 8,436 | 15.1 | +1.9 | |
| Natural Law | Robert Johnstone | 287 | 0.5 | N/A | |
| Majority | 16,436 | 29.4 | +1.0 | ||
| Turnout | 55,883 | 77.8 | −3.0 | ||
| Conservative hold | Swing | +0.5 | |||
Elections in the 1980s
| Party | Candidate | Votes | % | ± | |
|---|---|---|---|---|---|
| Conservative | Michael Jopling | 30,259 | 57.6 | −3.7 | |
| Liberal | Stanley Bernard Collins | 15,339 | 29.2 | +2.1 | |
| Labour | Shaun Patrick Halfpenny | 6,968 | 13.2 | +3.3 | |
| Majority | 14,920 | 28.4 | |||
| Turnout | 52,566 | 74.8 | |||
| Conservative hold | Swing | −2.9 | |||
| Party | Candidate | Votes | % | ± | |
|---|---|---|---|---|---|
| Conservative | Michael Jopling | 29,775 | 61.3 | N/A | |
| Liberal | Dr. Ken Hulls | 13,188 | 27.1 | N/A | |
| Labour | Chris Stott | 4,798 | 9.9 | N/A | |
| Ecology | Robert Anthony Gibson | 805 | 1.7 | N/A | |
| Majority | 16,587 | 34.2 | N/A | ||
| Turnout | 48,566 | 72.3 | N/A | ||
| Conservative win (new seat) | |||||
See also
Notes and references
- Notes
- ↑ A county constituency (for the purposes of election expenses and type of returning officer)
- ↑ The area does not include the whole historic county of Westmorland, particularly lacking the county town Appleby-in-Westmorland.
- References
- ↑ "Electorate Figures - Boundary Commission for England". 2011 Electorate Figures. Boundary Commission for England. 4 March 2011. Retrieved 13 March 2011.
- ↑ "2010 post-revision map non-metropolitan areas and unitary authorities of England" (PDF). Retrieved 2016-08-12.
- ↑ Senior Tories Avoid LibDem "decaptitation" The Evening Standard 6 May 2005
- ↑ Leigh Rayment's Historical List of MPs – Constituencies beginning with "W" (part 3)
- ↑ "Election Data 2015". Electoral Calculus. Archived from the original on 17 October 2015. Retrieved 17 October 2015.
- ↑ "Westmorland & Lonsdale". BBC News. Retrieved 11 May 2015.
- ↑ "Election Data 2010". Electoral Calculus. Archived from the original on 17 October 2015. Retrieved 17 October 2015.
- ↑ Westmorland and Lonsdale Conservatives, Westmorland and Lonsdale Conservatives
- ↑ "Election Data 2005". Electoral Calculus. Archived from the original on 15 October 2011. Retrieved 18 October 2015.
- ↑ "Election Data 2001". Electoral Calculus. Archived from the original on 15 October 2011. Retrieved 18 October 2015.
- ↑ "Election Data 1997". Electoral Calculus. Archived from the original on 15 October 2011. Retrieved 18 October 2015.
- ↑ "Election Data 1992". Electoral Calculus. Archived from the original on 15 October 2011. Retrieved 18 October 2015.
- ↑ "UK General Election results April 1992". Richard Kimber's Political Science Resources. Politics Resources. 9 April 1992. Retrieved 2010-12-06.
- ↑ "Election Data 1987". Electoral Calculus. Archived from the original on 15 October 2011. Retrieved 18 October 2015.
- ↑ "Election Data 1983". Electoral Calculus. Archived from the original on 15 October 2011. Retrieved 18 October 2015.