Derbyshire County Council election, 2013
|
|
|
|
|
|
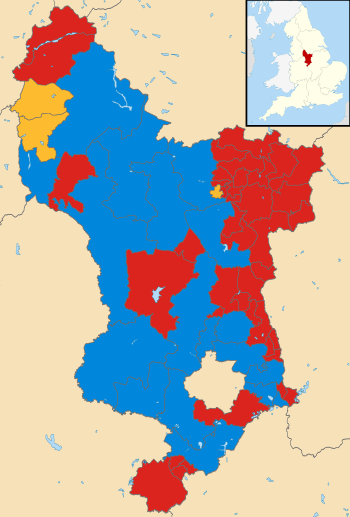
| Map showing the results of the 2013 Derbyshire County Council elections. |
|
|
An election to Derbyshire County Council took place on 2 May 2013 as part of the United Kingdom local elections, 2013. Following the final draft of the 2012 electoral review, 64 councillors were elected from 61 electoral divisions which returned either one or two county councillors each by first-past-the-post voting for a four-year term of office.[1] No elections were held in the City of Derby, which is a unitary authority outside the area covered by the County Council. The Labour Party won back control of the council by a landslide victory, taking forty-two of the authority's sixty-four seats.
All locally registered electors (British, Irish, Commonwealth and European Union citizens) who were aged 18 or over on Thursday 2 May 2013 were entitled to vote in the local elections. Those who were temporarily away from their ordinary address (for example, away working, on holiday, in student accommodation or in hospital) were also entitled to vote in the local elections,[2] although those who had moved abroad and registered as overseas electors cannot vote in the local elections. It is possible to register to vote at more than one address (such as a university student who had a term-time address and lives at home during holidays) at the discretion of the local Electoral Register Office, but it remains an offence to vote more than once in the same local government election.[3]
Background
The previous election ended 28 years of Labour control, giving the Conservatives an overall majority of two seats and control of the council. However, their majority was eroded by the suspension and defection of two Conservative councillors, leaving the council hung.[4][5][6]
Election results
| Derbyshire County Council Election Overall Result 2013 |
| Party |
Seats |
Gains |
Losses |
Net gain/loss |
Seats % |
Votes % |
Votes |
+/− |
| |
Labour |
43 |
|
|
+18 |
67.2 |
42.84 |
87,020 |
|
| |
Conservative |
18 |
|
|
-13 |
28.1 |
28.81 |
58,507 |
|
| |
Liberal Democrat |
3 |
|
|
-4 |
4.7 |
7.57 |
15,379 |
|
| |
UKIP |
0 |
|
|
|
0 |
18.71 |
37,997 |
|
| |
Others |
0 |
|
|
|
0 |
2.07 |
4,209 |
|
Derbyshire County Council – Results by District
Amber Valley Borough
(10 seats, 9 electoral divisions)
| Amber Valley Borough Summary Result 2013 |
| Party |
Seats |
Gains |
Losses |
Net gain/loss |
Seats % |
Votes % |
Votes |
+/− |
| |
Labour |
7 |
|
|
|
70 |
43.2 |
16,033 |
|
| |
Conservative |
3 |
|
|
|
30 |
31.6 |
11,755 |
|
| |
UKIP |
0 |
|
|
|
0 |
17.7 |
6,578 |
|
| |
Liberal Democrat |
0 |
|
|
|
0 |
4.0 |
1,498 |
|
| |
BNP |
0 |
|
|
|
0 |
1.9 |
720 |
|
| |
Others |
0 |
|
|
|
0 |
1.1 |
415 |
|
| |
Green |
0 |
|
|
|
0 |
0.4 |
145 |
|
Alfreton and Somercotes
Alport and Derwent
Alport & Derwent (1 seat)
| Party |
Candidate |
Votes |
% |
|
Conservative |
Martin Tomlinson (E) |
1,558 |
42.3 |
|
UKIP |
Ashley John Harrison |
936 |
25.4 |
|
Labour |
Mark Grayling |
894 |
24.3 |
|
Liberal Democrat |
Ollie Smith |
295 |
8.0 |
| Voter turnout |
38% |
Belper
Belper (1 seat)
| Party |
Candidate |
Votes |
% |
|
Labour |
John Robert Owen (E) |
1,169 |
39.3 |
|
Conservative |
Peter Makin |
981 |
33.0 |
|
UKIP |
Roy Wilford Snape |
642 |
21.6 |
|
Liberal Democrat |
Jane Vivlenne Benson |
182 |
6.1 |
| Voter turnout |
33% |
Duffield and Belper South
Duffield & Belper South (1 seat)
| Party |
Candidate |
Votes |
% |
|
Conservative |
Stuart John Bradford (E) |
1,340 |
43.8 |
|
Labour |
Ben Rupert Edward Bellamy |
831 |
27.2 |
|
UKIP |
Barry Simpson Clark |
656 |
21.4 |
|
Liberal Democrat |
Jeremy Richard Benson |
233 |
7.6 |
| Voter turnout |
33% |
Greater Heanor
Greater Heanor (1 seat)
| Party |
Candidate |
Votes |
% |
|
Labour |
Paul Jones (E) |
1,383 |
51.4 |
|
Conservative |
Kevin Lee Parkinson |
877 |
32.6 |
|
BNP |
Cliff Roper |
336 |
12.5 |
|
Liberal Democrat |
Keith Charles Falconbridge |
97 |
3.6 |
| Voter turnout |
28% |
Heanor Central
Heanor Central (1 seat)
| Party |
Candidate |
Votes |
% |
|
Labour |
Celia Mary Cox (E) |
1,454 |
46.8 |
|
Conservative |
Alex Stevenson |
780 |
25.1 |
|
UKIP |
Kenneth John Clifford |
701 |
22.6 |
|
BNP |
Adrian Barry Hickman |
171 |
5.5 |
| Voter turnout |
33% |
Horsley
Horsley (1 seat)
| Party |
Candidate |
Votes |
% |
|
Conservative |
Kevin Buttery (E) |
1,463 |
41.8 |
|
Labour |
John Philip Banks |
1,038 |
29.7 |
|
UKIP |
Wayne Porter |
864 |
24.7 |
|
Liberal Democrat |
Kate Smith |
135 |
3.9 |
| Voter turnout |
35% |
Ripley East and Codnor
Ripley East & Codnor (1 seat)
| Party |
Candidate |
Votes |
% |
|
Labour |
Steve Freeborn (E) |
1,523 |
44.0 |
|
Conservative |
Stuart Joynes |
967 |
28.0 |
|
UKIP |
Ann Fox |
799 |
23.1 |
|
BNP |
Alan Edwards |
89 |
2.6 |
|
Liberal Democrat |
Margaret Tomkins |
79 |
2.3 |
| Voter turnout |
34% |
Ripley West and Heage
Ripley West & Heage (1 seat)
| Party |
Candidate |
Votes |
% |
|
Labour |
David Alan Williams (E) |
1,618 |
39.7 |
|
Conservative |
David Wilson |
1,195 |
29.3 |
|
UKIP |
Philip Sanders Rose |
970 |
23.8 |
|
Green |
Tony Youens |
145 |
3.6 |
|
Liberal Democrat |
Paul Robin Gibbons |
83 |
2.0 |
|
BNP |
Ken Cooper |
64 |
1.6 |
| Voter turnout |
39% |
Bolsover District
(6 seats, 6 electoral divisions)
Barlborough and Clowne
Barlborough & Clowne (1 seat)
| Party |
Candidate |
Votes |
% |
|
Labour |
Anne Western (E) |
1,519 |
61.7 |
|
UKIP |
Scott Richard Goring |
526 |
21.4 |
|
Conservative |
David Thomas Jackson |
419 |
17.0 |
| Voter turnout |
28% |
Bolsover North
Bolsover South
Shirebrook and Pleasley
South Normanton and Pinxton
Tibshelf
Tibshelf (1 seat)
| Party |
Candidate |
Votes |
% |
|
Labour |
Clive Richard Moesby (E) |
1,603 |
59.7 |
|
UKIP |
Joan Bentley |
640 |
23.8 |
|
Conservative |
Heather Kay Liggett |
444 |
16.5 |
| Voter turnout |
27% |
Chesterfield Borough
(9 seats, 9 electoral divisions)
| Chesterfield Borough Summary Result 2013 |
| Party |
Seats |
Gains |
Losses |
Net gain/loss |
Seats % |
Votes % |
Votes |
+/− |
| |
Labour |
8 |
|
|
|
89 |
51 |
13432 |
|
| |
Liberal Democrat |
1 |
|
|
|
11 |
20.9 |
5490 |
|
| |
UKIP |
0 |
|
|
|
0 |
13.8 |
3631 |
|
| |
Conservative |
0 |
|
|
|
0 |
10.3 |
2710 |
|
| |
Others |
0 |
|
|
|
0 |
4 |
1057 |
|
Birdholme
Birdholme (1 seat)
| Party |
Candidate |
Votes |
% |
|
Labour |
Dave Allen (E) |
1,792 |
70.6 |
|
Conservative |
James Michael Dietsch |
376 |
14.8 |
|
Liberal Democrat |
Bridget Anne Dunks |
371 |
14.6 |
| Voter turnout |
28% |
Boythorpe and Brampton South
Boythorpe & Brampton South (1 seat)
| Party |
Candidate |
Votes |
% |
|
Labour |
Ron Mihaly (E) |
1,300 |
46.0 |
|
Liberal Democrat |
Keith Falconer |
932 |
33.0 |
|
UKIP |
Sharon Buxton |
414 |
14.6 |
|
Conservative |
Marcus Stanton Linsey |
183 |
6.5 |
| Voter turnout |
34% |
Brimington
Loundsley Green and Newbold
Loundsley Green & Newbold (1 seat)
| Party |
Candidate |
Votes |
% |
|
Labour |
Stuart Brittain (E) |
1,429 |
40.5 |
|
Liberal Democrat |
Tony Rogers |
1,124 |
31.4 |
|
UKIP |
Keith Lomas |
677 |
18.9 |
|
Independent |
Mick Bagshaw |
181 |
5.1 |
|
Conservative |
Nigel Robert Sterland |
167 |
4.7 |
| Voter turnout |
41% |
Spire
Spire (1 seat)
| Party |
Candidate |
Votes |
% |
|
Labour |
Sharon Lesley Blank (E) |
1,292 |
55.6 |
|
UKIP |
Stuart David Yeowart |
420 |
18.1 |
|
Independent |
Adrian Mather |
272 |
11.7 |
|
Liberal Democrat |
Maggie Cannon |
190 |
8.2 |
|
Conservative |
Simon John Temperton |
148 |
6.4 |
| Voter turnout |
29% |
St Mary's
Staveley
Staveley North and Whittington
Staveley North & Whittington (1 seat)
| Party |
Candidate |
Votes |
% |
|
Labour |
Dean Collins (E) |
1,307 |
40.5 |
|
Liberal Democrat |
Barry Bingham |
972 |
30.1 |
|
UKIP |
Richard Bexton |
829 |
25.7 |
|
Conservative |
Malcolm Benjamin Rowley |
119 |
3.7 |
| Voter turnout |
33% |
Walton and West
Walton & West (1 seat)
| Party |
Candidate |
Votes |
% |
|
Liberal Democrat |
Keith Patrick Morgan (E) |
1,079 |
30.8 |
|
Labour |
Martin Michael Stone |
962 |
27.5 |
|
Conservative |
John David Lee Boult |
936 |
26.7 |
|
UKIP |
Kevin Coney |
528 |
15.1 |
| Voter turnout |
42% |
Derbyshire Dales District
(6 seats, 6 electoral divisions)
| Derbyshire Dales District Summary Result 2013 |
| Party |
Seats |
Gains |
Losses |
Net gain/loss |
Seats % |
Votes % |
Votes |
+/− |
| |
Conservative |
4 |
|
|
|
67 |
36.8 |
7627 |
|
| |
Labour |
2 |
|
|
|
33 |
29.8 |
6190 |
|
| |
UKIP |
0 |
|
|
|
0 |
20.1 |
4171 |
|
| |
Liberal Democrat |
0 |
|
|
|
0 |
11.3 |
2346 |
|
| |
Green |
0 |
|
|
|
0 |
2.0 |
418 |
|
Ashbourne
Ashbourne (1 seat)
| Party |
Candidate |
Votes |
% |
|
Conservative |
Andrew Iain Lewer (E) |
1,985 |
59.1 |
|
UKIP |
Leonie Staimar |
665 |
19.8 |
|
Labour |
Matthew Gareth Jones |
420 |
12.5 |
|
Liberal Democrat |
Rebecca Goodall |
290 |
8.6 |
| Voter turnout |
36% |
Bakewell
Bakewell (1 seat)
| Party |
Candidate |
Votes |
% |
|
Conservative |
Judith Anne Twigg (E) |
1,937 |
50.0 |
|
Labour |
David Hill |
793 |
20.5 |
|
UKIP |
Philip Robinson |
751 |
19.4 |
|
Liberal Democrat |
Eleanor Nancolas |
394 |
10.2 |
| Voter turnout |
39% |
Derwent Valley
Derwent Valley (1 seat)
| Party |
Candidate |
Votes |
% |
|
Conservative |
Michael Vernon Longden (E) |
1,674 |
42.8 |
|
UKIP |
Michael Hancocks |
944 |
24.2 |
|
Labour |
Paul Vaughan |
904 |
23.1 |
|
Liberal Democrat |
Sandra Fearn |
387 |
9.9 |
| Voter turnout |
41% |
Dovedale
Dovedale (1 seats)
| Party |
Candidate |
Votes |
% |
|
Conservative |
Simon Andrew Spencer (E) |
1,473 |
42.0 |
|
Labour |
Colin Swindell |
1,198 |
34.1 |
|
UKIP |
Sarah Elizabeth King |
527 |
15.0 |
|
Green |
John Robin Youatt |
186 |
5.3 |
|
Liberal Democrat |
Trish Birchley |
125 |
3.6 |
| Voter turnout |
37% |
Matlock
Matlock (1 seats)
| Party |
Candidate |
Votes |
% |
|
Labour |
Andy Botham (E) |
1,114 |
29.6 |
|
Conservative |
Geoff Stevens |
1,092 |
29.0 |
|
Liberal Democrat |
Steve Flitter |
1,028 |
27.3 |
|
UKIP |
Tilly Sanders Ward |
529 |
14.1 |
| Voter turnout |
42% |
Wirksworth
Wirksworth (1 seat)
| Party |
Candidate |
Votes |
% |
|
Labour |
Irene Ratcliffe (E) |
1,761 |
41.2 |
|
Conservative |
Richard Bright |
1,403 |
32.8 |
|
UKIP |
Chris Wardle |
755 |
17.7 |
|
Green |
Christopher Spencer |
232 |
5.4 |
|
Liberal Democrat |
David Jones |
122 |
2.9 |
| Voter turnout |
42% |
Erewash Borough
(9 seats, 9 electoral divisions)
Breadsall and West Hallam
Breadsall & West Hallam (1 seat)
| Party |
Candidate |
Votes |
% |
|
Conservative |
Carol Ann Hart (E) |
1,616 |
49.5 |
|
Labour |
Linda McGraw |
791 |
24.3 |
|
UKIP |
Alan Sidney Rose |
604 |
18.5 |
|
Green |
Jeannie Elizabeth Alderdice |
170 |
5.2 |
|
Liberal Democrat |
Kristopher James Watts |
81 |
2.5 |
| Voter turnout |
34.9% |
Breaston
Breaston (1 seat)
| Party |
Candidate |
Votes |
% |
|
Conservative |
Robert Alan Parkinson (E) |
1,481 |
38.6 |
|
UKIP |
Caroline Susan Gent |
1,134 |
29.6 |
|
Labour |
Louis Booth |
1,050 |
27.4 |
|
Liberal Democrat |
Martin Charles Garnett |
172 |
4.5 |
| Voter turnout |
36.8% |
Ilkeston East
Ilkeston South
Ilkeston South (1 seat)
| Party |
Candidate |
Votes |
% |
|
Labour |
John Arnold Fudd (E) |
1,279 |
49.2 |
|
UKIP |
Giles Farrand |
861 |
33.1 |
|
Conservative |
Richard Harris |
406 |
15.6 |
|
Liberal Democrat |
Fiona Aanonson |
56 |
2.2 |
| Voter turnout |
28.6% |
Ilkeston West
Ilkeston West (1 seat)
| Party |
Candidate |
Votes |
% |
|
Labour |
Michelle Wendy Booth (E) |
1,344 |
44.5 |
|
Conservative |
Val Custance |
942 |
31.2 |
|
UKIP |
Jamie Parker |
537 |
17.8 |
|
Green |
Philip Hood |
113 |
3.7 |
|
Liberal Democrat |
Angela Togni |
84 |
2.8 |
| Voter turnout |
32.4% |
Long Eaton
Long Eaton (1 seat)
| Party |
Candidate |
Votes |
% |
|
Labour |
Roland Leon Hosker (E) |
1,384 |
45.7 |
|
Conservative |
Kewal Singh Athwal |
978 |
32.3 |
|
UKIP |
Bexley Sears |
503 |
16.6 |
|
Liberal Democrat |
Susannah Louise Watts |
161 |
5.3 |
| Voter turnout |
31.9% |
Petersham
Petersham (1 seat)
| Party |
Candidate |
Votes |
% |
|
Labour |
Clare Elaine Neill (E) |
1,237 |
41.2 |
|
Conservative |
Garry Keith Hickton |
854 |
28.4 |
|
UKIP |
Wg Cdr Mike Clulow |
620 |
20.6 |
|
Liberal Democrat |
Ian Allan Neill |
295 |
9.8 |
| Voter turnout |
30.8% |
Sandiacre
Sandiacre (1 seat)
| Party |
Candidate |
Votes |
% |
|
Conservative |
Wayne Major (E) |
1,548 |
46.0 |
|
Labour |
Patrick Martin Pritchett |
969 |
28.8 |
|
UKIP |
Mark Robert Willis |
644 |
19.1 |
|
Liberal Democrat |
Martin Lowe |
208 |
6.2 |
| Voter turnout |
36.2% |
Sawley
Sawley (1 seat)
| Party |
Candidate |
Votes |
% |
|
Conservative |
Daniel Walton (E) |
1,352 |
40.5 |
|
Labour |
Bob Knight |
1,157 |
34.6 |
|
UKIP |
Simon Nicholas Gent |
659 |
19.7 |
|
Liberal Democrat |
Rodney Wilby Allen |
173 |
5.2 |
| Voter turnout |
35.1% |
High Peak Borough
(8 seats, 7 electoral divisions)
| High Peak Borough Summary Result 2013 |
| Party |
Seats |
Gains |
Losses |
Net gain/loss |
Seats % |
Votes % |
Votes |
+/− |
| |
Labour |
4 |
|
|
|
62.5 |
38.9 |
11266 |
|
| |
Conservative |
2 |
|
|
|
25 |
32.8 |
9557 |
|
| |
Liberal Democrat |
2 |
|
|
|
12.5 |
11.9 |
3452 |
|
| |
UKIP |
0 |
|
|
|
0 |
8.9 |
2593 |
|
| |
Green |
0 |
|
|
|
0 |
5.1 |
1487 |
|
| |
Others |
0 |
|
|
|
0 |
2.7 |
771 |
|
Buxton North and East
Buxton North & East (1 seat)
| Party |
Candidate |
Votes |
% |
|
Labour |
Caitlin Janette Bisknell (E) |
1,138 |
45.3 |
|
Conservative |
Pam Reddy |
795 |
31.7 |
|
UKIP |
Margaret Florence Appleby |
495 |
19.7 |
|
Liberal Democrat |
Graham Scott |
84 |
3.3 |
| Voter turnout |
28% |
Buxton West
Buxton West (1 seat)
| Party |
Candidate |
Votes |
% |
|
Conservative |
Tony Arthur Kemp (E) |
1,123 |
35.6 |
|
Labour |
Fiona Sloman |
952 |
30.2 |
|
Independent |
Bob Morris |
771 |
24.4 |
|
Green |
Matthew Alexander Bain |
219 |
6.9 |
|
Liberal Democrat |
Christopher Richard Warhurst Weaver |
90 |
2.9 |
| Voter turnout |
33% |
Chapel and Hope Valley
Chapel & Hope Valley (1 seat)
| Party |
Candidate |
Votes |
% |
|
Conservative |
Jocelyn Sarah Street (E) |
1,441 |
42.1 |
|
Labour |
Tim Norton |
897 |
26.2 |
|
UKIP |
Ian Guiver |
586 |
17.1 |
|
Green |
Charlotte Nancy Farrell |
349 |
10.2 |
|
Liberal Democrat |
Brian Colin Hallsworth |
149 |
4.4 |
| Voter turnout |
37% |
Etherow
Glossop and Charlesworth
Glossop & Charlesworth (2 seats)
| Party |
Candidate |
Votes |
% |
|
Labour |
Damien Thomas Greenhalgh (E) |
2,432 |
22.0 |
|
Labour |
Ellie Wilcox (E) |
2,403 |
21.7 |
|
Conservative |
Jean Wharmby |
1,939 |
17.5 |
|
Conservative |
George David Wharmby |
1,906 |
17.2 |
|
UKIP |
David Phillips |
1,088 |
9.8 |
|
Green |
Peter Duncan Allen |
682 |
6.2 |
|
Liberal Democrat |
Stephen David Worrall |
355 |
3.2 |
|
Liberal Democrat |
George Kuppan |
248 |
2.2 |
| Voter turnout |
33.1% |
New Mills
Whaley Bridge
Whaley Bridge (1 seat)
| Party |
Candidate |
Votes |
% |
|
Liberal Democrat |
David William Lomax (E) |
995 |
31.6 |
|
Conservative |
Rodney Bruce Gilmour |
878 |
27.9 |
|
Labour |
Martin Lindsay Thomas |
846 |
26.9 |
|
UKIP |
James Henry Bush |
424 |
13.5 |
| Voter turnout |
38% |
North East Derbyshire District
(8 seats, 7 electoral divisions)
| North East Derbyshire District Summary Result 2013 |
| Party |
Seats |
Gains |
Losses |
Net gain/loss |
Seats % |
Votes % |
Votes |
+/− |
| |
Labour |
6 |
|
|
|
75 |
50.1 |
13835 |
|
| |
Conservative |
2 |
|
|
|
25 |
25.6 |
7061 |
|
| |
UKIP |
0 |
|
|
|
0 |
20.2 |
5562 |
|
| |
Liberal Democrat |
0 |
|
|
|
0 |
2.2 |
607 |
|
| |
Others |
0 |
|
|
|
0 |
1.9 |
527 |
|
Clay Cross North
Clay Cross North (1 seat)
| Party |
Candidate |
Votes |
% |
|
Labour |
Brian Wright (E) |
1,737 |
73.4 |
|
Conservative |
Linda Rowley |
630 |
26.6 |
| Voter turnout |
% |
Clay Cross South
Clay Cross South (1 seat)
| Party |
Candidate |
Votes |
% |
|
Labour |
Kevin Gillott (E) |
1,909 |
67.2 |
|
Conservative |
William Armitage |
541 |
19.0 |
|
Independent |
Morgan Howells |
391 |
13.8 |
| Voter turnout |
% |
Dronfield East
Dronfield East(1 seat)
| Party |
Candidate |
Votes |
% |
|
Labour |
Janet Hill (E) |
1,238 |
38.8 |
|
Conservative |
Angelique Foster |
1,087 |
34.1 |
|
UKIP |
Roderick Bernard Arundale Harrison |
521 |
16.3 |
|
Liberal Democrat |
Simon Philip Temple |
206 |
6.5 |
|
Independent |
Clive Gill |
136 |
4.3 |
| Voter turnout |
% |
Dronfield West and Walton
Dronfield West & Walton (1 seat)
| Party |
Candidate |
Votes |
% |
|
Conservative |
Stuart Ellis (E) |
1,312 |
35.7 |
|
UKIP |
Adrian Lewis Clarke |
1,139 |
31.0 |
|
Labour |
Michael Gordon |
820 |
22.3 |
|
Liberal Democrat |
Wendy Mary Temple |
401 |
10.9 |
| Voter turnout |
% |
Eckington and Killamarsh
Eckington & Killamarsh (2 seats)
| Party |
Candidate |
Votes |
% |
|
Labour |
Diane Charles (E) |
2,507 |
28.1 |
|
Labour |
Brian Ridgway (E) |
2,436 |
27.3 |
|
UKIP |
Charles David Rae Watson |
1,262 |
14.5 |
|
UKIP |
David Stanley Rae Watson |
1,065 |
11.9 |
|
Conservative |
Lewis James Blackburn |
843 |
9.5 |
|
Conservative |
Roger Anthony Hall |
813 |
9.1 |
| Voter turnout |
% |
Sutton
Sutton (1 seat)
| Party |
Candidate |
Votes |
% |
|
Labour |
Julie Ann Hill (E) |
1,726 |
60.8 |
|
UKIP |
Glen John Potter |
801 |
28.2 |
|
Conservative |
Charlotte Cupit |
312 |
11.0 |
| Voter turnout |
% |
Wingerworth and Shirland
Wingerworth & Shirland (1 seat)
| Party |
Candidate |
Votes |
% |
|
Conservative |
Barry Lewis (E) |
1,523 |
40.5 |
|
Labour |
Barry Herbert Barnes |
1,462 |
38.9 |
|
UKIP |
Alan Randall |
774 |
20.6 |
| Voter turnout |
% |
South Derbyshire District
(8 seats, 8 electoral divisions)
Aston
Aston(1 seat)
| Party |
Candidate |
Votes |
% |
|
Labour |
Robert Davison (E) |
1,279 |
37.1 |
|
UKIP |
Alan Wayne Graves |
1,120 |
32.5 |
|
Conservative |
Chris Pratt |
968 |
28.1 |
|
Liberal Democrat |
Kevin John Maher |
83 |
2.4 |
| Voter turnout |
40% |
Etwall and Repton
Etwall & Repton (1 seat)
| Party |
Candidate |
Votes |
% |
|
Conservative |
Martyn Ford (E) |
1,775 |
52.7 |
|
UKIP |
Martin Ashley Bardoe |
816 |
24.2 |
|
Labour |
Brian John Cox |
685 |
20.4 |
|
Liberal Democrat |
Christopher Simon Collard |
92 |
2.7 |
| Voter turnout |
35% |
Hilton
Hilton (1 seat)
| Party |
Candidate |
Votes |
% |
|
Conservative |
Julie Elizabeth Patten (E) |
1,353 |
51.4 |
|
Labour |
Steve Cooper |
608 |
23.1 |
|
UKIP |
Eric Peter Wayne Graves |
473 |
18.0 |
|
Independent |
Timothy Noel Robinson |
135 |
5.1 |
|
Liberal Democrat |
Alexis Saliou Diouf |
63 |
2.4 |
| Voter turnout |
28% |
Linton
Melbourne
Melbourne (1 seat)
| Party |
Candidate |
Votes |
% |
|
Conservative |
Linda Mary Chilton (E) |
1,519 |
45.8 |
|
Labour |
Alan Mercer Jones |
1,036 |
31.2 |
|
UKIP |
Alan Jack Graves |
638 |
19.2 |
|
Liberal Democrat |
Rebecca Jane Wilkinson |
126 |
3.8 |
| Voter turnout |
36% |
Swadlincote Central
Swadlincote North
Swadlincote South
Swadlincote South (1 seat)
| Party |
Candidate |
Votes |
% |
|
Labour |
Trevor Southerd (E) |
1,067 |
45.1 |
|
Conservative |
Pat Murray |
669 |
28.3 |
|
UKIP |
Mike Dawson |
582 |
24.6 |
|
Liberal Democrat |
Liam Clarke |
48 |
2.0 |
| Voter turnout |
27% |
By-Elections between May 2013 – May 2017
By-elections are called when a representative Councillor resigns or dies, so are unpredictable. A by-election is held to fill a political office that has become vacant between the scheduled elections.
Alport and Derwent – 14 November 2014
Alport and Derwent By-Election 14 November 2014
| Party |
Candidate |
Votes |
% |
± |
|
Conservative |
David Taylor (E) |
1118 |
44.9 |
+3.1 |
|
UKIP |
David Fisher |
715 |
28.7 |
+3.6 |
|
Labour |
Mike Ratcliffe |
656 |
26.4 |
+1.2 |
| Majority |
403 |
16.2 |
|
| Turnout |
2489 |
25.8 |
|
|
Conservative hold |
Swing |
|
|
Brimington – 5 February 2015
Ashbourne – 7 May 2015
Derwent Valley – 24 September 2015
References