North Yorkshire County Council election, 2013
| | |||||||||||||||||||||||||||||||||||||||||||||
| |||||||||||||||||||||||||||||||||||||||||||||
| |||||||||||||||||||||||||||||||||||||||||||||
|
| |||||||||||||||||||||||||||||||||||||||||||||
| Map showing the results of the 2013 North Yorkshire County Council election. Striped divisions have mixed representation. | |||||||||||||||||||||||||||||||||||||||||||||
| |||||||||||||||||||||||||||||||||||||||||||||
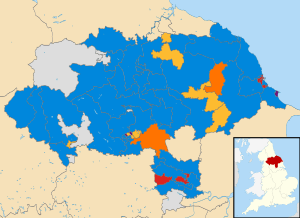
An election to North Yorkshire County Council took place on 2 May 2013 as part of the United Kingdom local elections, 2013. 72 councillors were elected from 68 electoral divisions, which returned either one or two county councillors each by first-past-the-post voting for a four-year term of office. The four divisions which elected two members were Harrogate Bilton & Nidd Gorge, Harrogate Central, Knaresborough, and Selby Barlby. The electoral divisions were the same as those used at the previous election in 2009. The election saw the Conservative Party maintain overall control of the council.
All locally registered electors (British, Irish, Commonwealth and European Union citizens) who were aged 18 or over on Thursday 2 May 2013 were entitled to vote in the local elections. Those who were temporarily away from their ordinary address (for example, away working, on holiday, in student accommodation or in hospital) were also entitled to vote in the local elections,[1] although those who had moved abroad and registered as overseas electors cannot vote in the local elections. It is possible to register to vote at more than one address (such as a university student who had a term-time address and lives at home during holidays) at the discretion of the local Electoral Register Office, but it remains an offence to vote more than once in the same local government election.[2]
Results
| North Yorkshire County Council election, 2013[3] | ||||||||||
|---|---|---|---|---|---|---|---|---|---|---|
| Party | Seats | Gains | Losses | Net gain/loss | Seats % | Votes % | Votes | +/− | ||
| Conservative | 45 | -3 | 62.5% | 40.6% | 64,273 | |||||
| Liberal Democrat | 8 | -3 | 11.1% | 11.4% | 17,997 | |||||
| Labour | 7 | +6 | 9.7% | 16.5% | 26,094 | |||||
| UKIP | 2 | 2 | 0 | +2 | 2.7% | 16.0% | 25,358 | |||
| Independent | 7 | -4 | 9.7% | 11.5% | 18,196 | |||||
| Liberal | 2 | 1 | 0 | +1 | 2.7% | 1.4% | 2,287 | |||
| Green | 0 | 0 | 0 | 0 | 0 | 2.7% | 4,228 | |||
| National Front | 0 | 0 | 0 | 0 | 0 | 0.0% | 9 | |||
Divisional results
Craven district
| Party | Candidate | Votes | % | ± | |
|---|---|---|---|---|---|
| Conservative | |||||
| Liberal Democrat | |||||
| Labour | |||||
| UKIP | |||||
| Rejected ballots | {{{change}}} | ||||
| Majority | |||||
| Turnout | |||||
| [[|N/A]] gain from [[|N/A]] | Swing | ||||
| Party | Candidate | Votes | % | ± | |
|---|---|---|---|---|---|
| Conservative | |||||
| Liberal Democrat | |||||
| Labour | |||||
| UKIP | |||||
| Rejected ballots | {{{change}}} | ||||
| Majority | |||||
| Turnout | |||||
| [[|N/A]] gain from [[|N/A]] | Swing | ||||
| Party | Candidate | Votes | % | ± | |
|---|---|---|---|---|---|
| Conservative | |||||
| Liberal Democrat | |||||
| Labour | |||||
| UKIP | |||||
| Rejected ballots | {{{change}}} | ||||
| Majority | |||||
| Turnout | |||||
| [[|N/A]] gain from [[|N/A]] | Swing | ||||
| Party | Candidate | Votes | % | ± | |
|---|---|---|---|---|---|
| Conservative | |||||
| Liberal Democrat | |||||
| Labour | |||||
| UKIP | |||||
| Rejected ballots | {{{change}}} | ||||
| Majority | |||||
| Turnout | |||||
| [[|N/A]] gain from [[|N/A]] | Swing | ||||
| Party | Candidate | Votes | % | ± | |
|---|---|---|---|---|---|
| Conservative | |||||
| Liberal Democrat | |||||
| Labour | |||||
| UKIP | |||||
| Rejected ballots | {{{change}}} | ||||
| Majority | |||||
| Turnout | |||||
| [[|N/A]] gain from [[|N/A]] | Swing | ||||
| Party | Candidate | Votes | % | ± | |
|---|---|---|---|---|---|
| Conservative | |||||
| Liberal Democrat | |||||
| Labour | |||||
| UKIP | |||||
| Rejected ballots | {{{change}}} | ||||
| Majority | |||||
| Turnout | |||||
| [[|N/A]] gain from [[|N/A]] | Swing | ||||
| Party | Candidate | Votes | % | ± | |
|---|---|---|---|---|---|
| Conservative | |||||
| Liberal Democrat | |||||
| Labour | |||||
| UKIP | |||||
| Rejected ballots | {{{change}}} | ||||
| Majority | |||||
| Turnout | |||||
| [[|N/A]] gain from [[|N/A]] | Swing | ||||
Hambleton district [4]
| Party | Candidate | Votes | % | ± | |
|---|---|---|---|---|---|
| UKIP | Graham Cullen | ||||
| Labour | Pam King | ||||
| Independent | Ian Watkins | ||||
| Conservative | John Weighell | ||||
| Rejected ballots | {{{change}}} | ||||
| Majority | |||||
| Turnout | |||||
| [[|N/A]] gain from [[|N/A]] | Swing | ||||
| Party | Candidate | Votes | % | ± | |
|---|---|---|---|---|---|
| Labour | Kathleen Mullen | ||||
| Conservative | Peter Sowray | ||||
| Rejected ballots | {{{change}}} | ||||
| Majority | |||||
| Turnout | |||||
| [[|N/A]] gain from [[|N/A]] | Swing | ||||
| Party | Candidate | Votes | % | ± | |
|---|---|---|---|---|---|
| UKIP | Stuart Lightwing | ||||
| Conservative | Heather Moorhouse | ||||
| Liberal Democrat | Richard Short | ||||
| Labour | Paul Spellman | ||||
| Rejected ballots | {{{change}}} | ||||
| Majority | |||||
| Turnout | |||||
| [[|N/A]] gain from [[|N/A]] | Swing | ||||
| Party | Candidate | Votes | % | ± | |
|---|---|---|---|---|---|
| UKIP | Harry Burton | ||||
| Labour | Mike Newton | ||||
| Conservative | Tim Swales | ||||
| Rejected ballots | {{{change}}} | ||||
| Majority | |||||
| Turnout | |||||
| [[|N/A]] gain from [[|N/A]] | Swing | ||||
| Party | Candidate | Votes | % | ± | |
|---|---|---|---|---|---|
| Conservative | Tony Hall | ||||
| UKIP | Claire Palmer | ||||
| Labour | Gerry Ramsden | ||||
| Rejected ballots | {{{change}}} | ||||
| Majority | |||||
| Turnout | |||||
| [[|N/A]] gain from [[|N/A]] | Swing | ||||
| Party | Candidate | Votes | % | ± | |
|---|---|---|---|---|---|
| Conservative | David Blades | ||||
| Labour | Ann Hutchings | ||||
| UKIP | Joseph Warfield | ||||
| Rejected ballots | {{{change}}} | ||||
| Majority | |||||
| Turnout | |||||
| [[|N/A]] gain from [[|N/A]] | Swing | ||||
| Party | Candidate | Votes | % | ± | |
|---|---|---|---|---|---|
| Conservative | |||||
| Liberal Democrat | |||||
| Labour | |||||
| UKIP | |||||
| Rejected ballots | {{{change}}} | ||||
| Majority | |||||
| Turnout | |||||
| [[|N/A]] gain from [[|N/A]] | Swing | ||||
| Party | Candidate | Votes | % | ± | |
|---|---|---|---|---|---|
| Conservative | |||||
| Liberal Democrat | |||||
| Labour | |||||
| UKIP | |||||
| Rejected ballots | {{{change}}} | ||||
| Majority | |||||
| Turnout | |||||
| [[|N/A]] gain from [[|N/A]] | Swing | ||||
| Party | Candidate | Votes | % | ± | |
|---|---|---|---|---|---|
| Conservative | Stephen Dickins | ||||
| Labour | Eileen Driver | ||||
| Liberal Democrat | Bryn Griffiths | ||||
| UKIP | David Troughton | ||||
| Rejected ballots | {{{change}}} | ||||
| Majority | |||||
| Turnout | |||||
| [[|N/A]] gain from [[|N/A]] | Swing | ||||
| Party | Candidate | Votes | % | ± | |
|---|---|---|---|---|---|
| Conservative | Arthur Barker | ||||
| UKIP | Jacqueline Brakenberry | ||||
| Labour | Lenny Cornwall | ||||
| Rejected ballots | {{{change}}} | ||||
| Majority | |||||
| Turnout | |||||
| [[|N/A]] gain from [[|N/A]] | Swing | ||||
| Party | Candidate | Votes | % | ± | |
|---|---|---|---|---|---|
| Conservative | Gareth Dadd | ||||
| Labour | Jude Thurlow | ||||
| Rejected ballots | {{{change}}} | ||||
| Majority | |||||
| Turnout | |||||
| [[|N/A]] gain from [[|N/A]] | Swing | ||||
Harrogate district [5]
| Party | Candidate | Votes | % | ± | |
|---|---|---|---|---|---|
| Liberal | John Savage | 989 | 38 | ||
| Conservative | Famida Wilson | 897 | 34 | ||
| UKIP | Robert Frendt | 480 | 18 | ||
| Labour | John Fisher | 242 | 10 | ||
| Rejected ballots | {{{change}}} | ||||
| Majority | 92 | 4 | |||
| Turnout | 36 | ||||
| Liberal gain from Conservative | Swing | ||||
| Party | Candidate | Votes | % | ± | |
|---|---|---|---|---|---|
| Conservative | Robert Windass | 1220 | 48 | ||
| UKIP | Paul Hudson | 759 | 30 | ||
| Liberal | Peter Philips | 337 | 13 | ||
| Labour | Alec Hendry | 242 | 9 | ||
| Rejected ballots | {{{change}}} | ||||
| Majority | 461 | ||||
| Turnout | 34 | ||||
| Conservative hold | Swing | ||||
| Party | Candidate | Votes | % | ± | |
|---|---|---|---|---|---|
| UKIP | David Simister | 1164 | |||
| Liberal Democrat | Andrew Goss | 1145 | |||
| Liberal Democrat | Geoff Webber | 1112 | |||
| UKIP | Mark Simpson | 875 | |||
| Conservative | Steven Jackson | 747 | |||
| Conservative | Graham Swift | 690 | |||
| Labour | Andrew Gray | 642 | |||
| Labour | Brian Summerson | 542 | |||
| Green | Claire Hawkins | 326 | |||
| Rejected ballots | {{{change}}} | ||||
| Majority | |||||
| Turnout | 57% | ||||
| UKIP gain from Liberal Democrat | Swing | ||||
| Liberal Democrat hold | Swing | ||||
| Party | Candidate | Votes | % | ± | |
|---|---|---|---|---|---|
| Conservative | Richard Cooper | 1586 | 20 | ||
| Conservative | Jean Butterball | 1551 | 19 | ||
| Liberal Democrat | John Fox | 1539 | 19 | ||
| Liberal Democrat | James Monaghan | 1330 | 17 | ||
| UKIP | Adrian Ludbrook | 657 | 8 | ||
| UKIP | Gregory Peters | 634 | 8 | ||
| Labour | Diane Maguire | 398 | 5 | ||
| Labour | Nicholas Knott | 360 | 4 | ||
| Rejected ballots | {{{change}}} | ||||
| Majority | |||||
| Turnout | |||||
| Conservative gain from Liberal Democrat | Swing | ||||
| Conservative gain from Liberal Democrat | Swing | ||||
| Party | Candidate | Votes | % | ± | |
|---|---|---|---|---|---|
| Conservative | Jim Clark | 1300 | 52 | ||
| Liberal Democrat | Les Parkes | 606 | 24 | ||
| UKIP | Salvina Bashforth | 413 | 16 | ||
| Labour | Kevin McNerney | 200 | 8 | ||
| Rejected ballots | {{{change}}} | ||||
| Majority | |||||
| Turnout | 38 | ||||
| Conservative hold | Swing | ||||
| Party | Candidate | Votes | % | ± | |
|---|---|---|---|---|---|
| Conservative | John Ennis | 1083 | 40 | ||
| Liberal Democrat | Peter Skardon | 988 | 36 | ||
| UKIP | Geoffrey Lumley | 432 | 16 | ||
| Labour | Helen Burke | 207 | 8 | ||
| Rejected ballots | {{{change}}} | ||||
| Majority | |||||
| Turnout | 41 | ||||
| Conservative gain from Liberal Democrat | Swing | ||||
| Party | Candidate | Votes | % | ± | |
|---|---|---|---|---|---|
| Conservative | Don Mackenzie | 1050 | 50 | ||
| UKIP | David Thompson | 404 | 19 | ||
| Liberal Democrat | Gordon Charlton | 326 | 16 | ||
| Labour | Janet Isabella | 165 | 8 | ||
| Green | Shaun Lowry | 158 | 8 | ||
| Rejected ballots | {{{change}}} | ||||
| Majority | |||||
| Turnout | 32 | ||||
| Conservative hold | Swing | ||||
| Party | Candidate | Votes | % | ± | |
|---|---|---|---|---|---|
| Liberal Democrat | Margaret-Ann De Courcey-Bayley | 908 | 49 | ||
| UKIP | Steven O'Neill | 403 | 22 | ||
| Conservative | Benjamin Johnson | 310 | 17 | ||
| Labour | Geoffrey Foxall | 214 | 12 | ||
| Rejected ballots | {{{change}}} | ||||
| Majority | |||||
| Turnout | 28 | ||||
| Liberal Democrat hold | Swing | ||||
| Party | Candidate | Votes | % | ± | |
|---|---|---|---|---|---|
| Liberal Democrat | Bill Hoult | 2084 | 23 | ||
| Liberal Democrat | Anne Jones | 1861 | 20 | ||
| Conservative | John Batt | 1219 | 13 | ||
| Conservative | Phil Ireland | 1108 | 12 | ||
| UKIP | Matthew Joy | 947 | 10 | ||
| UKIP | David Rimington | 764 | 8 | ||
| Labour | Lorraine Ferris | 399 | 4 | ||
| Labour | Jan Williams | 376 | 4 | ||
| Green | Gillian Charters | 330 | 4 | ||
| Rejected ballots | {{{change}}} | ||||
| Majority | |||||
| Turnout | 37 | ||||
| Liberal Democrat hold | Swing | ||||
| Liberal Democrat gain from Conservative | Swing | ||||
| Party | Candidate | Votes | % | ± | |
|---|---|---|---|---|---|
| Conservative | |||||
| Liberal Democrat | |||||
| UKIP | |||||
| Labour | |||||
| Rejected ballots | {{{change}}} | ||||
| Majority | |||||
| Turnout | |||||
| [[|N/A]] gain from [[|N/A]] | Swing | ||||
| Party | Candidate | Votes | % | ± | |
|---|---|---|---|---|---|
| Conservative | |||||
| UKIP | |||||
| Liberal Democrat | |||||
| Labour | |||||
| Rejected ballots | {{{change}}} | ||||
| Majority | |||||
| Turnout | |||||
| [[|N/A]] gain from [[|N/A]] | Swing | ||||
| Party | Candidate | Votes | % | ± | |
|---|---|---|---|---|---|
| Conservative | |||||
| Liberal Democrat | |||||
| Labour | |||||
| UKIP | |||||
| Rejected ballots | {{{change}}} | ||||
| Majority | |||||
| Turnout | |||||
| [[|N/A]] gain from [[|N/A]] | Swing | ||||
| Party | Candidate | Votes | % | ± | |
|---|---|---|---|---|---|
| Conservative | |||||
| Liberal Democrat | |||||
| UKIP | |||||
| Labour | |||||
| Rejected ballots | {{{change}}} | ||||
| Majority | |||||
| Turnout | |||||
| [[|N/A]] gain from [[|N/A]] | Swing | ||||
| Party | Candidate | Votes | % | ± | |
|---|---|---|---|---|---|
| Conservative | |||||
| Liberal Democrat | |||||
| UKIP | |||||
| Labour | |||||
| Rejected ballots | {{{change}}} | ||||
| Majority | |||||
| Turnout | |||||
| [[|N/A]] gain from [[|N/A]] | Swing | ||||
| Party | Candidate | Votes | % | ± | |
|---|---|---|---|---|---|
| Conservative | |||||
| UKIP | |||||
| Liberal Democrat | |||||
| Labour | |||||
| Rejected ballots | {{{change}}} | ||||
| Majority | |||||
| Turnout | |||||
| [[|N/A]] gain from [[|N/A]] | Swing | ||||
Richmondshire district
| Party | Candidate | Votes | % | ± | |
|---|---|---|---|---|---|
| Conservative | |||||
| Liberal Democrat | |||||
| Labour | |||||
| UKIP | |||||
| Rejected ballots | {{{change}}} | ||||
| Majority | |||||
| Turnout | |||||
| [[|N/A]] gain from [[|N/A]] | Swing | ||||
| Party | Candidate | Votes | % | ± | |
|---|---|---|---|---|---|
| Conservative | |||||
| Liberal Democrat | |||||
| Labour | |||||
| UKIP | |||||
| Rejected ballots | {{{change}}} | ||||
| Majority | |||||
| Turnout | |||||
| [[|N/A]] gain from [[|N/A]] | Swing | ||||
| Party | Candidate | Votes | % | ± | |
|---|---|---|---|---|---|
| Conservative | |||||
| Liberal Democrat | |||||
| Labour | |||||
| UKIP | |||||
| Rejected ballots | {{{change}}} | ||||
| Majority | |||||
| Turnout | |||||
| [[|N/A]] gain from [[|N/A]] | Swing | ||||
| Party | Candidate | Votes | % | ± | |
|---|---|---|---|---|---|
| Conservative | |||||
| Liberal Democrat | |||||
| Labour | |||||
| UKIP | |||||
| Rejected ballots | {{{change}}} | ||||
| Majority | |||||
| Turnout | |||||
| [[|N/A]] gain from [[|N/A]] | Swing | ||||
| Party | Candidate | Votes | % | ± | |
|---|---|---|---|---|---|
| Conservative | |||||
| Liberal Democrat | |||||
| Labour | |||||
| UKIP | |||||
| Rejected ballots | {{{change}}} | ||||
| Majority | |||||
| Turnout | |||||
| [[|N/A]] gain from [[|N/A]] | Swing | ||||
| Party | Candidate | Votes | % | ± | |
|---|---|---|---|---|---|
| Conservative | |||||
| Liberal Democrat | |||||
| Labour | |||||
| UKIP | |||||
| Rejected ballots | {{{change}}} | ||||
| Majority | |||||
| Turnout | |||||
| [[|N/A]] gain from [[|N/A]] | Swing | ||||
Ryedale district
| Party | Candidate | Votes | % | ± | |
|---|---|---|---|---|---|
| Conservative | |||||
| Liberal Democrat | |||||
| Labour | Sam Prest | ||||
| UKIP | |||||
| Rejected ballots | {{{change}}} | ||||
| Majority | |||||
| Turnout | |||||
| [[|N/A]] gain from [[|N/A]] | Swing | ||||
| Party | Candidate | Votes | % | ± | |
|---|---|---|---|---|---|
| Conservative | |||||
| Liberal Democrat | |||||
| Labour | |||||
| UKIP | |||||
| Rejected ballots | {{{change}}} | ||||
| Majority | |||||
| Turnout | |||||
| [[|N/A]] gain from [[|N/A]] | Swing | ||||
| Party | Candidate | Votes | % | ± | |
|---|---|---|---|---|---|
| Conservative | |||||
| Liberal Democrat | |||||
| Labour | Tim Prest | ||||
| UKIP | |||||
| Rejected ballots | {{{change}}} | ||||
| Majority | |||||
| Turnout | |||||
| [[|N/A]] gain from [[|N/A]] | Swing | ||||
| Party | Candidate | Votes | % | ± | |
|---|---|---|---|---|---|
| Conservative | |||||
| Liberal Democrat | |||||
| Labour | |||||
| UKIP | |||||
| Rejected ballots | {{{change}}} | ||||
| Majority | |||||
| Turnout | |||||
| [[|N/A]] gain from [[|N/A]] | Swing | ||||
| Party | Candidate | Votes | % | ± | |
|---|---|---|---|---|---|
| Conservative | |||||
| Liberal Democrat | |||||
| Labour | |||||
| UKIP | |||||
| Rejected ballots | {{{change}}} | ||||
| Majority | |||||
| Turnout | |||||
| [[|N/A]] gain from [[|N/A]] | Swing | ||||
| Party | Candidate | Votes | % | ± | |
|---|---|---|---|---|---|
| Conservative | |||||
| Liberal Democrat | |||||
| Labour | |||||
| UKIP | |||||
| Rejected ballots | {{{change}}} | ||||
| Majority | |||||
| Turnout | |||||
| [[|N/A]] gain from [[|N/A]] | Swing | ||||
Scarborough district
| Party | Candidate | Votes | % | ± | |
|---|---|---|---|---|---|
| Conservative | |||||
| Liberal Democrat | |||||
| Labour | |||||
| UKIP | |||||
| Rejected ballots | {{{change}}} | ||||
| Majority | |||||
| Turnout | |||||
| [[|N/A]] gain from [[|N/A]] | Swing | ||||
| Party | Candidate | Votes | % | ± | |
|---|---|---|---|---|---|
| Conservative | |||||
| Liberal Democrat | |||||
| Labour | |||||
| UKIP | |||||
| Rejected ballots | {{{change}}} | ||||
| Majority | |||||
| Turnout | |||||
| [[|N/A]] gain from [[|N/A]] | Swing | ||||
| Party | Candidate | Votes | % | ± | |
|---|---|---|---|---|---|
| Conservative | |||||
| Liberal Democrat | |||||
| Labour | |||||
| UKIP | |||||
| Rejected ballots | {{{change}}} | ||||
| Majority | |||||
| Turnout | |||||
| [[|N/A]] gain from [[|N/A]] | Swing | ||||
| Party | Candidate | Votes | % | ± | |
|---|---|---|---|---|---|
| Conservative | |||||
| Liberal Democrat | |||||
| Labour | |||||
| UKIP | |||||
| Rejected ballots | {{{change}}} | ||||
| Majority | |||||
| Turnout | |||||
| [[|N/A]] gain from [[|N/A]] | Swing | ||||
| Party | Candidate | Votes | % | ± | |
|---|---|---|---|---|---|
| Conservative | |||||
| Liberal Democrat | |||||
| Labour | |||||
| UKIP | |||||
| Rejected ballots | {{{change}}} | ||||
| Majority | |||||
| Turnout | |||||
| [[|N/A]] gain from [[|N/A]] | Swing | ||||
| Party | Candidate | Votes | % | ± | |
|---|---|---|---|---|---|
| Conservative | |||||
| Liberal Democrat | |||||
| Labour | |||||
| UKIP | |||||
| Rejected ballots | {{{change}}} | ||||
| Majority | |||||
| Turnout | |||||
| [[|N/A]] gain from [[|N/A]] | Swing | ||||
| Party | Candidate | Votes | % | ± | |
|---|---|---|---|---|---|
| Conservative | |||||
| Liberal Democrat | |||||
| Labour | |||||
| UKIP | |||||
| Rejected ballots | {{{change}}} | ||||
| Majority | |||||
| Turnout | |||||
| [[|N/A]] gain from [[|N/A]] | Swing | ||||
| Party | Candidate | Votes | % | ± | |
|---|---|---|---|---|---|
| Conservative | |||||
| Liberal Democrat | |||||
| Labour | |||||
| UKIP | |||||
| Rejected ballots | {{{change}}} | ||||
| Majority | |||||
| Turnout | |||||
| [[|N/A]] gain from [[|N/A]] | Swing | ||||
| Party | Candidate | Votes | % | ± | |
|---|---|---|---|---|---|
| Conservative | |||||
| Liberal Democrat | |||||
| Labour | |||||
| UKIP | |||||
| Rejected ballots | {{{change}}} | ||||
| Majority | |||||
| Turnout | |||||
| [[|N/A]] gain from [[|N/A]] | Swing | ||||
| Party | Candidate | Votes | % | ± | |
|---|---|---|---|---|---|
| Conservative | |||||
| Liberal Democrat | |||||
| Labour | |||||
| UKIP | |||||
| Rejected ballots | {{{change}}} | ||||
| Majority | |||||
| Turnout | |||||
| [[|N/A]] gain from [[|N/A]] | Swing | ||||
| Party | Candidate | Votes | % | ± | |
|---|---|---|---|---|---|
| Conservative | |||||
| Liberal Democrat | |||||
| Labour | |||||
| UKIP | |||||
| Rejected ballots | {{{change}}} | ||||
| Majority | |||||
| Turnout | |||||
| [[|N/A]] gain from [[|N/A]] | Swing | ||||
| Party | Candidate | Votes | % | ± | |
|---|---|---|---|---|---|
| Conservative | |||||
| Liberal Democrat | |||||
| Labour | |||||
| UKIP | |||||
| Rejected ballots | {{{change}}} | ||||
| Majority | |||||
| Turnout | |||||
| [[|N/A]] gain from [[|N/A]] | Swing | ||||
| Party | Candidate | Votes | % | ± | |
|---|---|---|---|---|---|
| Conservative | |||||
| Liberal Democrat | |||||
| Labour | |||||
| UKIP | |||||
| Rejected ballots | {{{change}}} | ||||
| Majority | |||||
| Turnout | |||||
| [[|N/A]] gain from [[|N/A]] | Swing | ||||
| Party | Candidate | Votes | % | ± | |
|---|---|---|---|---|---|
| Conservative | |||||
| Liberal Democrat | |||||
| Labour | |||||
| UKIP | |||||
| Rejected ballots | {{{change}}} | ||||
| Majority | |||||
| Turnout | |||||
| [[|N/A]] gain from [[|N/A]] | Swing | ||||
Selby district
| Party | Candidate | Votes | % | ± | |
|---|---|---|---|---|---|
| Conservative | Andrew Lee | 1041 | 67 | ||
| Labour | Rosie Corrigan | 521 | 33 | ||
| Turnout | 1562 | 29 | |||
| Conservative hold | Swing | {{{swing}}} | |||
| Party | Candidate | Votes | % | ± | |
|---|---|---|---|---|---|
| Conservative | |||||
| Liberal Democrat | |||||
| Labour | |||||
| UKIP | |||||
| Rejected ballots | {{{change}}} | ||||
| Majority | |||||
| Turnout | |||||
| [[|N/A]] gain from [[|N/A]] | Swing | ||||
| Party | Candidate | Votes | % | ± | |
|---|---|---|---|---|---|
| Conservative | |||||
| Liberal Democrat | |||||
| Labour | |||||
| UKIP | |||||
| Rejected ballots | {{{change}}} | ||||
| Majority | |||||
| Turnout | |||||
| [[|N/A]] gain from [[|N/A]] | Swing | ||||
| Party | Candidate | Votes | % | ± | |
|---|---|---|---|---|---|
| Conservative | |||||
| Liberal Democrat | |||||
| Labour | |||||
| UKIP | |||||
| Rejected ballots | {{{change}}} | ||||
| Majority | |||||
| Turnout | |||||
| [[|N/A]] gain from [[|N/A]] | Swing | ||||
| Party | Candidate | Votes | % | ± | |
|---|---|---|---|---|---|
| Conservative | |||||
| Liberal Democrat | |||||
| Labour | |||||
| UKIP | |||||
| Rejected ballots | {{{change}}} | ||||
| Majority | |||||
| Turnout | |||||
| [[|N/A]] gain from [[|N/A]] | Swing | ||||
| Party | Candidate | Votes | % | ± | |
|---|---|---|---|---|---|
| Conservative | |||||
| Liberal Democrat | |||||
| Labour | |||||
| UKIP | |||||
| Rejected ballots | {{{change}}} | ||||
| Majority | |||||
| Turnout | |||||
| [[|N/A]] gain from [[|N/A]] | Swing | ||||
| Party | Candidate | Votes | % | ± | |
|---|---|---|---|---|---|
| Conservative | |||||
| Liberal Democrat | |||||
| Labour | |||||
| UKIP | |||||
| Rejected ballots | {{{change}}} | ||||
| Majority | |||||
| Turnout | |||||
| [[|N/A]] gain from [[|N/A]] | Swing | ||||
| Party | Candidate | Votes | % | ± | |
|---|---|---|---|---|---|
| Conservative | |||||
| Liberal Democrat | |||||
| Labour | |||||
| UKIP | |||||
| Rejected ballots | {{{change}}} | ||||
| Majority | |||||
| Turnout | |||||
| [[|N/A]] gain from [[|N/A]] | Swing | ||||
| Party | Candidate | Votes | % | ± | |
|---|---|---|---|---|---|
| Conservative | |||||
| Liberal Democrat | |||||
| Labour | |||||
| UKIP | |||||
| Rejected ballots | {{{change}}} | ||||
| Majority | |||||
| Turnout | |||||
| [[|N/A]] gain from [[|N/A]] | Swing | ||||
Notes
References
- ↑ "The Representation of the People (Form of Canvass) (England and Wales) Regulations 2006, Schedule Part 1". Legislation.gov.uk. 13 October 2011. Retrieved 18 April 2012.
- ↑ "I have two homes. Can I register at both addresses?". The Electoral Commission. Retrieved 5 January 2011.
- ↑ "Elections - results publication". North Yorkshire County Council. Retrieved 12 May 2013.
- ↑ "Candidate nominations for the Hambleton District Council area". Retrieved 11 April 2013.
- ↑ "ELECTION 2013: Harrogate district results in full". Harrogate Advertiser. 3 May 2013. Retrieved 12 May 2013.
| North Yorkshire County Council | |
|---|---|
| City of York Council | |
| Craven District Council | |
| Hambleton District Council |
|
| Harrogate Borough Council | |
| Middlesbrough Borough Council | |
| Redcar and Cleveland Borough Council | |
| Richmondshire District Council | |
| Ryedale District Council | |
| Scarborough Borough Council | |
| Selby District Council |
|
| Stockton-on-Tees Borough Council |
|
| Cleveland County Council |
|
| Tees Valley Mayor | |
| |