Northamptonshire County Council election, 2013
| | ||||||||||||||||||||||||||||||||||||||||||||||||
| ||||||||||||||||||||||||||||||||||||||||||||||||
| ||||||||||||||||||||||||||||||||||||||||||||||||
|
| ||||||||||||||||||||||||||||||||||||||||||||||||
| Map showing the results of the 2013 Northamptonshire County Council elections. | ||||||||||||||||||||||||||||||||||||||||||||||||
| ||||||||||||||||||||||||||||||||||||||||||||||||
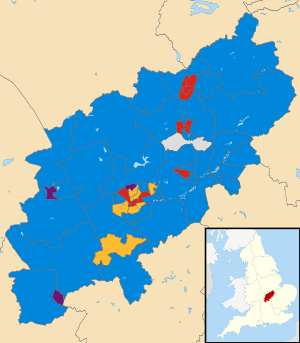
An election to Northamptonshire County Council took place on 2 May 2013 as part of the United Kingdom local elections, 2013.[1] Following a boundary review, the number of county councillors was reduced from 73 to 57 from this election.[n 1] All members were elected by first-past-the-post voting from single-member electoral divisions for a four-year term of office. The Conservative Party held on to their overall majority, having held overall control of the council since 2005.
All locally registered electors (British, Irish, Commonwealth and European Union citizens) who were aged 18 or over on Thursday 2 May 2013 were entitled to vote in the local elections.[2] Those who were temporarily away from their ordinary address (for example, away working, on holiday, in student accommodation or in hospital) were also entitled to vote in the local elections, although those who had moved abroad and registered as overseas electors cannot vote in the local elections. It is possible to register to vote at more than one address (such as a university student who had a term-time address and lives at home during holidays) at the discretion of the local Electoral Register Office, but it remains an offence to vote more than once in the same local government election.[3]
Summary
The election saw the Conservatives maintain overall control of the council with a reduced majority of 8 seats. The Labour Party retained their status as the council's official opposition group with 11 seats, a net gain of five. The Liberal Democrat had 6 members elected, a net loss of three. UKIP achieved 3 council seats, while one independent candidate was elected.
Results
| Northamptonshire County Council Election Result 2013 | ||||||||||
|---|---|---|---|---|---|---|---|---|---|---|
| Party | Seats | Gains | Losses | Net gain/loss | Seats % | Votes % | Votes | +/− | ||
| Conservative | 36 | -20 | 63.16 | |||||||
| Labour | 11 | +5 | 19.30% | |||||||
| Liberal Democrat | 6 | -3 | 10.53% | |||||||
| UKIP | 3 | 3 | 0 | +3 | 5.26% | |||||
| Independent | 1 | 0 | 1 | -1 | 1.75% | |||||
| Green | 0 | 0 | 0 | 0 | 0 | |||||
Results by Division
Corby
| Party | Candidate | Votes | % | ± | |
|---|---|---|---|---|---|
| Conservative | Stan Heggs | 738 | 28.1 | ||
| UKIP | Margot Parker | 640 | 24.4 | ||
| Labour | Jonathan West | 633 | 24.1 | ||
| Liberal Democrat | Bob Riley | 614 | 23.4 | ||
| Turnout | 2625 | 39.81 | |||
| Party | Candidate | Votes | % | ± | |
|---|---|---|---|---|---|
| Labour | Julie Brookfield | 1916 | 59.6 | ||
| Conservative | Eve Howitt | 557 | 17.3 | ||
| Independent | Stuart McKay | 412 | 12.8 | ||
| BNP | Marc Riddell | 226 | 7.0 | ||
| Liberal Democrat | Philip Bromhall | 104 | 3.2 | ||
| Turnout | 3215 | 32.17 | |||
| Party | Candidate | Votes | % | ± | |
|---|---|---|---|---|---|
| Labour | John McGhee | 1850 | 69.9 | ||
| Conservative | Helen Harrison | 368 | 13.9 | ||
| BNP | Stella Wright | 245 | 9.2 | ||
| Green | Steven Scrutton | 110 | 4.1 | ||
| Liberal Democrat | Eddie McGeown | 84 | 3.2 | ||
| Turnout | 2657 | 25.48 | |||
| Party | Candidate | Votes | % | ± | |
|---|---|---|---|---|---|
| Labour | Bob Scott | 1923 | 61.7 | ||
| UKIP | Fred Parker | 670 | 21.5 | ||
| Conservative | Christopher Woolmer | 392 | 12.6 | ||
| BNP | Gordon Riddell | 70 | 2.2 | ||
| Liberal Democrat | Terri Meechan | 60 | 1.9 | ||
| Turnout | 3115 | 29.2 | |||
| Party | Candidate | Votes | % | ± | |
|---|---|---|---|---|---|
| Labour | Mary Butcher | 1110 | 38.4 | ||
| UKIP | Peter McGowan | 658 | 22.8 | ||
| Liberal Democrat | Chris Stanbra | 565 | 19.6 | ||
| Conservative | David Sims | 518 | 17.9 | ||
| BNP | James Campbell | 36 | 1.2 | ||
| Turnout | 2887 | 30.11 | |||
Daventry
| Party | Candidate | Votes | % | ± | |
|---|---|---|---|---|---|
| Conservative | Steve Slatter | 1008 | 34.0 | ||
| UKIP | Derek Whitaker | 932 | 31.5 | ||
| Labour | Abigail Campbell | 884 | 29.8 | ||
| Liberal Democrat | Pamela Varnsverry | 138 | 4.7 | ||
| Turnout | 2962 | 32.1 | |||
| Party | Candidate | Votes | % | ± | |
|---|---|---|---|---|---|
| Conservative | Catherine Boardman | 1683 | 51.0 | ||
| UKIP | Pamela Booker | 826 | 25.0 | ||
| Labour | Robert MaNally | 436 | 13.2 | ||
| Green | Steve Whiffen | 221 | 6.7 | ||
| Liberal Democrat | Liz Pym | 133 | 4.0 | ||
| Turnout | 3299 | 36.33 | |||
| Party | Candidate | Votes | % | ± | |
|---|---|---|---|---|---|
| Conservative | Alan Hills | 896 | 43.6 | ||
| UKIP | Eric Macanndrais | 576 | 28.0 | ||
| Labour | Ken Ritchie | 530 | 25.8 | ||
| Independent | Alan Gordon† | 54 | 2.6 | ||
| Turnout | 2056 | 27.57 | |||
†Trade Unions and Socialists against cuts
| Party | Candidate | Votes | % | ± | |
|---|---|---|---|---|---|
| UKIP | Adam Collyer | 721 | 33.9 | ||
| Conservative | Chris Long | 683 | 32.1 | ||
| Labour | Wendy Randall | 657 | 30.9 | ||
| Liberal Democrat | Luisa Pereira | 66 | 3.1 | ||
| Turnout | 2127 | 22.57 | |||
| Party | Candidate | Votes | % | ± | |
|---|---|---|---|---|---|
| Conservative | Steve Osborne | 1421 | 46.0 | ||
| UKIP | Beverley Rundle | 804 | 12.0 | ||
| Labour | Christopher Lee | 549 | 17.8 | ||
| Liberal Democrat | Neil Farmer | 263 | 8.5 | ||
| Independent | Tom Price† | 51 | 1.7 | ||
| Turnout | 3088 | 36.36 | |||
†Trade Unions and Socialists against cuts
| Party | Candidate | Votes | % | ± | |
|---|---|---|---|---|---|
| Conservative | Judy Shephard | 1447 | 46.1 | ||
| UKIP | Ian Dexter | 1017 | 32.4 | ||
| Labour | Mark Maryan | 468 | 14.9 | ||
| Liberal Democrat | Jacqueline Glynane | 130 | 4.1 | ||
| Christian Peoples | Timothy Webb | 75 | 2.4 | ||
| Turnout | 3137 | 36.66 | |||
| Party | Candidate | Votes | % | ± | |
|---|---|---|---|---|---|
| Conservative | Robin Brown | 1295 | 49.3 | ||
| UKIP | Debra Perry | 705 | 26.8 | ||
| Labour | Ron Pursey | 385 | 14.7 | ||
| Liberal Democrat | Christopher Salaman | 202 | 7.7 | ||
| Independent | Bea Price† | 39 | 1.5 | ||
| Turnout | 2626 | 29.73 | |||
†Trade Unions and Socialists against cuts
East Northamptonshire
| Party | Candidate | Votes | % | ± | |
|---|---|---|---|---|---|
| Conservative | Derek Lawson | 1184 | 44.2 | ||
| UKIP | Jo Faulkner | 667 | 26.0 | ||
| Labour | Angela White | 385 | 14.4 | ||
| Independent | Richard Gell | 299 | 11.2 | ||
| Liberal Democrat | Joshua Dixon | 116 | 4.3 | ||
| Turnout | 2681 | 29.44 | |||
| Party | Candidate | Votes | % | ± | |
|---|---|---|---|---|---|
| Conservative | Sylvia Hughes | 1436 | 48.0 | ||
| Labour | Jon Gray | 1263 | 42.2 | ||
| BNP | John Whitestone | 295 | 9.9 | ||
| Turnout | 2994 | 31.04 | |||
| Party | Candidate | Votes | % | ± | |
|---|---|---|---|---|---|
| Conservative | Heather Smith | 1849 | 55.6 | ||
| UKIP | Linda Saunders | 677 | 20.4 | ||
| Labour | Chris Cox | 573 | 17.2 | ||
| Liberal Democrat | George Smid | 225 | 6.8 | ||
| Turnout | 3324 | 35.78 | |||
| Party | Candidate | Votes | % | ± | |
|---|---|---|---|---|---|
| Conservative | Dudley Hughes | 1351 | 51.9 | ||
| Labour | Pauline Ellis | 1029 | 39.5 | ||
| Liberal Democrat | Garth Ratcliffe | 225 | 8.6 | ||
| Turnout | 2605 | 31.24 | |||
| Party | Candidate | Votes | % | ± | |
|---|---|---|---|---|---|
| Conservative | Michael Tye | 1366 | 47.2 | ||
| UKIP | David Hamblin | 741 | 25.6 | ||
| Labour | Keith Cox | 709 | 24.5 | ||
| Liberal Democrat | Anthony Woods | 80 | 2.8 | ||
| Turnout | 2896 | 30.4 | |||
| Party | Candidate | Votes | % | ± | |
|---|---|---|---|---|---|
| Conservative | Andy Mercer | 1386 | 48.0 | ||
| UKIP | Dan Blair | 725 | 25.1 | ||
| Labour | Les Rolfe | 631 | 21.9 | ||
| Liberal Democrat | David Hooton | 144 | 5.0 | ||
| Turnout | 2886 | 27.89 | |||
| Party | Candidate | Votes | % | ± | |
|---|---|---|---|---|---|
| Conservative | Wendy Brackenbury | 1380 | 37.9 | ||
| UKIP | Joseph Garner | 930 | 25.5 | ||
| Labour | Gordon Stewart | 570 | 15.6 | ||
| Independent | Bob Seery | 393 | 10.8 | ||
| Independent | Peter Baden | 128 | 3.5 | ||
| Green | Thomas Wand | 124 | 3.4 | ||
| Liberal Democrat | David Burgess | 119 | 3.3 | ||
| Turnout | 3644 | 35.29 | |||
Kettering
| Party | Candidate | Votes | % | ± | |
|---|---|---|---|---|---|
| Independent | Christopher Groome | 799 | 34.1 | ||
| Conservative | Steve Bellamy | 609 | 26.0 | ||
| UKIP | Daniel Perkins | 566 | 24.1 | ||
| Labour | Ian Watts | 319 | 13.6 | ||
| Liberal Democrat | David Garlick | 51 | 2.2 | ||
| Turnout | 2344 | 28.55 | |||
| Party | Candidate | Votes | % | ± | |
|---|---|---|---|---|---|
| Conservative | Bill Parker | 1208 | 43.2 | ||
| Labour | Harvey Bhandal | 830 | 29.7 | ||
| UKIP | Eddie Brace | 566 | 20.3 | ||
| English Democrat | Victoria Hilling | 117 | 4.2 | ||
| Liberal Democrat | John Crake | 73 | 2.6 | ||
| Turnout | 2794 | 30.94 | |||
| Party | Candidate | Votes | % | ± | |
|---|---|---|---|---|---|
| Conservative | Graham Lawman | 944 | 37.9 | ||
| Labour | Tony Aslam | 797 | 32.0 | ||
| UKIP | Peter Jakeways | 604 | 24.2 | ||
| English Democrat | Tony Spencer | 149 | 6.0 | ||
| Turnout | 2494 | 28.06 | |||
| Party | Candidate | Votes | % | ± | |
|---|---|---|---|---|---|
| Conservative | Allan Matthews | 1014 | 28.2 | ||
| Independent | Belinda Humfrey | 952 | 26.5 | ||
| UKIP | Paul Oakden | 635 | 17.7 | ||
| Labour | John Padwick | 610 | 17.0 | ||
| English Democrat | Kevin Sills | 190 | 5.3 | ||
| Liberal Democrat | Stanley Freeman | 124 | 3.4 | ||
| BNP | Clive Skinner | 71 | 2.0 | ||
| Turnout | 3596 | 35.25 | |||
| Party | Candidate | Votes | % | ± | |
|---|---|---|---|---|---|
| Conservative | Malcolm Waters | 1306 | 39.6 | ||
| UKIP | Allan Shipham | 884 | 26.8 | ||
| Labour | Andrea Watts | 776 | 23.5 | ||
| English Democrat | Rob Walker | 133 | 4.0 | ||
| Green | Emma Hornett | 111 | 3.4 | ||
| Liberal Democrat | Norman Jones | 89 | 2.7 | ||
| Turnout | 3299 | 32.5 | |||
| Party | Candidate | Votes | % | ± | |
|---|---|---|---|---|---|
| Conservative | Jim Harker | 1307 | 40.5 | ||
| UKIP | Jonathan Bullock | 1133 | 35.1 | ||
| Labour | Harjinder Singh | 671 | 20.8 | ||
| Liberal Democrat | Alan Window | 120 | 3.7 | ||
| Turnout | 3231 | 38.85 | |||
| Party | Candidate | Votes | % | ± | |
|---|---|---|---|---|---|
| Labour | Mick Scrimshaw | 1025 | 38.3 | ||
| Conservative | Larry Henson | 961 | 35.9 | ||
| UKIP | Dan Gaskin | 597 | 22.3 | ||
| Liberal Democrat | Portia Wilson | 94 | 3.5 | ||
| Turnout | 2677 | 26.96 | |||
| Party | Candidate | Votes | % | ± | |
|---|---|---|---|---|---|
| Conservative | James Hakewell | 1172 | 37.9 | ||
| UKIP | Alan Pote | 971 | 31.4 | ||
| Labour | Margaret Draper | 840 | 27.2 | ||
| Liberal Democrat | Philip Rice | 110 | 3.6 | ||
| Turnout | 3093 | 34.42 | |||
| Party | Candidate | Votes | % | ± | |
|---|---|---|---|---|---|
| Conservative | Russel Roberts | 1113 | 39.6 | ||
| UKIP | Jehad Soliman | 790 | 28.1 | ||
| Labour | Maureen Shram | 775 | 27.6 | ||
| Liberal Democrat | Christopher McGlynn | 135 | 4.8 | ||
| Turnout | 2813 | 30.58 | |||
| Party | Candidate | Votes | % | ± | |
|---|---|---|---|---|---|
| Labour | Eileen Hales | 859 | 36.7 | ||
| UKIP | John Raffill | 704 | 30.1 | ||
| Conservative | Chris Smith-Haynes | 554 | 23.7 | ||
| English Democrat | Derek Hilling | 132 | 5.6 | ||
| Liberal Democrat | David Tate | 91 | 3.9 | ||
| Turnout | 2340 | 26.89 | |||
Northampton
| Party | Candidate | Votes | % | ± | |
|---|---|---|---|---|---|
| Labour | Danielle Stone | 885 | 31.8 | ||
| Conservative | Rebecca Harding | 835 | 30.0 | ||
| Liberal Democrat | Brian Hoare | 452 | 16.3 | ||
| UKIP | Karim Ayoubi | 335 | 12.1 | ||
| Green | Jac Higgs | 273 | 9.8 | ||
| Turnout | 2780 | 20.19 | |||
| Party | Candidate | Votes | % | ± | |
|---|---|---|---|---|---|
| Conservative | Mike Hallam | 1513 | 47.3 | ||
| UKIP | Colin Lill | 732 | 22.9 | ||
| Labour | Ben Wesson | 671 | 21.0 | ||
| Liberal Democrat | Mike Torpy | 194 | 6.1 | ||
| Green | Anthony Lochmuller | 91 | 2.8 | ||
| Turnout | 3201 | 35.7 | |||
| Party | Candidate | Votes | % | ± | |
|---|---|---|---|---|---|
| Labour | Winston Strachan | 806 | 39.5 | ||
| Green | Tony Clarke | 437 | 21.4 | ||
| Conservative | Chris Kellett | 303 | 14.8 | ||
| UKIP | Dusan Torbica | 273 | 13.4 | ||
| Liberal Democrat | Aktar Hussein | 171 | 8.4 | ||
| Independent | Mohammed Azir | 51 | 2.5 | ||
| Turnout | 2041 | 21.1 | |||
| Party | Candidate | Votes | % | ± | |
|---|---|---|---|---|---|
| Labour | Gareth Eales | 937 | 46.1 | ||
| Liberal Democrat | Jenny Conroy | 494 | 24.3 | ||
| Conservative | Luke Graystone | 371 | 18.3 | ||
| Green | Eamonn Fitzpatrick | 230 | 11.3 | ||
| Turnout | 2032 | 23.42 | |||
| Party | Candidate | Votes | % | ± | |
|---|---|---|---|---|---|
| Liberal Democrat | Brendan Glynane | 851 | 34.4 | ||
| Labour | Rhea Keehn | 695 | 28.1 | ||
| Conservative | Andrew Kilbride | 620 | 25.1 | ||
| BNP | Mark Plowman | 216 | 8.7 | ||
| Independent | Steve White† | 92 | 3.7 | ||
| Turnout | 2474 | 27.52 | |||
†Trade Unions & Socialists against cuts
| Party | Candidate | Votes | % | ± | |
|---|---|---|---|---|---|
| Conservative | Suresh Patel | 1039 | 38.9 | ||
| Independent | Dave Green† | 809 | 30.3 | ||
| Labour | Ulric Gravesande | 504 | 18.9 | ||
| Green | Hannah Gibson | 220 | 8.2 | ||
| Liberal Democrat | Michael Quinn | 99 | 3.7 | ||
| Turnout | 2671 | 28.91 | |||
†Northampton Save our Services
| Party | Candidate | Votes | % | ± | |
|---|---|---|---|---|---|
| Conservative | Matthew Golby | 1179 | 61.8 | ||
| Labour | Beverly Mennell | 483 | 25.3 | ||
| Liberal Democrat | Julia Lynne | 246 | 12.9 | ||
| Turnout | 1908 | 27.48 | |||
| Party | Candidate | Votes | % | ± | |
|---|---|---|---|---|---|
| Conservative | Andre Gonzalez de Savage | 1126 | 41.2 | ||
| UKIP | John Howsam | 773 | 28.3 | ||
| Labour | Bob Burnell | 474 | 17.3 | ||
| Green | Gary Burgess | 191 | 7.0 | ||
| Liberal Democrat | Charles Markham | 172 | 6.3 | ||
| Turnout | 2736 | 29.16 | |||
| Party | Candidate | Votes | % | ± | |
|---|---|---|---|---|---|
| Labour | Arthur McCutcheon | 894 | 29.5 | ||
| UKIP | Colin Bricher | 816 | 26.9 | ||
| Conservative | Matt Lynch | 746 | 24.6 | ||
| Liberal Democrat | Marion Minney | 370 | 12.2 | ||
| Green | Marcus Rock | 164 | 5.4 | ||
| BNP | Marc Whitestone | 39 | 1.3 | ||
| Turnout | 3029 | 31.34 | |||
| Party | Candidate | Votes | % | ± | |
|---|---|---|---|---|---|
| UKIP | Michael Brown | 1042 | 33.8 | ||
| Conservative | Mary Markham | 948 | 30.8 | ||
| Labour | Clement Chunga | 691 | 22.4 | ||
| Liberal Democrat | Trini Crake | 304 | 9.9 | ||
| BNP | Peter Whitestone | 97 | 3.1 | ||
| Turnout | 3082 | 31.71 | |||
| Party | Candidate | Votes | % | ± | |
|---|---|---|---|---|---|
| Liberal Democrat | Sally Beardsworth | 872 | 33.8 | ||
| Labour | Zoe Smith | 631 | 26.5 | ||
| UKIP | Colin Pearson | 490 | 20.6 | ||
| Conservative | John Yates | 296 | 12.4 | ||
| Green | David Phillips | 92 | 3.9 | ||
| Turnout | 2381 | 24.11 | |||
| Party | Candidate | Votes | % | ± | |
|---|---|---|---|---|---|
| Conservative | Phil Larratt | 948 | 37.5 | ||
| UKIP | Alan Price | 614 | 24.3 | ||
| Independent | Liam Costello | 450 | 17.8 | ||
| Labour | Steven Brooks | 409 | 16.2 | ||
| Liberal Democrat | Cerri Glynane | 106 | 4.2 | ||
| Turnout | 2527 | 29.44 | |||
| Party | Candidate | Votes | % | ± | |
|---|---|---|---|---|---|
| Conservative | Stephen Legg | 1298 | 40.9 | ||
| UKIP | Kevin Reeve | 850 | 26.8 | ||
| Labour | Janice Duffy | 819 | 25.8 | ||
| Liberal Democrat | Richard Arterton | 203 | 6.4 | ||
| Turnout | 3170 | 31.95 | |||
| Party | Candidate | Votes | % | ± | |
|---|---|---|---|---|---|
| Liberal Democrat | Jill Hope | 865 | 37.4 | ||
| Conservative | Brandon Eldred | 813 | 35.1 | ||
| Labour | Viv Dams | 637 | 27.5 | ||
| Turnout | 2315 | 24.25 | |||
| Party | Candidate | Votes | % | ± | |
|---|---|---|---|---|---|
| Liberal Democrat | Sarah Uldall | 771 | 31.4 | ||
| Labour | Rufia Ashraf | 671 | 27.3 | ||
| UKIP | Robin Fruish | 553 | 22.5 | ||
| Conservative | Michael O'Connor | 334 | 13.6 | ||
| Green | Julie Hawkins | 126 | 5.1 | ||
| Turnout | 2455 | 27.06 | |||
| Party | Candidate | Votes | % | ± | |
|---|---|---|---|---|---|
| Liberal Democrat | Dennis Meredith | 1040 | 38.9 | ||
| Labour | Ifty Choudary | 819 | 30.6 | ||
| UKIP | John Allen | 556 | 20.8 | ||
| Conservative | Sheila Roberts | 260 | 9.7 | ||
| Turnout | 2675 | 27.24 | |||
South Northamptonshire
| Party | Candidate | Votes | % | ± | |
|---|---|---|---|---|---|
| UKIP | Jim Broomfield | 1012 | 38.7 | ||
| Conservative | Ron Sawbridge | 952 | 36.4 | ||
| Labour | Douglas Barry | 422 | 16.1 | ||
| Liberal Democrat | Jane Hollis | 231 | 8.8 | ||
| Turnout | 2617 | 25.63 | |||
| Party | Candidate | Votes | % | ± | |
|---|---|---|---|---|---|
| Conservative | Joan Kirkbride | 1758 | 48.9 | ||
| UKIP | Wes Charlesworth | 1150 | 32.0 | ||
| Labour | Lynda Davies | 486 | 13.5 | ||
| Liberal Democrat | Shaun Hope | 200 | 5.6 | ||
| Turnout | 3594 | 35.03 | |||
| Party | Candidate | Votes | % | ± | |
|---|---|---|---|---|---|
| Conservative | Allen Walker | 1708 | 63.0 | ||
| Labour | John Rawlings | 671 | 24.8 | ||
| Liberal Democrat | Lisa Samiotis | 330 | 12.2 | ||
| Turnout | 2709 | 33.44 | |||
| Party | Candidate | Votes | % | ± | |
|---|---|---|---|---|---|
| Conservative | Michael Clarke | 1553 | 42.3 | ||
| UKIP | Tom Rubython | 1504 | 41.0 | ||
| Labour | Ian Grant | 449 | 12.2 | ||
| Liberal Democrat | Angela Paterson | 165 | 4.5 | ||
| Turnout | 3671 | 36.59 | |||
| Party | Candidate | Votes | % | ± | |
|---|---|---|---|---|---|
| Conservative | Ken Melling | 1165 | 42.8 | ||
| UKIP | Stafford Nash | 963 | 35.4 | ||
| Labour | Bernard Rooney | 357 | 13.1 | ||
| Liberal Democrat | Martin Johns | 239 | 8.8 | ||
| Turnout | 2724 | 30.55 | |||
| Party | Candidate | Votes | % | ± | |
|---|---|---|---|---|---|
| Conservative | Ian Morris | 1676 | 48.3 | ||
| UKIP | Peter Conquest | 982 | 28.3 | ||
| Labour | Lucy Mills | 527 | 15.2 | ||
| Liberal Democrat | Scott Collins | 286 | 8.2 | ||
| Turnout | 3471 | 34.74 | |||
| Party | Candidate | Votes | % | ± | |
|---|---|---|---|---|---|
| Conservative | Michael Clarke | 1553 | 42.3 | ||
| UKIP | Tom Rubython | 1504 | 41.0 | ||
| Labour | Ian Grant | 449 | 12.2 | ||
| Liberal Democrat | Angela Paterson | 165 | 4.5 | ||
| Turnout | 3671 | 36.59 | |||
| Party | Candidate | Votes | % | ± | |
|---|---|---|---|---|---|
| Liberal Democrat | Chris Lofts | 1226 | 35.6 | ||
| Conservative | Andrew Grant | 976 | 28.3 | ||
| UKIP | Barry Mahoney | 799 | 23.2 | ||
| Labour | Mike Caseman-Jones | 408 | 11.8 | ||
| BNP | John Hughes | 36 | 1.0 | ||
| Turnout | 3445 | 33.58 | |||
Wellingborough
| Party | Candidate | Votes | % | ± | |
|---|---|---|---|---|---|
| Labour | Elizabeth Coombe | 899 | 32.2 | ||
| Conservative | David Dean | 874 | 31.3 | ||
| UKIP | Michael Curtis | 835 | 29.9 | ||
| Green | Jonathan Hornett | 110 | 3.9 | ||
| BNP | David Robinson | 70 | 2.5 | ||
| Turnout | 2788 | 30.47 | |||
| Party | Candidate | Votes | % | ± | |
|---|---|---|---|---|---|
| Conservative | Grayham Lawman | 944 | 37.9 | ||
| Labour | Tony Aslam | 797 | 32.0 | ||
| UKIP | Peter Jakeways | 604 | 24.2 | ||
| English Democrat | Tony Spencer | 149 | 6.0 | ||
| Turnout | 2494 | 28.06 | |||
| Party | Candidate | Votes | % | ± | |
|---|---|---|---|---|---|
| Conservative | Paul Bell | 1768 | 46.0 | ||
| UKIP | Debra Elderton | 1090 | 28.4 | ||
| Labour | Kevin Watts | 802 | 20.9 | ||
| Liberal Democrat | Daniel Jones | 183 | 4.8 | ||
| Turnout | 3843 | 39.28 | |||
| Party | Candidate | Votes | % | ± | |
|---|---|---|---|---|---|
| Conservative | Peter Bhupendra | 997 | 34.0 | ||
| Labour | James Ashton | 944 | 32.5 | ||
| UKIP | Gary Evans | 868 | 29.9 | ||
| Liberal Democrat | John Weaver | 104 | 3.6 | ||
| Turnout | 2903 | 31.88 | |||
| Party | Candidate | Votes | % | ± | |
|---|---|---|---|---|---|
| Conservative | Sue Homer | 1429 | 41.3 | ||
| Labour | Tim Maguire | 1239 | 35.8 | ||
| UKIP | Tony Giddings | 790 | 22.8 | ||
| Turnout | 3458 | 40.39 | |||
Interim By-elections and Defections
Between 2009 and 2013, the only change to council composition were defections from the Conservatives who lost four councillors: one to UKIP, one to the Liberal Democrats and two went independent.
Notes and References
- Notes
- ↑ Accordingly, the Council's expert opinion on the matter of comparison of any electoral division results before and after is expressed as "This makes division-by-division comparisons between the result of this election and the previous election very difficult. For this reason, we will not be presenting the information in terms of which parties have held or gained/lost seats." However a proportionate measure of the results provides the following exact seat distribution, which rounded to one decimal place, is used for the overall measure of parties strengths: Conservatives:43.7 Labour:4.7 Liberal Democrats:7.0 Independent:1.5 UKIP:0
- References
- ↑ - Dorset results BBC News. Retrieved 2013-05-13
- ↑ "The Representation of the People (Form of Canvass) (England and Wales) Regulations 2006, Schedule Part 1". Legislation.gov.uk. 13 October 2011. Retrieved 18 April 2012.
- ↑ "I have two homes. Can I register at both addresses?". The Electoral Commission. Retrieved 5 January 2011.
- 1 2 3 4 5 "Detailed Results for Corby". Retrieved 4 March 2014.
| Northamptonshire County Council | |
|---|---|
| Corby Borough Council | |
| Daventry District Council | |
| East Northamptonshire District Council |
|
| Kettering Borough Council | |
| Northampton Borough Council | |
| South Northamptonshire District Council |
|
| Wellingborough Borough Council |
|
| |