Shropshire Council election, 2013
| |||||||||||||||||||||||||||||||
| |||||||||||||||||||||||||||||||
|
| |||||||||||||||||||||||||||||||
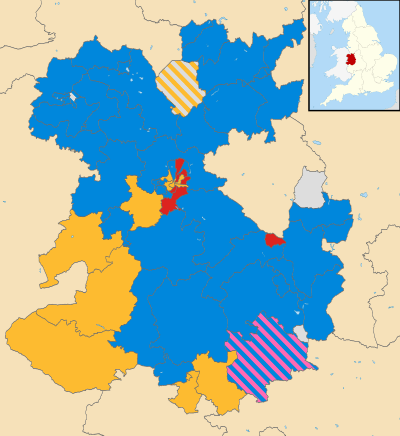
| Map showing the results of the 2013 elections. Blue showing Conservative, red showing Labour, yellow showing Liberal Democrats, grey showing independents and pink showing ICHC. Striped divisions have mixed representation. | |||||||||||||||||||||||||||||||
| |||||||||||||||||||||||||||||||
Elections to Shropshire Council were held on 2 May 2013 as part of the United Kingdom local elections, 2013. These were the second elections to the unitary authority created as part of local government restructuring in Shropshire, following on from the previous elections in 2009.[1] All 74 seats in the 63 electoral divisions (consisting of 53 single member divisions, nine 2-member divisions and one 3-member electoral division) were up for election across Shropshire. At the same time, all town and parish council contested elections took place, most notably including Shrewsbury Town Council.[2]
The Conservative party retained control of the Council, though with a slightly reduced majority, with 3 fewer seats compared to just prior to the election.
All locally registered electors (British, Irish, Commonwealth and European Union citizens) who were aged 18 or over on Thursday 2 May 2013 were entitled to vote in the local elections. Those who were temporarily away from their ordinary address (for example, away working, on holiday, in student accommodation or in hospital) were also entitled to vote in the local elections.[3]
Previous council
Shropshire Council was Conservative controlled prior to the 2013 election, with 51 Conservative councillors immediately before the election. The Conservatives won 54 seats at the 2009 election, but lost three of these in by-elections during the term.
The Liberal Democrats won 11 seats at the 2009 election, but increased their numbers to 14 during the term, gaining at the by-elections from the Conservatives. Labour had 7 seats, Independent Community and Health Concern one seat, and a final seat was held by an independent.
Changes to divisions
There were no changes to division boundaries or seat allocations since 2009, but two divisions changed their names: 'Minsterley' to 'Rea Valley', and 'Selattyn and Gobowen' to 'Gobowen, Selattyn and Western Rhyn'.[4]
Uncontested elections
In six electoral divisions the number of candidates nominated equalled the number of councillors to be elected, so these seats were uncontested. They were Corvedale, Shawbury, St Oswald, The Meres, Whitchurch North (two members), and Whitchurch South. The seven candidates elected unopposed were all Conservatives.[5] This resulted in more than 20,000 people being refused a vote including the whole town of Whitchurch.[6]
Results
The results, according to the council's website:[7]
Summary
| Shropshire Council election, 2013 | ||||||||||
|---|---|---|---|---|---|---|---|---|---|---|
| Party | Seats | Gains | Losses | Net gain/loss | Seats % | Votes % | Votes | +/− | ||
| Conservative | 48 | -6 | 26,578 | |||||||
| Liberal Democrat | 12 | +1 | 15,979 | |||||||
| Labour | 9 | +2 | 17,592 | |||||||
| Health Concern | 1 | ±0 | 1,181 | |||||||
| Independent | 4 | +3 | 5,206 | |||||||
| UKIP | 0 | 0 | 0 | 0 | 0 | 9,318 | ||||
| Green | 0 | 0 | 0 | 0 | 0 | 1,080 | ||||
| BNP | 0 | 0 | 0 | 0 | 0 | 615 | ||||
| Total | 77,549 | |||||||||
Abbey
| Party | Candidate | Votes | % | ± | |
|---|---|---|---|---|---|
| Liberal Democrat | Hannah Fraser | 675 | 51.9 | +6.6 | |
| Conservative | Maria Felton | 247 | 19.0 | -25.9 | |
| UKIP | Jenny Price | 164 | 12.6 | N/A | |
| Labour | Paul Morris | 154 | 11.8 | N/A | |
| Green | John Brown | 61 | 4.7 | -5.3 | |
| Majority | 428 | ||||
| Turnout | 1,308 | 43.2 | |||
| Liberal Democrat gain from Conservative | Swing | ||||
Albrighton
| Party | Candidate | Votes | % | ± | |
|---|---|---|---|---|---|
| Conservative | Malcolm Pate | 690 | 55.0 | ||
| UKIP | John Smith | 273 | 21.8 | ||
| Labour | Deborah Williams-Ruth | 173 | 13.8 | ||
| Green | Phil Harrison | 119 | 9.4 | ||
| Majority | |||||
| Turnout | |||||
| Conservative hold | Swing | ||||
Alveley and Claverley
| Party | Candidate | Votes | % | ± | |
|---|---|---|---|---|---|
| Conservative | Tina Woodward | 653 | 59.5 | ||
| UKIP | Vanessa Lee | 270 | 24.6 | ||
| Liberal Democrat | Frederick Voysey | 175 | 16.0 | ||
| Majority | |||||
| Turnout | |||||
| Conservative hold | Swing | ||||
Bagley
| Party | Candidate | Votes | % | ± | |
|---|---|---|---|---|---|
| Conservative | Dean Carroll | 354 | 32.7 | -8.8 | |
| Liberal Democrat | Beverley Baker | 346 | 31.9 | -26.6 | |
| Labour Co-op | Ashley Vaughan-Evans | 324 | 29.9 | N/A | |
| Green | Kayleigh Gough | 59 | 5.4 | N/A | |
| Majority | 8 | ||||
| Turnout | 1,089 | 30.5 | |||
| Conservative gain from Liberal Democrat | Swing | ||||
Battlefield
| Party | Candidate | Votes | % | ± | |
|---|---|---|---|---|---|
| Conservative | Malcolm Price | 389 | 62.0 | 0.0 | |
| Labour Co-op | Connor Jones | 238 | 38.0 | +16.2 | |
| Majority | 151 | 24.1 | |||
| Turnout | 636 | 21.9 | |||
| Conservative hold | Swing | ||||
Bayston Hill, Column and Sutton
| Party | Candidate | Votes | % | ± | |
|---|---|---|---|---|---|
| Labour | Ted Clarke | 2,286 | 21.3 | +2.4 | |
| Labour | Jon Tandy | 2,256 | 21.0 | +3.1 | |
| Labour | Jane Mackenzie | 1,866 | 17.5 | +0.4 | |
| Conservative | Will Coles | 1,139 | 10.6 | -5.8 | |
| Conservative | Chris Lewis | 1,105 | 10.3 | -5.8 | |
| Conservative | Tim Milsom | 934 | 8.7 | -4.9 | |
| UKIP | Terrence Lee | 848 | 7.9 | N/A | |
| Liberal Democrat | Robert Lea | 293 | 2.7 | N/A | |
| Majority | |||||
| Majority | |||||
| Majority | |||||
| Turnout | 4,062 | 41.5 | |||
| Labour hold | Swing | ||||
| Labour hold | Swing | ||||
| Labour hold | Swing | ||||
Belle Vue
| Party | Candidate | Votes | % | ± | |
|---|---|---|---|---|---|
| Labour | Mansel Williams | 939 | 76.5 | +28.1 | |
| Conservative | Valerie Jones | 289 | 23.5 | -11.2 | |
| Majority | 650 | ||||
| Turnout | 1,236 | 36.1 | |||
| Labour hold | Swing | ||||
Bishop's Castle
| Party | Candidate | Votes | % | ± | |
|---|---|---|---|---|---|
| Liberal Democrat | Charlotte Barnes | 907 | 62.0 | ||
| Conservative | James Garnier | 449 | 30.7 | ||
| Green | Hilary Wendt | 107 | 7.3 | ||
| Majority | |||||
| Turnout | |||||
| Liberal Democrat hold | Swing | ||||
Bowbrook
| Party | Candidate | Votes | % | ± | |
|---|---|---|---|---|---|
| Conservative | Peter Adams | 604 | 65.6 | -9.7 | |
| Labour Co-op | Danny Sweeney | 317 | 34.4 | +9.7 | |
| Majority | 287 | ||||
| Turnout | 937 | 31.5 | |||
| Conservative hold | Swing | ||||
Bridgnorth East and Astley Abbotts
| Party | Candidate | Votes | % | ± | |
|---|---|---|---|---|---|
| Conservative | Christian Lea | 704 | 25.0 | ||
| Conservative | William Parr | 614 | 21.8 | ||
| UKIP | Adrian Thomas | 446 | 16.6 | ||
| UKIP | Sam Whitehouse | 433 | 15.4 | ||
| Liberal Democrat | Vanessa Voysey | 304 | 10.8 | ||
| Liberal Democrat | Glynis Frater | 290 | 10.3 | ||
| Majority | |||||
| Turnout | |||||
| Conservative hold | Swing | ||||
| Conservative hold | Swing | ||||
Bridgnorth West and Tasley
| Party | Candidate | Votes | % | ± | |
|---|---|---|---|---|---|
| Conservative | Les Winwood | 830 | 26.8 | ||
| Conservative | John Hurst-Knight | 656 | 21.6 | ||
| UKIP | Rod Evans | 530 | 17.1 | ||
| UKIP | Roger Hipkiss | 447 | 14.5 | ||
| Liberal Democrat | Helen Howell | 372 | 12.0 | ||
| Liberal Democrat | Davis Walker | 259 | 8.4 | ||
| Majority | |||||
| Majority | |||||
| Turnout | |||||
| Conservative hold | Swing | ||||
| Conservative hold | Swing | ||||
Broseley
| Party | Candidate | Votes | % | ± | |
|---|---|---|---|---|---|
| Labour | Jean Jones | 706 | 65.7 | ||
| UKIP | Derek Armstrong | 235 | 21.9 | ||
| Conservative | Colin Cundy | 133 | 12.4 | ||
| Majority | |||||
| Turnout | |||||
| Labour hold | Swing | ||||
Brown Clee
| Party | Candidate | Votes | % | ± | |
|---|---|---|---|---|---|
| Conservative | Robert Tindall | 486 | 50.5 | ||
| Independent | George Lee | 250 | 26.0 | ||
| UKIP | Stephen Dean | 226 | 23.5 | ||
| Majority | |||||
| Turnout | |||||
| Conservative hold | Swing | ||||
Burnell
| Party | Candidate | Votes | % | ± | |
|---|---|---|---|---|---|
| Conservative | Tim Barker | 937 | 65.3 | -9.8 | |
| Liberal Democrat | Kate King | 499 | 34.7 | +9.8 | |
| Majority | 438 | 30.5 | |||
| Turnout | 1,462 | 43.2 | |||
| Conservative hold | Swing | ||||
Castlefields and Ditherington
| Party | Candidate | Votes | % | ± | |
|---|---|---|---|---|---|
| Labour | Alan Mosley | 937 | 86.1 | +28.9 | |
| Conservative | Jenny Hodges | 108 | 9.9 | -12.1 | |
| Liberal Democrat | Janine Clarke | 43 | 4.0 | N/A | |
| Majority | 829 | ||||
| Turnout | 1,094 | 31.3 | |||
| Labour hold | Swing | ||||
Cheswardine
| Party | Candidate | Votes | % | ± | |
|---|---|---|---|---|---|
| Conservative | Andrew Davies | 545 | 70.9 | ||
| Labour | Mark Williams | 224 | 29.1 | ||
| Majority | |||||
| Turnout | |||||
| Conservative hold | Swing | ||||
Chirbury and Worthen
| Party | Candidate | Votes | % | ± | |
|---|---|---|---|---|---|
| Liberal Democrat | Heather Kidd | 1012 | 81.3 | ||
| Conservative | Andrew Sayer | 233 | 18.7 | ||
| Majority | 779 | ||||
| Turnout | 1,256 | 52.3 | |||
| Liberal Democrat hold | Swing | ||||
Church Stretton and Craven Arms
| Party | Candidate | Votes | % | ± | |
|---|---|---|---|---|---|
| Conservative | Lee Chapman | 1423 | 28.5 | ||
| Conservative | David Evans | 1284 | 25.7 | ||
| Liberal Democrat | Bob Welch | 885 | 17.7 | ||
| Liberal Democrat | Anne Dyer | 741 | 14.9 | ||
| Labour | Jean Gray | 382 | 7.7 | ||
| Labour | Michael Penn | 275 | 5.5 | ||
| Majority | |||||
| Majority | |||||
| Turnout | |||||
| Conservative hold | Swing | ||||
| Conservative hold | Swing | ||||
Clee
| Party | Candidate | Votes | % | ± | |
|---|---|---|---|---|---|
| Liberal Democrat | Richard Huffer | 721 | 48.7 | ||
| Conservative | James Wheeler | 654 | 44.2 | ||
| Labour | Sam Mann | 105 | 7.1 | ||
| Majority | |||||
| Turnout | |||||
| Liberal Democrat gain from Conservative | Swing | ||||
Cleobury Mortimer
| Party | Candidate | Votes | % | ± | |
|---|---|---|---|---|---|
| Health Concern | Madge Shineton | 1181 | 35.6 | ||
| Conservative | Gwilym Butler | 1011 | 30.5 | ||
| UKIP | Maurice Alton | 673 | 20.3 | ||
| Independent | Peter Martin | 452 | 13.7 | ||
| Majority | |||||
| Majority | |||||
| Turnout | |||||
| Health Concern hold | Swing | ||||
| Conservative hold | Swing | ||||
Clun
| Party | Candidate | Votes | % | ± | |
|---|---|---|---|---|---|
| Liberal Democrat | Nigel Hartin | 714 | 45.7 | ||
| Conservative | Jackie Williams | 522 | 33.4 | ||
| UKIP | Deborah Brownlee | 195 | 12.5 | ||
| Green | Janet Phillips | 131 | 8.4 | ||
| Majority | 192 | ||||
| Turnout | 1,566 | 50.2 | |||
| Liberal Democrat hold | Swing | ||||
Copthorne
| Party | Candidate | Votes | % | ± | |
|---|---|---|---|---|---|
| Conservative | Peter Nutting | 569 | 49.7 | -4.0 | |
| Labour | Mark Jones | 240 | 21.0 | N/A | |
| UKIP | John Price | 234 | 20.5 | N/A | |
| Liberal Democrat | Trudy Smith | 101 | 8.8 | -37.5 | |
| Majority | 229 | ||||
| Turnout | 1,152 | 36.7 | |||
| Conservative hold | Swing | ||||
Corvedale
| Party | Candidate | Votes | % | ± | |
|---|---|---|---|---|---|
| Conservative | Cecilia Motley | ||||
| Conservative hold | Swing | ||||
Ellesmere Urban
| Party | Candidate | Votes | % | ± | |
|---|---|---|---|---|---|
| Conservative | Elizabeth Hartley | 478 | 52.9 | ||
| Liberal Democrat | Brian Knight | 425 | 47.1 | ||
| Majority | |||||
| Turnout | |||||
| Conservative hold | Swing | ||||
Gobowen, Selattyn and Weston Rhyn
| Party | Candidate | Votes | % | ± | |
|---|---|---|---|---|---|
| Conservative | David Lloyd | 747 | 37.7 | ||
| Conservative | Robert Macey | 655 | 33.1 | ||
| Independent | Paul Jones | 578 | 29.2 | ||
| Majority | |||||
| Majority | |||||
| Turnout | |||||
| Conservative hold | Swing | ||||
| Conservative gain from Liberal Democrat | Swing | ||||
Harlescott
| Party | Candidate | Votes | % | ± | |
|---|---|---|---|---|---|
| Labour | Vernon Bushell | 604 | 68.7 | +28.9 | |
| Conservative | Phil Sandford | 275 | 31.3 | -2.9 | |
| Majority | 329 | ||||
| Turnout | 890 | 26.1 | |||
| Conservative hold | Swing | ||||
Highley
| Party | Candidate | Votes | % | ± | |
|---|---|---|---|---|---|
| Independent | Dave Tremellen | 374 | 55.3 | ||
| UKIP | Paul Brown | 178 | 26.3 | ||
| Liberal Democrat | David Voysey | 124 | 18.3 | ||
| Majority | |||||
| Turnout | |||||
| Independent gain from Liberal Democrat | Swing | ||||
Hodnet
| Party | Candidate | Votes | % | ± | |
|---|---|---|---|---|---|
| Conservative | Karen Calder | 549 | 67.6 | ||
| UKIP | Andrew Carter | 263 | 32.4 | ||
| Majority | |||||
| Turnout | |||||
| Conservative hold | Swing | ||||
Llanymynech
| Party | Candidate | Votes | % | ± | |
|---|---|---|---|---|---|
| Conservative | Arthur Walpole | 654 | 67.4 | ||
| UKIP | John Adlington | 317 | 32.6 | ||
| Majority | |||||
| Turnout | |||||
| Conservative hold | Swing | ||||
Longden
| Party | Candidate | Votes | % | ± | |
|---|---|---|---|---|---|
| Liberal Democrat | Roger Evans | 817 | 51.5 | -6.9 | |
| Conservative | Dan Morris | 531 | 33.5 | -8.1 | |
| UKIP | Ian Minshall | 138 | 8.7 | N/A | |
| Labour Co-op | Mohan Jones | 100 | 6.3 | N/A | |
| Majority | 286 | ||||
| Turnout | 1,593 | 50.0 | |||
| Liberal Democrat hold | Swing | ||||
Loton
| Party | Candidate | Votes | % | ± | |
|---|---|---|---|---|---|
| Conservative | David Roberts | 927 | 80.1 | +5.3 | |
| Liberal Democrat | Fred Smith | 230 | 19.9 | -5.3 | |
| Majority | 697 | ||||
| Turnout | 1,187 | 38.2 | |||
| Conservative hold | Swing | ||||
Ludlow East
| Party | Candidate | Votes | % | ± | |
|---|---|---|---|---|---|
| Liberal Democrat | Tracey Huffer | 467 | 50.5 | ||
| Conservative | Diane Lyle | 210 | 22.7 | ||
| Labour | Colin Sheward | 184 | 19.9 | ||
| Green | Imogen Jones | 64 | 6.9 | ||
| Majority | 257 | ||||
| Turnout | 947 | 29.4 | |||
| Liberal Democrat hold | Swing | ||||
Ludlow North
| Party | Candidate | Votes | % | ± | |
|---|---|---|---|---|---|
| Conservative | Rosanna Taylor-Smith | 505 | 40.4 | ||
| Liberal Democrat | Andy Boddington | 420 | 33.6 | ||
| UKIP | Chris Woodward | 126 | 10.1 | ||
| Labour | James Hooper | 109 | 8.7 | ||
| Green | Frances Newman | 69 | 5.5 | ||
| Independent | Jennifer Leyton-Purrier | 21 | 1.7 | ||
| Majority | 85 | ||||
| Turnout | 1,252 | 40.6 | |||
| Conservative hold | Swing | ||||
Ludlow South
| Party | Candidate | Votes | % | ± | |
|---|---|---|---|---|---|
| Liberal Democrat | Vivienne Parry | 639 | 47.2 | ||
| Conservative | Martin Taylor-Smith | 415 | 30.6 | ||
| Independent | Graeme Perks | 182 | 13.4 | ||
| UKIP | Maurice Knott | 119 | 8.8 | ||
| Majority | 224 | ||||
| Turnout | 1,358 | 42.2 | |||
| Liberal Democrat gain from Conservative | Swing | ||||
Market Drayton East
| Party | Candidate | Votes | % | ± | |
|---|---|---|---|---|---|
| Conservative | John Cadwallader | 524 | 45.6 | ||
| Independent | Roy Aldcroft | 272 | 23.7 | ||
| Labour | Darren Taylor | 241 | 21.0 | ||
| Independent | Roy Tydeman | 112 | 9.8 | ||
| Majority | |||||
| Turnout | |||||
| Conservative hold | Swing | ||||
Market Drayton West
| Party | Candidate | Votes | % | ± | |
|---|---|---|---|---|---|
| Conservative | Roger Hughes | 684 | 23.1 | ||
| Conservative | David Minnery | 653 | 22.0 | ||
| UKIP | Steve Glover | 592 | 20.0 | ||
| Labour | Val Taylor | 487 | 16.4 | ||
| Labour | Rob Bentley | 417 | 14.1 | ||
| BNP | Phil Reddall | 134 | 4.5 | ||
| Majority | |||||
| Majority | |||||
| Turnout | |||||
| Conservative hold | Swing | ||||
| Conservative hold | Swing | ||||
Meole
| Party | Candidate | Votes | % | ± | |
|---|---|---|---|---|---|
| Conservative | Michael Owen | 689 | 54.9 | -16.4 | |
| Labour Co-op | David French | 473 | 37.7 | N/A | |
| Liberal Democrat | Margaret Hamer | 92 | 7.3 | -21.4 | |
| Majority | 216 | ||||
| Turnout | 1,274 | 39.9 | |||
| Conservative hold | Swing | ||||
Monkmoor
| Party | Candidate | Votes | % | ± | |
|---|---|---|---|---|---|
| Labour | Pam Moseley | 658 | 62.1 | +13.3 | |
| Conservative | Tony Durnell | 328 | 31.0 | -20.2 | |
| Liberal Democrat | Grant Pennington | 73 | 6.9 | N/A | |
| Majority | 330 | ||||
| Turnout | 1,067 | 31.5 | |||
| Labour gain from Conservative | Swing | ||||
Much Wenlock
| Party | Candidate | Votes | % | ± | |
|---|---|---|---|---|---|
| Conservative | David Turner | 691 | 48.7 | ||
| Liberal Democrat | Joff Watson | 293 | 20.7 | ||
| Independent | David Gibbon | 140 | 9.8 | ||
| Independent | Lesley Durbin | 113 | 8.0 | ||
| Independent | Phill Hipkiss | 113 | 8.0 | ||
| Independent | Malcolm Macintyre-Read | 68 | 4.8 | ||
| Majority | |||||
| Turnout | |||||
| Conservative hold | Swing | ||||
Oswestry East
| Party | Candidate | Votes | % | ± | |
|---|---|---|---|---|---|
| Independent | Peter Cherrington | 611 | 25.8 | ||
| Conservative | Martin Bennett | 583 | 24.7 | ||
| Labour | Graeme Currie | 551 | 23.4 | ||
| Conservative | Chris Schofield | 453 | 19.1 | ||
| BNP | Jim Matthys | 169 | 7.1 | ||
| Majority | |||||
| Majority | |||||
| Turnout | |||||
| Independent gain from Conservative | Swing | ||||
| Conservative hold | Swing | ||||
Oswestry South
| Party | Candidate | Votes | % | ± | |
|---|---|---|---|---|---|
| Conservative | Keith Barrow | 488 | 50.0 | ||
| Green | Duncan Kerr | 337 | 31.7 | ||
| UKIP | Penny Cotton | 175 | 16.5 | ||
| Liberal Democrat | Romer Hoseason | 62 | 5.8 | ||
| Majority | |||||
| Turnout | |||||
| Conservative hold | Swing | ||||
Oswestry West
| Party | Candidate | Votes | % | ± | |
|---|---|---|---|---|---|
| Conservative | Vince Hunt | 588 | 79.4 | ||
| BNP | Alice Matthys | 145 | 20.6 | ||
| Majority | |||||
| Turnout | |||||
| Conservative hold | Swing | ||||
Porthill
| Party | Candidate | Votes | % | ± | |
|---|---|---|---|---|---|
| Liberal Democrat | Anne Chebsey | 501 | 39.9 | -16.9 | |
| Conservative | Judie McCoy | 432 | 34.4 | -8.8 | |
| Labour | Amy Liebich | 189 | 15.1 | N/A | |
| Green | Alan Whittaker | 133 | 10.6 | N/A | |
| Majority | 69 | ||||
| Turnout | 1,266 | 37.3 | |||
| Liberal Democrat hold | Swing | ||||
Prees
| Party | Candidate | Votes | % | ± | |
|---|---|---|---|---|---|
| Conservative | Paul Wynn | 614 | 63.4 | ||
| UKIP | Andrew Irvine-List | 355 | 36.6 | ||
| Majority | |||||
| Turnout | |||||
| Conservative hold | Swing | ||||
Quarry and Coton Hill
| Party | Candidate | Votes | % | ± | |
|---|---|---|---|---|---|
| Liberal Democrat | Andrew Bannerman | 451 | 47.1 | +5.3 | |
| Conservative | Carol Foster | 311 | 32.5 | +1.0 | |
| Labour Co-op | John Lewis | 196 | 20.5 | -2.6 | |
| Majority | 140 | ||||
| Turnout | 966 | 30.7 | |||
| Liberal Democrat gain from Conservative | Swing | ||||
Radbrook
| Party | Candidate | Votes | % | ± | |
|---|---|---|---|---|---|
| Conservative | Keith Roberts | 592 | 45.8 | -5.2 | |
| Liberal Democrat | Christine Tinker | 398 | 30.8 | -18.2 | |
| Labour | Jeanette Petherbridge | 302 | 23.4 | N/A | |
| Majority | 194 | ||||
| Turnout | 1,302 | 38.5 | |||
| Conservative hold | Swing | ||||
Rea Valley
| Party | Candidate | Votes | % | ± | |
|---|---|---|---|---|---|
| Conservative | Tudor Bebb | 512 | 49.0 | -11.5 | |
| UKIP | Peter Lewis | 298 | 28.5 | N/A | |
| Labour Co-op | Joe Crosland | 137 | 13.1 | N/A | |
| Liberal Democrat | David Ellams | 98 | 9.4 | -15.6 | |
| Majority | 214 | ||||
| Turnout | 1,048 | 32.5 | |||
| Conservative hold | Swing | ||||
Ruyton and Baschurch
| Party | Candidate | Votes | % | ± | |
|---|---|---|---|---|---|
| Conservative | Nicholas Bardsley | 371 | 34.6 | ||
| UKIP | Jonathan Carr | 331 | 30.9 | ||
| Liberal Democrat | Colin Case | 279 | 26.0 | ||
| Labour | Netty Brook | 91 | 8.5 | ||
| Majority | |||||
| Turnout | |||||
| Conservative hold | Swing | ||||
Severn Valley
| Party | Candidate | Votes | % | ± | |
|---|---|---|---|---|---|
| Conservative | Claire Wild | 946 | 78.2 | N/A | |
| Labour Co-op | Jeevan Jones | 174 | 14.4 | N/A | |
| Liberal Democrat | Rob Harper | 90 | 7.4 | N/A | |
| Majority | 772 | ||||
| Turnout | 1,226 | 36.2 | |||
| Conservative hold | Swing | ||||
Shawbury
| Party | Candidate | Votes | % | ± | |
|---|---|---|---|---|---|
| Conservative | Simon Jones | ||||
| Conservative hold | Swing | ||||
Shifnal North
| Party | Candidate | Votes | % | ± | |
|---|---|---|---|---|---|
| Independent | Kevin Turley | 524 | 40.1 | ||
| Conservative | Gordon Tonkinson | 446 | 34.2 | ||
| UKIP | Richard Choudhary | 234 | 17.9 | ||
| Independent | John Horne | 102 | 7.8 | ||
| Majority | |||||
| Turnout | |||||
| Independent gain from Conservative | Swing | ||||
Shifnal South and Cosford
| Party | Candidate | Votes | % | ± | |
|---|---|---|---|---|---|
| Conservative | Stuart West | 658 | 59.8 | ||
| UKIP | Andrew Mitchell | 443 | 40.2 | ||
| Majority | |||||
| Turnout | |||||
| Conservative hold | Swing | ||||
St Martin's
| Party | Candidate | Votes | % | ± | |
|---|---|---|---|---|---|
| Conservative | Steve Davenport | 465 | 48.8 | ||
| Labour | Hannah Guntrip | 301 | 31.6 | ||
| Independent | Neil Graham | 187 | 19.6 | ||
| Majority | |||||
| Turnout | |||||
| Conservative hold | Swing | ||||
St Oswald
| Party | Candidate | Votes | % | ± | |
|---|---|---|---|---|---|
| Conservative | Joyce Barrow | ||||
| Conservative hold | Swing | ||||
Sundorne
| Party | Candidate | Votes | % | ± | |
|---|---|---|---|---|---|
| Labour | Kevin Pardy | 545 | 66.2 | +30.1 | |
| Conservative | Karen Burgoyne | 219 | 26.6 | -19.6 | |
| BNP | Karl Foulkes | 59 | 7.2 | -10.4 | |
| Majority | 326 | ||||
| Turnout | 833 | 26.3 | |||
| Labour gain from Conservative | Swing | ||||
Tern
| Party | Candidate | Votes | % | ± | |
|---|---|---|---|---|---|
| Conservative | John Everall | 721 | 61.6 | -0.4 | |
| Labour Co-op | Kathryn Brooke | 249 | 21.3 | N/A | |
| Liberal Democrat | Helen Woodman | 200 | 17.1 | -20.9 | |
| Majority | 472 | ||||
| Turnout | 1,183 | 33.2 | |||
| Conservative hold | Swing | ||||
The Meres
| Party | Candidate | Votes | % | ± | |
|---|---|---|---|---|---|
| Conservative | Brian Williams | ||||
| Conservative hold | Swing | ||||
Underdale
| Party | Candidate | Votes | % | ± | |
|---|---|---|---|---|---|
| Liberal Democrat | Miles Kenny | 661 | 64.6 | -3.1 | |
| Labour Co-op | Sue Batchelor | 162 | 15.8 | +6.4 | |
| UKIP | Jan Allmark | 122 | 11.9 | N/A | |
| Conservative | Robert Osborne | 78 | 7.6 | -2.4 | |
| Majority | 499 | ||||
| Turnout | 1,032 | 32.4 | |||
| Liberal Democrat hold | Swing | ||||
Wem
| Party | Candidate | Votes | % | ± | |
|---|---|---|---|---|---|
| Liberal Democrat | John Mellings | 1,322 | 39.0 | ||
| Independent | Pauline Dee | 1,107 | 32.7 | ||
| Conservative | Peter Broomhall | 782 | 23.1 | ||
| BNP | Ian Deakin | 108 | 5.3 | ||
| Majority | |||||
| Majority | |||||
| Turnout | |||||
| Liberal Democrat hold | Swing | ||||
| Independent hold | Swing | ||||
Whitchurch North
| Party | Candidate | Votes | % | ± | |
|---|---|---|---|---|---|
| Conservative | Thomas Biggins | ||||
| Conservative | Peggy Mullock | ||||
| Conservative hold | Swing | ||||
| Conservative hold | Swing | ||||
Whitchurch South
| Party | Candidate | Votes | % | ± | |
|---|---|---|---|---|---|
| Conservative | Gerald Dakin | ||||
| Conservative hold | Swing | ||||
Whittington
| Party | Candidate | Votes | % | ± | |
|---|---|---|---|---|---|
| Conservative | Steve Charmley | 517 | 56.6 | ||
| UKIP | David Baynham | 397 | 43.4 | ||
| Majority | |||||
| Turnout | |||||
| Conservative hold | Swing | ||||
Worfield
| Party | Candidate | Votes | % | ± | |
|---|---|---|---|---|---|
| Conservative | Michael Wood | 607 | 70.3 | ||
| UKIP | Brian Seymour | 256 | 29.7 | ||
| Majority | |||||
| Turnout | |||||
| Conservative hold | Swing | ||||
References
- ↑ http://www.parliament.uk/briefing-papers/SN06491
- ↑ http://shropshire.gov.uk/democracy.nsf/open/495DA3312EA52E8680257ADA003A4582
- ↑ "The Representation of the People (Form of Canvass) (England and Wales) Regulations 2006, Schedule Part 1". Legislation.gov.uk. 13 October 2011. Retrieved 18 April 2012.
- ↑ http://www.shropshire.gov.uk/committee.nsf/0/20840FDA07F99D668025773E00335775/$file/15%20Community%20Governance%20Review.pdf
- ↑ Shropshire Council Notices of uncontested election – Unitary elections
- ↑ "Uncontested election article". Shropshire Star. 18 April 2013. Retrieved 14 January 2015.
- ↑ "Results – full text list". Shropshire Council. Retrieved 29 June 2013.
External links
- Shropshire Council 2013 Unitary and Town & Parish elections
- BBC News Shropshire council results
| Shropshire Council | |
|---|---|
| Telford and Wrekin Council | |
| Bridgnorth District Council |
|
| North Shropshire District Council |
|
| Oswestry Borough Council |
|
| Shrewsbury & Atcham Borough Council |
|
| South Shropshire District Council |
|
| |