Hertfordshire County Council election, 2013
| | |||||||||||||||||||||||||||||||
| |||||||||||||||||||||||||||||||
| |||||||||||||||||||||||||||||||
|
| |||||||||||||||||||||||||||||||
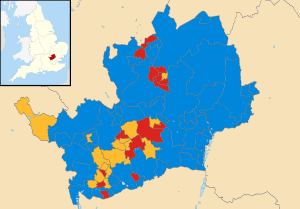
| Map showing the results of the 2013 Hertfordshire County Council elections. | |||||||||||||||||||||||||||||||
| |||||||||||||||||||||||||||||||
An election to Hertfordshire County Council took place on 2 May 2013 as part of the United Kingdom local elections, 2013. 77 electoral divisions elected one county councillor each by first-past-the-post voting for a four-year term of office. The electoral divisions were the same as those used at the previous election in 2009.
All locally registered electors (British, Irish, Commonwealth and European Union citizens) who were aged 18 or over on Thursday 2 May 2013 were entitled to vote in the local elections. Those who were temporarily away from their ordinary address (for example, away working, on holiday, in student accommodation or in hospital) were also entitled to vote in the local elections,[1] although those who had moved abroad and registered as overseas electors cannot vote in the local elections. It is possible to register to vote at more than one address (such as a university student who had a term-time address and lives at home during holidays) at the discretion of the local Electoral Register Office, but it remains an offence to vote more than once in the same local government election.[2]
Summary
The Conservative Party retained overall control of the council with a reduced majority of 15 seats, having lost a net total of 9 seats. The Liberal Democrats remained the council's official opposition with 16 seats, while the Labour Party won a larger proportion of votes to win 15 seats, a net gain of 12. UKIP were unsuccessful in their challenge for seats, despite making breakthroughs in surrounding counties.[3] The Green Party and British National Party both lost their solitary councillors, finishing second and fourth in those two divisions respectively.
All seats in the east of the county returned Conservative councillors, whereas in Stevenage and Watford no Conservative candidates succeeded in winning a seat. Labour's main area of success was Stevenage where its candidates (some ex-councillors) regained a dominant position at the expense of the Conservatives, but their lack of success in Hemel Hempstead will have been a disappointment in a former stronghold. Labour picked up two gains in mid-density divisions in Watford and Letchworth. Liberal Democrat support held up well in Tring, but saw a greater collapse in those broad areas without any local incumbency such as East Hertfordshire (10 divisions). However their net loss of one councillor was smaller than in most other parts of England.
Candidates
Labour and Conservative parties contested every electoral division and finished bottom of individual polls in a small minority of divisions, 11 and one respectively. UKIP had no candidate in six divisions and the Liberal Democrats fielded no candidate in three. After the four main parties, the Green Party fielded the next highest number of candidates at 37, just over half of the Council divisions.
Election results
| Hertfordshire County Council Election Results 2013 | ||||||||||
|---|---|---|---|---|---|---|---|---|---|---|
| Party | Seats | Gains | Losses | Net gain/loss | Seats % | Votes % | Votes | +/− | ||
| Conservative | 46 | 0 | -9 | -9 | 60 | 37.8 | 92607 | -8.2 | ||
| Liberal Democrat | 16 | 1 | 2 | -1 | 21 | 17.0 | 41743 | -10.1 | ||
| Labour | 15 | 12 | 0 | 12 | 19 | 21.3 | 52257 | +7.4 | ||
| Green | 0 | 0 | 1 | -1 | 0 | 4.2 | 10209 | -2.9 | ||
| BNP | 0 | 0 | 1 | -1 | 0 | |||||
| UKIP | 0 | 0 | 0 | 0 | 0 | |||||
| Independent | 0 | 0 | 0 | 0 | 0 | |||||
| English Democrat | 0 | 0 | 0 | 0 | 0 | |||||
Results by district
The above results can be broken down by district, although it should be noted that these are not current compositions of the district councils whose elections are held in other years.
| Within Broxbourne District | ||||||||||
|---|---|---|---|---|---|---|---|---|---|---|
| Party | Seats | Gains | Losses | Net gain/loss | Seats % | Votes % | Votes | +/− | ||
| Conservative | 6 | 0 | 0 | 0 | 100.0 | 53.8 | 12,531 | -2.8% | ||
| BNP | 0 | 0 | 0 | 0 | 0 | 17.1 | 3,986 | +13.5% | ||
| Labour | 0 | 0 | 0 | 0 | 0 | 14.8 | 3,454 | -10.6% | ||
| Liberal Democrat | 0 | 0 | 0 | 0 | 0 | 14.2 | 3,305 | +1.3% | ||
| Within Dacorum District | ||||||||||
|---|---|---|---|---|---|---|---|---|---|---|
| Party | Seats | Gains | Losses | Net gain/loss | Seats % | Votes % | Votes | +/− | ||
| Conservative | 8 | 0 | 0 | 0 | 80.0 | 39.8 | 12459 | -8.1 | ||
| Liberal Democrat | 2 | 0 | 0 | 0 | 20.0 | 15.2 | 4762 | -9.8 | ||
| Labour | 0 | 0 | 0 | 0 | 0 | 17.3 | 5427 | 5.0 | ||
| Green | 0 | 0 | 0 | 0 | 0 | 4.6 | 1429 | -4.5 | ||
| BNP | 0 | 0 | 0 | 0 | 0 | |||||
| Independent | 0 | 0 | 0 | 0 | 0 | |||||
| Within East Herts District | ||||||||||
|---|---|---|---|---|---|---|---|---|---|---|
| Party | Seats | Gains | Losses | Net gain/loss | Seats % | Votes % | Votes | +/− | ||
| Conservative | 10 | 0 | 0 | 0 | 100 | 45.7 | 14167 | -10.4 | ||
| Labour | 0 | 0 | 0 | 0 | 0 | 16.0 | 4961 | 6.1 | ||
| Liberal Democrat | 0 | 0 | 0 | 0 | 0.0 | 9.5 | 2934 | -18.5 | ||
| Independent | 0 | 0 | 0 | 0 | 0.0 | |||||
| BNP | 0 | 0 | 0 | 0 | 0.0 | |||||
| Green | 0 | 0 | 0 | 0 | 0.0 | 0.6 | 171 | -0.4 | ||
| Within Hertsmere District | ||||||||||
|---|---|---|---|---|---|---|---|---|---|---|
| Party | Seats | Gains | Losses | Net gain/loss | Seats % | Votes % | Votes | +/− | ||
| Conservative | 6 | 0 | 1 | -1 | ||||||
| Labour | 1 | 1 | 0 | +1 | 0.0 | |||||
| Liberal Democrat | 0 | 0 | 0 | 0 | 0.0 | |||||
| Green | 0 | 0 | 0 | 0 | 0.0 | |||||
| BNP | 0 | 0 | 0 | 0 | 0.0 | |||||
| Independent | 0 | 0 | 0 | 0 | 0.0 | |||||
| Within North Herts District | ||||||||||
|---|---|---|---|---|---|---|---|---|---|---|
| Party | Seats | Gains | Losses | Net gain/loss | Seats % | Votes % | Votes | +/− | ||
| Conservative | 7 | 0 | 2 | -2 | ||||||
| Labour | 2 | 2 | 0 | +2 | ||||||
| Liberal Democrat | 0 | 0 | 0 | 0 | 0.0 | |||||
| Green | 0 | 0 | 0 | 0 | 0.0 | |||||
| BNP | 0 | 0 | 0 | 0 | 0.0 | |||||
| English Democrat | 0 | 0 | 0 | 0 | 0.0 | 0 | ||||
| Within St Albans District | ||||||||||
|---|---|---|---|---|---|---|---|---|---|---|
| Party | Seats | Gains | Losses | Net gain/loss | Seats % | Votes % | Votes | +/− | ||
| Liberal Democrat | 5 | 0 | 2 | -2 | ||||||
| Conservative | 3 | 0 | 0 | 0 | ||||||
| Labour | 2 | 2 | 0 | +2 | 0.0 | |||||
| Green | 0 | 0 | 0 | 0 | 0.0 | |||||
| BNP | 0 | 0 | 0 | 0 | 0.0 | 0 | ||||
| Within Stevenage District | ||||||||||
|---|---|---|---|---|---|---|---|---|---|---|
| Party | Seats | Gains | Losses | Net gain/loss | Seats % | Votes % | Votes | +/− | ||
| Labour | 5 | 3 | 0 | +3 | ||||||
| Liberal Democrat | 1 | 0 | 0 | 0 | ||||||
| Conservative | 0 | 0 | 3 | -3 | ||||||
| UKIP | 0 | 0 | 0 | 0 | 0.0 | |||||
| BNP | 0 | 0 | 0 | 0 | 0.0 | |||||
| Green | 0 | 0 | 0 | 0 | 0.0 | |||||
| English Democrat | 0 | 0 | 0 | 0 | 0.0 | |||||
| Within Three Rivers District | ||||||||||
|---|---|---|---|---|---|---|---|---|---|---|
| Party | Seats | Gains | Losses | Net gain/loss | Seats % | Votes % | Votes | +/− | ||
| Conservative | 3 | 0 | 0 | 0 | ||||||
| Liberal Democrat | 2 | 0 | 0 | 0 | ||||||
| Labour | 1 | 1 | 0 | +1 | ||||||
| BNP | 0 | 0 | 1 | -1 | ||||||
| Within Watford District | ||||||||||
|---|---|---|---|---|---|---|---|---|---|---|
| Party | Seats | Gains | Losses | Net gain/loss | Seats % | Votes % | Votes | +/− | ||
| Liberal Democrat | 4 | 0 | 0 | 0 | ||||||
| Labour | 2 | 1 | 0 | +1 | ||||||
| Conservative | 0 | 0 | 0 | 0 | 0.0 | |||||
| Green | 0 | 0 | 1 | -1 | ||||||
| BNP | 0 | 0 | 0 | 0 | 0.0 | |||||
| Within Welwyn Hatfield District | ||||||||||
|---|---|---|---|---|---|---|---|---|---|---|
| Party | Seats | Gains | Losses | Net gain/loss | Seats % | Votes % | Votes | +/− | ||
| Conservative | 3 | 0 | 3 | -3 | ||||||
| Liberal Democrat | 2 | 1 | 0 | +1 | ||||||
| Labour | 2 | 2 | 0 | +2 | ||||||
| Green | 0 | 0 | 0 | 0 | 0.0 | |||||
| BNP | 0 | 0 | 0 | 0 | 0.0 | |||||
| Independent | 0 | 0 | 0 | 0 | 0.0 | 0 | ||||
Results by electoral division
Broxbourne (6 Seats)
| Party | Candidate | Votes | % | ± | |
|---|---|---|---|---|---|
| Conservative | Dave Hewitt | 1283 | 49.9 | -4.2 | |
| UKIP | Colleen Blyth | 662 | 25.8 | +6.4** | |
| Labour | Michael Alan Watson | 441 | 17.2 | +3.8 | |
| Liberal Democrat | Nick Sutton | 177 | 6.9 | -5.4 | |
| Majority | 621 | ||||
| Turnout | |||||
| Conservative hold | Swing | ||||
| Party | Candidate | Votes | % | ± | |
|---|---|---|---|---|---|
| Conservative | Paul Vincent | 1335 | 49.0 | -4.6 | |
| UKIP | Tony Faulkner | 859 | 31.6 | +10.3** | |
| Labour | Alex Harvey | 446 | 16.4 | +4.5 | |
| Liberal Democrat | Rory James Anthony Gleeson | 75 | 2.8 | -9.8 | |
| Majority | 476 | ||||
| Turnout | 19.7 | ||||
| Conservative hold | Swing | ||||
| Party | Candidate | Votes | % | ± | |
|---|---|---|---|---|---|
| Conservative | Robert Gordon | 1462 | 57.2 | -2.4 | |
| UKIP | Jack Salmon | 648 | 25.4 | +11.7** | |
| Labour | McInnes, Alexander David | 391 | 15.3 | +3.6 | |
| BNP | Ian John Seeby | 52 | 2.0 | +11.7** | |
| Majority | 814 | ||||
| Turnout | 22.7 | ||||
| Conservative hold | Swing | ||||
| Party | Candidate | Votes | % | ± | |
|---|---|---|---|---|---|
| Conservative | Tim Hutchings | 1141 | 41.5 | -12.3 | |
| Labour | Edward Herbert Hopwood | 435 | 15.8 | -0.1 | |
| UKIP | David Steven Platt | 1054 | 38.3 | **+22.9 | |
| Liberal Democrat | Nigel Francis Chevalley De Rivaz | 111 | 4.0 | -9.9 | |
| Majority | 87 | ||||
| Turnout | 25.2 | ||||
| Conservative hold | Swing | ||||
| Party | Candidate | Votes | % | ± | |
|---|---|---|---|---|---|
| Conservative | Alan Searing | 1553 | 48.4 | -7.9 | |
| Liberal Democrat | Kirstie Jane Mounsteven De Rivaz | 201 | 6.3 | -13.0 | |
| UKIP | Evelyn Faulkner | 988 | 30.8 | **+17.7 | |
| Labour | Malcolm David Aitken | 450 | 14.0 | +3.7 | |
| Majority | 565 | ||||
| Turnout | 24.5 | ||||
| Conservative hold | Swing | ||||
| Party | Candidate | Votes | % | ± | |
|---|---|---|---|---|---|
| Conservative | Dee Hart | 1215 | 46.9 | +5.3 | |
| Labour | Neil Harvey | 782 | 30.2 | +3.3 | |
| UKIP | Salvatore Scozzaro | 584 | 22.6 | **+5.3 | |
| Majority | 433 | ||||
| Turnout | 23.7 | ||||
| Conservative hold | Swing | ||||
Dacorum (10 Seats)
| Party | Candidate | Votes | % | ± | |
|---|---|---|---|---|---|
| Conservative | Ian Reay | 1805 | 45.1 | +1.9 | |
| UKIP | Norman Cutting | 696 | 17.4 | **+7.4 | |
| Liberal Democrat | Hugo Hardy | 610 | 15.2 | -18.2 | |
| Green | Paul Gregory De Hoest | 448 | 11.2 | +3.0 | |
| Labour | Peter Scott | 433 | 10.8 | +6.0 | |
| Majority | 1109 | ||||
| Turnout | |||||
| Conservative hold | Swing | ||||
| Party | Candidate | Votes | % | ± | |
|---|---|---|---|---|---|
| Conservative | David Lloyd | 1487 | 54.9 | -6.0 | |
| UKIP | Mark Anderson | 600 | 22.1 | +14.7** | |
| Labour | Julia Coleman | 301 | 11.1 | +2.8 | |
| Liberal Democrat | Robert James Irving | 211 | 7.8 | -7.2 | |
| Green | Sherief Hassan | 104 | 3.8 | -4.3 | |
| Majority | 887 | ||||
| Turnout | 31.4 | ||||
| Conservative hold | Swing | ||||
| Party | Candidate | Votes | % | ± | |
|---|---|---|---|---|---|
| Conservative | Andrew Williams | 1222 | 44.1 | -12.7 | |
| UKIP | Noel Swinford | 802 | 28.9 | N/A | |
| Labour | Mandy Tattershall | 576 | 20.8 | +5.4 | |
| Liberal Democrat | Angela Tindall | 162 | 5.8 | -11.0 | |
| Majority | 420 | ||||
| Turnout | 27.6 | ||||
| Conservative hold | Swing | ||||
| Party | Candidate | Votes | % | ± | |
|---|---|---|---|---|---|
| Conservative | Colette Wyatt-Lowe | 1026 | 43.2 | -10.4 | |
| UKIP | John Clark Bruce | 604 | 25.4 | +15.5** | |
| Labour | Anne Isobel Fisher | 581 | 24.5 | +6.3 | |
| Green | Paul Sandford | 90 | 3.8 | -2.3 | |
| Liberal Democrat | Denise Rance | 70 | 2.9 | -8.9 | |
| Majority | 422 | ||||
| Turnout | 24.0 | ||||
| Conservative hold | Swing | ||||
| Party | Candidate | Votes | % | ± | |
|---|---|---|---|---|---|
| Conservative | Terence Douris | 1278 | 38.8 | -4.0 | |
| Labour | Mike Bromberg | 867 | 26.3 | +4.5 | |
| UKIP | Mike Potts | 852 | 25.9 | +15.8** | |
| Green | Jane Cousins | 158 | 4.8 | -5.1 | |
| Liberal Democrat | David Bird | 129 | 3.9 | -11.0 | |
| Majority | 411 | ||||
| Turnout | 28.3 | ||||
| Conservative hold | Swing | ||||
| Party | Candidate | Votes | % | ± | |
|---|---|---|---|---|---|
| Liberal Democrat | Ron Tindall | 816 | 33.2 | -1.6 | |
| Conservative | Dan Wood | 579 | 23.5 | -10.1 | |
| Labour | Anglea Terry | 510 | 20.7 | +3.4 | |
| UKIP | Martyn Adams | 499 | 20.3 | +12.1** | |
| Green | Paul Harris | 54 | 2.2 | -3.4 | |
| Majority | 237 | ||||
| Turnout | 26.2 | ||||
| Liberal Democrat hold | Swing | ||||
| Party | Candidate | Votes | % | ± | |
|---|---|---|---|---|---|
| Conservative | Anthony McKay | 993 | 35.1 | -12.7 | |
| UKIP | Gillian Elaine Adams, | 803 | 28.4 | N/A | |
| Labour | Bernard Gronert | 784 | 27.7 | +5.7 | |
| Liberal Democrat | Janet Ventiroso | 123 | 4.3 | -12.4 | |
| Green | Suzanne Caron Watts | 117 | 4.1 | -8.7 | |
| Majority | 190 | ||||
| Turnout | 24.9 | ||||
| Conservative hold | Swing | ||||
| Party | Candidate | Votes | % | ± | |
|---|---|---|---|---|---|
| Conservative | William James Wyatt-Lowe | 1441 | 42.4 | -8.1 | |
| Labour | Stefan Fisher | 702 | 20.6 | +6.0 | |
| UKIP | Howard Keith Koch | 648 | 19.0 | N/A | |
| Liberal Democrat | Chris Angell | 291 | 8.6 | -12.4 | |
| Green | Ben Collier | 281 | 8.3 | -4.9 | |
| Trade Unionists and Socialists Against Cuts | Fouz, Firasul | 27 | 0.8 | N/A | |
| Majority | 739 | ||||
| Turnout | 26.6 | ||||
| Conservative hold | Swing | ||||
| Party | Candidate | Votes | % | ± | |
|---|---|---|---|---|---|
| Conservative | Richard Roberts | 1558 | 51.8 | -6.6 | |
| UKIP | Chris Wright | 785 | 26.1 | +19.9** | |
| Labour | Jean Langdon | 325 | 10.8 | +2.6 | |
| Green | Wiebke Carr | 177 | 5.9 | -4.1 | |
| Liberal Democrat | Garrick Stevens | 157 | 5.2 | -11.6 | |
| Majority | 773 | ||||
| Turnout | 28.5 | ||||
| Conservative hold | Swing | ||||
| Party | Candidate | Votes | % | ± | |
|---|---|---|---|---|---|
| Liberal Democrat | Nicholas Hollinghurst | 2193 | 49.3 | -3.1 | |
| Conservative | Fiona Guest | 1070 | 24.1 | -13.3 | |
| UKIP | Michael Frederick Siveyer | 816 | 18.3 | N/A | |
| Labour | Colin Barry Phillips | 348 | 7.8 | +4.9 | |
| Majority | 1123 | ||||
| Turnout | 36.1 | ||||
| Liberal Democrat hold | Swing | ||||
East Herts (10 Seats)
| Party | Candidate | Votes | % | ± | |
|---|---|---|---|---|---|
| Conservative | Andrew Stevenson | 914 | 30.9 | -21.6 | |
| Independent | Sally Newton | 818 | 27.7 | ||
| Labour Co-op | Campbell, Myra Rae | 650 | 22.0 | +6.6 | |
| UKIP | Sheila Margaret Pettman | 456 | 15.4 | ||
| Liberal Democrat | Andrew Porrer | 114 | 3.9 | -27.1 | |
| Majority | 96 | ||||
| Turnout | 29.7 | ||||
| Conservative hold | Swing | ||||
| Party | Candidate | Votes | % | ± | |
|---|---|---|---|---|---|
| Conservative | John Barfoot | 1312 | 38.1 | -8.7 | |
| UKIP | Dickinson, Nicholas | 817 | 23.7 | ||
| Liberal Democrat | Mione Goldspink | 790 | 23.0 | -21.0 | |
| Labour | Val Cooke | 513 | 14.9 | +6.7 | |
| Majority | 495 | ||||
| Turnout | 32.6 | ||||
| Conservative hold | Swing | ||||
| Party | Candidate | Votes | % | ± | |
|---|---|---|---|---|---|
| Conservative | Graham McAndrew | 1452 | 43.7 | -15.2 | |
| UKIP | William Matthew Compton | 1166 | 35.1 | ||
| Labour | Darren Keith Neesam | 429 | 12.9 | +4.3 | |
| Liberal Democrat | Laurie Calvin | 270 | 8.1 | -23.0 | |
| Majority | 286 | ||||
| Turnout | 31.6 | ||||
| Conservative hold | Swing | ||||
| Party | Candidate | Votes | % | ± | |
|---|---|---|---|---|---|
| Conservative | Colin Bernard Woodward | 1313 | 42.1 | -3.0 | |
| UKIP | Adrian Howard Baker | 949 | 30.4 | +22.4** | |
| Labour | Alex Young | 516 | 16.5 | +6.3 | |
| Liberal Democrat | Bob Taylor | 329 | 10.5 | -15.5 | |
| Majority | 364 | ||||
| Turnout | 27.1 | ||||
| Conservative hold | Swing | ||||
| Party | Candidate | Votes | % | ± | |
|---|---|---|---|---|---|
| Conservative | Rose Cheswright | 1381 | 44.4 | -18.3 | |
| UKIP | Kara Platt | 679 | 21.8 | ||
| Labour | Steven Charles Stone | 402 | 12.9 | +3.0 | |
| Independent | Debbie Lemay | 343 | 11.0 | ||
| Green | Woollcombe, David Rupert | 171 | 5.5 | ||
| Liberal Democrat | Michael Wood | 117 | 3.8 | -22.0 | |
| Majority | 702 | ||||
| Turnout | 30.6 | ||||
| Conservative hold | Swing | ||||
| Party | Candidate | Votes | % | ± | |
|---|---|---|---|---|---|
| Conservative | Ken Crofton | 2176 | 61.3 | -5.2 | |
| Independent | Gary Francis O'Leary, | 683 | 19.3 | ||
| Labour Co-op | Jim Brown | 440 | 12.4 | +3.9 | |
| Liberal Democrat | Catherine Gerran Edwards | 224 | 6.3 | -17.1 | |
| Majority | 1493 | ||||
| Turnout | 37.5 | ||||
| Conservative hold | Swing | ||||
| Party | Candidate | Votes | % | ± | |
|---|---|---|---|---|---|
| Conservative | Peter Ruffles | 1625 | 54.9 | -1.1 | |
| Labour | Graham Peter Nickson, | 741 | 25.0 | +12.6 | |
| UKIP | Michael Habermel, | 434 | 14.7 | -6.0** | |
| Liberal Democrat | Shaw, Sean | 145 | 4.9 | -5.4 | |
| Majority | 884 | ||||
| Turnout | 28.2 | ||||
| Conservative hold | Swing | ||||
| Party | Candidate | Votes | % | ± | |
|---|---|---|---|---|---|
| Conservative | Roger Beeching | 1568 | 52.2 | -14.5 | |
| UKIP | Jack Barnard | 825 | 27.5 | ||
| Labour | Sotirios Adamopoulos | 399 | 13.3 | +4.1 | |
| Liberal Democrat | Julia Mary Davies | 194 | 6.5 | -16.1 | |
| Majority | 743 | ||||
| Turnout | 27.6 | ||||
| Conservative hold | Swing | ||||
| Party | Candidate | Votes | % | ± | |
|---|---|---|---|---|---|
| Conservative | David Andrews | 1186 | 41.8 | -6.2 | |
| UKIP | Matthew Kent | 689 | 24.3 | +16.0** | |
| Liberal Democrat | John Francis William Wing | 472 | 16.7 | -15.4 | |
| Labour Co-op | David John Bell | 419 | 14.8 | +5.9 | |
| Trade Unionists and Socialists Against Cuts | Wright, Mark Andrew | 59 | 2.1 | +16.0** | |
| Majority | 497 | ||||
| Turnout | 27.4 | ||||
| Conservative hold | Swing | ||||
| Party | Candidate | Votes | % | ± | |
|---|---|---|---|---|---|
| Conservative | Jeanette Joyce Taylor | 1240 | 46.4 | -10.0 | |
| UKIP | Andrew Nicolas | 687 | 25.7 | ||
| Labour | Billy Morgan | 452 | 16.9 | +8.6 | |
| Liberal Democrat | Tony Gubb | 279 | 10.4 | -23.2 | |
| Majority | 553 | ||||
| Turnout | 25.3 | ||||
| Conservative hold | Swing | ||||
Hertsmere (7 Seats)
| Party | Candidate | Votes | % | ± | |
|---|---|---|---|---|---|
| Labour | Leon Reefe | 1183 | 44.1 | +15.5 | |
| Conservative | Clive Stephen Butchins, | 735 | 27.4 | -11.3 | |
| UKIP | David John Appleby | 678 | 25.3 | +5.7** | |
| Liberal Democrat | Derek Buchanan | 79 | 2.9 | -9.3 | |
| Majority | 448 | ||||
| Turnout | 22.1 | ||||
| Labour gain from Conservative | Swing | ||||
| Party | Candidate | Votes | % | ± | |
|---|---|---|---|---|---|
| Conservative | Alan Plancey | 1050 | 39.4 | -12.6 | |
| Labour | Ann Harrison | 889 | 33.3 | +6.4 | |
| UKIP | Nicolas, Albert | 631 | 23.7 | ||
| Liberal Democrat | Lloyd Harris | 86 | 3.2 | -15.9 | |
| Majority | 161 | ||||
| Turnout | 23.2 | ||||
| Conservative hold | Swing | ||||
| Party | Candidate | Votes | % | ± | |
|---|---|---|---|---|---|
| Conservative | Steve O'Brien | 995 | 43.4 | -2.4 | |
| UKIP | Laura Katherine Daley | 524 | 22.9 | ||
| Labour | Jim Sowerbutts | 437 | 19.1 | +12.0 | |
| Liberal Democrat | Shailain Shah | 321 | 14.0 | -24.1 | |
| Majority | 471 | ||||
| Turnout | 23.3 | ||||
| Conservative hold | Swing | ||||
| Party | Candidate | Votes | % | ± | |
|---|---|---|---|---|---|
| Conservative | Seamus Quilty | 1602 | 61.2 | -3.9 | |
| UKIP | Sushil Kantibhai Patel | 400 | 15.3 | ||
| Labour | David Bearfield | 376 | 14.4 | +6.6 | |
| Liberal Democrat | Robert Graham Gamble | 229 | 8.7 | -10.1 | |
| Majority | 1202 | ||||
| Turnout | 25.7 | ||||
| Conservative hold | Swing | ||||
| Party | Candidate | Votes | % | ± | |
|---|---|---|---|---|---|
| Conservative | Peter Frederick John Knell | 1471 | 48.4 | -16.6 | |
| UKIP | Simon Edward Rhodes | 775 | 25.5 | ||
| Labour | John Doolan | 463 | 15.2 | +4.1 | |
| Liberal Democrat | Peter Bonner | 192 | 6.3 | -16.1 | |
| Green | B Samuel | 127 | 4.2 | ||
| Majority | 696 | ||||
| Turnout | 25.8 | ||||
| Conservative hold | Swing | ||||
| Party | Candidate | Votes | % | ± | |
|---|---|---|---|---|---|
| Conservative | Morris Bright | 1134 | 50.8 | -12.6 | |
| UKIP | David Rutter | 549 | 24.6 | ||
| Labour | Ray Edge | 379 | 17.0 | +4.5 | |
| Liberal Democrat | Susan Oatway | 160 | 7.2 | -14.9 | |
| Majority | 585 | ||||
| Turnout | 24.6 | ||||
| Conservative hold | Swing | ||||
| Party | Candidate | Votes | % | ± | |
|---|---|---|---|---|---|
| Conservative | Caroline Clapper | 1874 | 63.7 | -7.5 | |
| UKIP | Will Ferry | 486 | 16.5 | ||
| Labour | Richard Raymond Butler | 392 | 13.3 | +5.8 | |
| Liberal Democrat | Holly Gunning | 176 | 6.0 | -5.3 | |
| Majority | 1388 | ||||
| Turnout | 25.8 | ||||
| Conservative hold | Swing | ||||
North Herts (9 Seats)
| Party | Candidate | Votes | % | ± | |
|---|---|---|---|---|---|
| Labour Co-op | DAVID BILLING | 1503 | 45.5 | +13.4 | |
| Conservative | Alan Millard | 1070 | 32.4 | +0.2 | |
| Green | Gavin Nicholson | 479 | 14.5 | -2.8 | |
| Liberal Democrat | Andrew Ircha | 217 | 6.6 | -7.5 | |
| Majority | 433 | ||||
| Turnout | 3,300 | 28.35 | |||
| Labour Co-op gain from Conservative | Swing | ||||
| Party | Candidate | Votes | % | ± | |
|---|---|---|---|---|---|
| Conservative | David Barnard | 1,395 | 54.7 | -0.7 | |
| Labour | Sadie Billing | 699 | 27.4 | +12.2 | |
| Green | Sylvia Hutchinson | 264 | 10.3 | -4.0 | |
| Liberal Democrat | Michael Lott | 176 | 6.9 | -7.5 | |
| Majority | 696 | ||||
| Turnout | 28.81 | ||||
| Conservative hold | Swing | ||||
| Party | Candidate | Votes | % | ± | |
|---|---|---|---|---|---|
| Conservative | DERRICK ASHLEY | 1577 | 42.1 | -7.2 | |
| UKIP | Adrianne Smyth | 731 | 19.5 | ||
| Liberal Democrat | Paul Clark | 671 | 17.9 | -12.3 | |
| Labour Co-op | Nafisa Sayany | 510 | 13.6 | +6.0 | |
| Green | Kate Hendry | 250 | 6.7 | -5.5 | |
| Majority | 846 | ||||
| Turnout | 36.52 | ||||
| Conservative hold | Swing | ||||
| Party | Candidate | Votes | % | ± | |
|---|---|---|---|---|---|
| Conservative | Richard Thake | 1775 | 52.4 | -9.6 | |
| UKIP | Nick Brooke | 726 | 21.4 | ||
| Labour | John Kolm-Murray | 471 | 13.9 | +4.4 | |
| Liberal Democrat | Rob Lambie | 227 | 6.7 | -7.0 | |
| Green | Rebecca Leek | 180 | 5.3 | -8.9 | |
| Majority | 1049 | ||||
| Turnout | 30.9 | ||||
| Conservative hold | Swing | ||||
| Party | Candidate | Votes | % | ± | |
|---|---|---|---|---|---|
| Conservative | Michael Muir | 1593 | 51.6 | +3.0 | |
| Labour Co-op | Rachel Danae Burgin | 909 | 29.4 | +12.4 | |
| Green | Arwen Tapping | 366 | 11.8 | -2.6 | |
| Liberal Democrat | Richard William Winter | 204 | 6.6 | -12.7 | |
| Majority | 684 | ||||
| Turnout | 26.13 | ||||
| Conservative hold | Swing | ||||
| Party | Candidate | Votes | % | ± | |
|---|---|---|---|---|---|
| Labour Co-op | LORNA KERCHER | 1038 | 38.9 | +14.3 | |
| Conservative | Andy Frankland | 990 | 37.1 | +2.5 | |
| English Democrat | Charles Vickers | 299 | 11.2 | -4.1** | |
| Green | Rosemary Bland | 201 | 7.5 | -3.1 | |
| Liberal Democrat | Martin Penny | 124 | 4.6 | -9.6 | |
| Majority | 48 | ||||
| Turnout | 28.5 | ||||
| Labour gain from Conservative | Swing | ||||
| Party | Candidate | Votes | % | ± | |
|---|---|---|---|---|---|
| Conservative | TERRY HONE | 1502 | 44.8 | -6.6 | |
| Labour Co-op | David Peter Kearns | 663 | 19.8 | +6.5 | |
| UKIP | John Barry | 636 | 19.0 | ||
| Liberal Democrat | John Winder | 283 | 8.5 | -12.6 | |
| Green | Mario May | 251 | 7.5 | -5.7 | |
| Majority | 839 | ||||
| Turnout | 30.9 | ||||
| Conservative hold | Swing | ||||
| Party | Candidate | Votes | % | ± | |
|---|---|---|---|---|---|
| Conservative | Tony Hunter | 1506 | 35.5 | -8.8 | |
| Liberal Democrat | Ian Simpson | 1437 | 33.9 | -8.9 | |
| UKIP | Peter Robbins | 796 | 18.8 | ||
| Labour Co-op | Ken Garland | 350 | 8.3 | +3.4 | |
| Green | Felix Power | 135 | 3.2 | -4.2 | |
| Majority | 69 | ||||
| Turnout | 35.46 | ||||
| Conservative hold | Swing | ||||
| Party | Candidate | Votes | % | ± | |
|---|---|---|---|---|---|
| Conservative | Fiona Ronan Greenwood Hill | 1508 | 39.2 | -13.0 | |
| UKIP | Mark James Hughes | 1210 | 31.4 | ||
| Labour Co-op | Les Baker | 732 | 19.0 | +9.8 | |
| Green | Karen Julie Harmel | 232 | 6.0 | -6.2 | |
| Liberal Democrat | John Winder | 157 | 4.1 | -21.6 | |
| Majority | 298 | ||||
| Turnout | 31.3 | ||||
| Conservative hold | Swing | ||||
St Albans (10 Seats)
| Party | Candidate | Votes | % | ± | |
|---|---|---|---|---|---|
| Conservative | David Williams | 1,672 | 53.8 | -0.7 | |
| Liberal Democrat | Jeffrey Kyndon Phillips | 547 | 17.6 | -9.4 | |
| Labour Co-op | Rosemary Elsbeth Ross | 468 | 15.1 | +8.2 | |
| Green | Pamela Bancroft | 398 | 12.8 | +1.9 | |
| Majority | 1125 | ||||
| Turnout | 28.7 | ||||
| Conservative hold | Swing | ||||
| Party | Candidate | Votes | % | ± | |
|---|---|---|---|---|---|
| Conservative | Teresa Catherine Heritage | 2,569 | 70.4 | +4.8 | |
| Liberal Democrat | Maria Louise Moyses | 382 | 10.5 | -8.1 | |
| Green | Rosalind Paul | 238 | 6.5 | -3.0 | |
| Labour | Michael Gray-Higgins | 436 | 11.9 | +6.1 | |
| Majority | 2133 | ||||
| Turnout | 32.7 | ||||
| Conservative hold | Swing | ||||
| Party | Candidate | Votes | % | ± | |
|---|---|---|---|---|---|
| Liberal Democrat | Chris White | 1,369 | 36.9 | -8.7 | |
| Conservative | Alec Cambell | 796 | 21.5 | -3.1 | |
| Green | Jack Edward Easton | 837 | 22.6 | +5.0 | |
| Labour Co-op | Andrew Dixon | 689 | 18.6 | +6.8 | |
| Majority | 532 | ||||
| Turnout | 33.3 | ||||
| Liberal Democrat hold | Swing | ||||
| Party | Candidate | Votes | % | ± | |
|---|---|---|---|---|---|
| Liberal Democrat | Robert Graham Prowse | 1,229 | 32.5 | -12.6 | |
| Labour | Vivienne Windle | 1,030 | 27.2 | +15.0 | |
| UKIP | Michael Mason | 636 | 16.8 | ||
| Conservative | Guy Martin Young | 631 | 16.7 | -11.5 | |
| Green | Greg Riener | 239 | 6.3 | -7.4 | |
| Majority | 199 | ||||
| Turnout | 35.6 | ||||
| Liberal Democrat hold | Swing | ||||
| Party | Candidate | Votes | % | ± | |
|---|---|---|---|---|---|
| Labour | Roma Mills | 1,487 | 34.6 | +20.3 | |
| Liberal Democrat | Anthony Francis Rowlands | 1,061 | 24.7 | -13.9 | |
| Conservative | Salih Gaygusuz | 1,026 | 23.9 | -9.6 | |
| UKIP | Philip John Singleton | 489 | 11.4 | ||
| Green | Jill Mills | 223 | 5.2 | -7.5 | |
| Majority | 426 | ||||
| Turnout | 39.5 | ||||
| Labour gain from Liberal Democrat | Swing | ||||
| Party | Candidate | Votes | % | ± | |
|---|---|---|---|---|---|
| Conservative | Maxine Susan Crawley | 1,802 | 50.7 | +5.7 | |
| Liberal Democrat | Judy Shardlow | 742 | 20.9 | -20.8 | |
| UKIP | Sidney Pratt | 549 | 15.4 | ||
| Labour | Linda Spiri | 267 | 735 | +3.8 | |
| Green | Thomas Woodburne Bruce Hardy | 187 | 5.3 | -3.7 | |
| Majority | 1060 | ||||
| Turnout | 36.2 | ||||
| Conservative hold | Swing | ||||
| Party | Candidate | Votes | % | ± | |
|---|---|---|---|---|---|
| Liberal Democrat | Sandy Walkington | 1,486 | 35.7 | -3.4 | |
| Conservative | Brian Ellis | 949 | 22.8 | -8.3 | |
| Labour | Janet Smith | 918 | 22.1 | +6.8 | |
| UKIP | Dawn Bloor | 549 | 13.2 | ||
| Green | Kate Metcalf | 246 | 5.9 | -7.7 | |
| Majority | 537 | ||||
| Turnout | 39.5 | ||||
| Liberal Democrat hold | Swing | ||||
| Party | Candidate | Votes | % | ± | |
|---|---|---|---|---|---|
| Liberal Democrat | Aislinn Lee | 1,495 | 36.7 | -7.1 | |
| Conservative | Sue Featherstone | 1,201 | 29.5 | -13.4 | |
| UKIP | Peter James Whitehead | 951 | 23.4 | ||
| Labour | Josh Molloy | 305 | 7.5 | +1.9 | |
| Green | Lesley Charlotte Baker | 112 | 2.8 | -4.3 | |
| Majority | 294 | ||||
| Turnout | 36.6 | ||||
| Liberal Democrat hold | Swing | ||||
| Party | Candidate | Votes | % | ± | |
|---|---|---|---|---|---|
| Liberal Democrat | Geoff Churchard | 1,203 | 34.9 | -12.7 | |
| Conservative | Beric Read | 1,099 | 31.9 | -5.5 | |
| UKIP | John Francis Stocker | 640 | 18.6 | ||
| Labour | John Paton | 337 | 9.8 | +5.0 | |
| Green | Ian Troughton | 164 | 4.8 | -4.6 | |
| Majority | 104 | ||||
| Turnout | 39.0 | ||||
| Liberal Democrat hold | Swing | ||||
| Party | Candidate | Votes | % | ± | |
|---|---|---|---|---|---|
| Labour | Dreda Gordon | 1,235 | 32.1 | +19.5 | |
| Liberal Democrat | Chris Brazier | 1,026 | 26.6 | -15.1 | |
| Conservative | Dave Winstone | 866 | 22.5 | -9.1 | |
| UKIP | Christopher David Thorpe | 638 | 16.6 | +10.5** | |
| Green | Lydia El-Khouri | 88 | 2.3 | -5.3 | |
| Majority | 209 | ||||
| Turnout | 33.9 | ||||
| Labour gain from Liberal Democrat | Swing | ||||
Stevenage (6 Seats)
| Party | Candidate | Votes | % | ± | |
|---|---|---|---|---|---|
| Labour Co-op | Sharon Jane Taylor | 1,436 | 49.0 | +10.7 | |
| UKIP | Billy Hamilton | 696 | 23.8 | +3.0** | |
| Conservative | Michelle Mary Calcutt | 526 | 18.0 | -5.3 | |
| Liberal Democrat | Gareth Morgan Rhys Steiner | 114 | 3.9 | -6.5 | |
| Green | Ian Cropton | 100 | 3.4 | -2.1 | |
| Trade Unionists and Socialists Against Cuts | Steve Glennon | 46 | 1.6 | 3.0** | |
| Majority | 740 | ||||
| Turnout | 29.42 | ||||
| Labour Co-op hold | Swing | ||||
| Party | Candidate | Votes | % | ± | |
|---|---|---|---|---|---|
| Labour Co-op | Sherma Amantha Batson | 1,233 | 44.5 | +16.1 | |
| Conservative | Matthew Hurst | 977 | 35.2 | +3.3 | |
| Green | Graham Crawford White | 244 | 8.8 | +3.3 | |
| Liberal Democrat | Andy McGuinness | 177 | 6.4 | -6.2 | |
| Trade Unionists and Socialists Against Cuts | Helen Dorothy Kerr | 108 | 3.9 | -17.2** | |
| Majority | 256 | ||||
| Turnout | 29.22 | ||||
| Labour Co-op gain from Conservative | Swing | ||||
| Party | Candidate | Votes | % | ± | |
|---|---|---|---|---|---|
| Liberal Democrat | Robin Gareth Parker | 1,368 | 38.0 | +0.7 | |
| Labour Co-op | Ric Euteneuer | 893 | 24.8 | +4.6 | |
| UKIP | Sheila Frances Hamilton | 767 | 21.3 | +5.1** | |
| Conservative | Margaret Penelope Notley | 482 | 13.4 | -8.5 | |
| Green | James Alexander Drew | 67 | 1.9 | -1.8 | |
| Trade Unionists and Socialists Against Cuts | Mark Pickersgill | 15 | 0.4 | +5.1** | |
| Majority | 475 | ||||
| Turnout | 35.30 | ||||
| Liberal Democrat hold | Swing | ||||
| Party | Candidate | Votes | % | ± | |
|---|---|---|---|---|---|
| Labour Co-op | Amanda King | 1,559 | 37.4 | +5.8 | |
| Conservative | James Robert Phillip Fraser | 1,322 | 31.7 | -4.3 | |
| UKIP | Sean Howlett | 909 | 21.8 | +7.2** | |
| Liberal Democrat | Clive Hearmon | 171 | 4.1 | -6.1 | |
| Green | Elizabeth Genevieve Sturges | 159 | 3.8 | -2.5 | |
| Trade Unionists and Socialists Against Cuts | Trevor Michael Palmer | 39 | 0.9 | +7.2 | |
| Majority | 237 | ||||
| Turnout | 32.46 | ||||
| Labour Co-op gain from Conservative | Swing | ||||
| Party | Candidate | Votes | % | ± | |
|---|---|---|---|---|---|
| Labour Co-op | Richard Joseph Henry | 1,343 | 40.7 | +12.3 | |
| UKIP | Ken Neal | 822 | 24.9 | +1.6** | |
| Conservative | Philip Bibby | 781 | 23.7 | -6.2 | |
| Liberal Democrat | Graham Snell | 189 | 5.7 | -5.5 | |
| Green | Julia Winter | 110 | 3.3 | -2.0 | |
| Trade Unionists and Socialists Against Cuts | Mark Nathan Simon Gentleman | 49 | 1.5 | +1.6** | |
| Majority | 521 | ||||
| Turnout | 27.52 | ||||
| Labour Co-op gain from Conservative | Swing | ||||
| Party | Candidate | Votes | % | ± | |
|---|---|---|---|---|---|
| Labour Co-op | John Lloyd | 1,321 | 53.0 | +20.4 | |
| Conservative | Adam Mitchell | 717 | 28.7 | +3.8 | |
| Green | Harold Bland | 159 | 6.4 | +0.3 | |
| Liberal Democrat | Debby Betts | 156 | 6.3 | -5.8 | |
| Trade Unionists and Socialists Against Cuts | Amanda Gloria Dilley | 126 | 5.1 | -18.5** | |
| Majority | 604 | ||||
| Turnout | 25.85 | ||||
| Labour Co-op hold | Swing | ||||
Three Rivers (6 Seats)
| Party | Candidate | Votes | % | ± | |
|---|---|---|---|---|---|
| Liberal Democrat | Sara Bedford | 1851 | 50.4 | -8.5 | |
| UKIP | David Bernard Bennett | 744 | 20.3 | +13.3** | |
| Conservative | Rachel Laura Andrews | 601 | 16.4 | -8.0 | |
| Labour | Colin James Gray | 461 | 12.6 | +3.7 | |
| Majority | 1107 | ||||
| Turnout | 26.4 | ||||
| Liberal Democrat hold | Swing | ||||
| Party | Candidate | Votes | % | ± | |
|---|---|---|---|---|---|
| Conservative | Chris Hayward | 1867 | 53.7 | -8.6 | |
| Liberal Democrat | Raj Khiroya | 895 | 25.7 | -7.8 | |
| UKIP | Giles Cowley | 512 | 14.7 | N/A | |
| Labour | Michael James Harrison | 187 | 5.4 | +1.9 | |
| Majority | 972 | ||||
| Turnout | 33.0 | ||||
| Conservative hold | Swing | ||||
| Party | Candidate | Votes | % | ± | |
|---|---|---|---|---|---|
| Liberal Democrat | Steve Drury | 1407 | 50.3 | -4.8 | |
| UKIP | Frank Martin Brand | 617 | 22.1 | N/A | |
| Conservative | Reena Ranger | 473 | 16.9 | -19.3 | |
| Labour | David Stephen Wynne-Jones | 288 | 10.3 | +2.7 | |
| Majority | 790 | ||||
| Turnout | 27.6 | ||||
| Liberal Democrat hold | Swing | ||||
| Party | Candidate | Votes | % | ± | |
|---|---|---|---|---|---|
| Conservative | Frances Button | 2350 | 69.0 | +20.3 | |
| Liberal Democrat | Pam Hames | 701 | 20.6 | -19.7 | |
| Labour | Ana Bakshi | 308 | 9.0 | +4.1 | |
| Majority | 1649 | ||||
| Turnout | 29.9 | ||||
| Conservative hold | Swing | ||||
| Party | Candidate | Votes | % | ± | |
|---|---|---|---|---|---|
| Conservative | Ralph Sangster | 1370 | 37.4 | -18.4 | |
| Liberal Democrat | Christopher Simon Lloyd | 1162 | 31.7 | -5.0 | |
| UKIP | Amy Charles | 707 | 19.3 | N/A | |
| Labour | Su Gomer | 409 | 11.2 | +5.3 | |
| Majority | 208 | ||||
| Turnout | 27.8 | ||||
| Conservative hold | Swing | ||||
| Party | Candidate | Votes | % | ± | |
|---|---|---|---|---|---|
| Labour | Joan King | 964 | 48.9 | +20.7 | |
| UKIP | Helena Ruth Hart | 472 | 24.0 | -1.6** | |
| Conservative | Ty Harris | 400 | 20.3 | -4.7 | |
| BNP | Christopher E Livingstone | 71 | 3.6 | -1.6** | |
| Liberal Democrat | Dennis John Rogers | 59 | 3.0 | -13.6 | |
| Majority | 492 | ||||
| Turnout | 22.3 | ||||
| Labour gain from BNP | Swing | ||||
Watford (6 Seats)
| Party | Candidate | Votes | % | ± | |
|---|---|---|---|---|---|
| Labour | Anne Joynes | 1264 | 39.0 | +27.3 | |
| Green | Ian Brandon | 857 | 26.4 | -9.6 | |
| Liberal Democrat | Dennis Wharton | 800 | 24.7 | -1.2 | |
| Conservative | Suqlain Mahmood | 296 | 9.1 | -16.0 | |
| Majority | 407 | ||||
| Turnout | 28.8 | ||||
| Labour gain from Green | Swing | ||||
| Party | Candidate | Votes | % | ± | |
|---|---|---|---|---|---|
| Liberal Democrat | Stephen Bernard Albert Frederick Henry Giles-Medhurst | 1387 | 47.6 | -3.5 | |
| Labour | Avril Joy Haley | 638 | 21.9 | +8.0 | |
| UKIP | Renie Susan Price | 398 | 13.6 | N/A | |
| Conservative | Neil John Punter | 312 | 10.7 | -13.1 | |
| Green | Susan Murray | 128 | 4.4 | -6.3 | |
| Trade Unionists and Socialists Against Cuts | Mark O'Connor | 49 | 1.7 | N/A | |
| Majority | 749 | ||||
| Turnout | 24.9 | ||||
| Liberal Democrat hold | Swing | ||||
| Party | Candidate | Votes | % | ± | |
|---|---|---|---|---|---|
| Liberal Democrat | Kareen Mary Hastrick | 1119 | 38.2 | -5.3 | |
| Conservative | Jane West | 425 | 14.5 | -13.1 | |
| Labour | Diana Mary Ivory | 569 | 19.4 | +6.7 | |
| UKIP | Nicholas Richard Lincoln | 709 | 24.2 | +16.1** | |
| Green | Martin Wiesner | 98 | 3.3 | -4.2 | |
| Majority | 410 | ||||
| Turnout | 27.2 | ||||
| Liberal Democrat hold | Swing | ||||
| Party | Candidate | Votes | % | ± | |
|---|---|---|---|---|---|
| Liberal Democrat | Mark Adrian Watkin | 1917 | 41.3 | -4.7 | |
| Conservative | Binita Mehta | 1387 | 29.9 | -11.1 | |
| Green | Sally Ivins | 143 | 3.1 | -3.6 | |
| Labour | Steven Palmer | 296 | 6.4 | +0.7 | |
| UKIP | David Penn | 446 | 9.6 | N/A | |
| Independent | Malcolm Anthony Meerabux | 445 | 9.6 | N/A | |
| Majority | 530 | ||||
| Turnout | 37.9 | ||||
| Liberal Democrat hold | Swing | ||||
| Party | Candidate | Votes | % | ± | |
|---|---|---|---|---|---|
| Labour | Nigel Bell | 1737 | 59.1 | +0.9 | |
| Liberal Democrat | Bobby Amin | 475 | 16.2 | -7.9 | |
| UKIP | Robert George Carter | 346 | 11.8 | N/A | |
| Conservative | David Charles Ealey | 227 | 7.7 | -2.0 | |
| Green | Paula Mary Evelyn Brodhurst | 149 | 5.1 | -1.8 | |
| Majority | 1262 | ||||
| Turnout | 24.3 | ||||
| Labour hold | Swing | ||||
| Party | Candidate | Votes | % | ± | |
|---|---|---|---|---|---|
| Liberal Democrat | Derek Thomas Francis Scudder | 1269 | 46.9 | -7.4 | |
| Conservative | Tony Rogers | 458 | 16.9 | -6.6 | |
| UKIP | Philip Louis Cox | 502 | 18.6 | N/A | |
| Labour | Omar Ismail | 376 | 13.9 | +1.4 | |
| Green | Alison Wiesner | 86 | 3.2 | -5.7 | |
| Majority | 767 | ||||
| Turnout | 24.8 | ||||
| Liberal Democrat hold | Swing | ||||
Welwyn Hatfield (7 Seats)
| Party | Candidate | Votes | % | ± | |
|---|---|---|---|---|---|
| Conservative | Sara Johnstone | 1072 | 36.4 | -13.7 | |
| Labour | Mike Larkins | 966 | 32.8 | +13.1 | |
| UKIP | Dan Paddock | 596 | 20.3 | N/A | |
| Green | Susan Groom | 142 | 4.8 | -9.1 | |
| Liberal Democrat | Frank Marsh | 122 | 4.1 | -11.3 | |
| Trade Unionists and Socialists Against Cuts | David Humphreys | 33 | 1.1 | N/A | |
| Majority | 106 | 3.6 | |||
| Turnout | 2933 | 28.8 | |||
| Conservative hold | Swing | ||||
| Party | Candidate | Votes | % | ± | |
|---|---|---|---|---|---|
| Liberal Democrat | Malcolm Cowan | 1380 | 40.0 | -2.6 | |
| Conservative | Harry Bower | 875 | 25.4 | -14.0 | |
| Labour | Steve Roberts | 600 | 17.4 | +7.3 | |
| UKIP | Alex Baker | 426 | 12.4 | N/A | |
| Green | Ian Nendick | 132 | 3.8 | -3.7 | |
| Trade Unionists and Socialists Against Cuts | Bryan Clare | 28 | 0.8 | N/A | |
| Majority | 505 | 14.6 | |||
| Turnout | 3441 | 32.2 | |||
| Liberal Democrat hold | Swing | ||||
| Party | Candidate | Votes | % | ± | |
|---|---|---|---|---|---|
| Labour | Maureen Cook | 1432 | 36.5 | +13.9 | |
| Conservative | Martin Marks | 1213 | 31.0 | -11.1 | |
| UKIP | Martin Orkin | 825 | 21.1 | N/A | |
| Liberal Democrat | Nigel Quinton | 204 | 5.2 | -15.4 | |
| Green | Adrian Toole | 161 | 4.1 | -5.6 | |
| Trade Unionists and Socialists Against Cuts | Richard Shattock | 71 | 1.8 | N/A | |
| Majority | 219 | 5.5 | |||
| Turnout | 3886 | 22.9 | |||
| Labour gain from Conservative | Swing | ||||
| Party | Candidate | Votes | % | ± | |
|---|---|---|---|---|---|
| Conservative | Martin Mills-Bishop | 1782 | 59.6 | -15.9 | |
| UKIP | Kevin Daley | 682 | 22.8 | N/A | |
| Labour | Diana Bell | 227 | 7.6 | +0.6 | |
| Green | Alan Borgars | 148 | 5.0 | -3.2 | |
| Liberal Democrat | Nigel Bain | 143 | 4.8 | -3.9 | |
| Majority | 1100 | 36.8 | |||
| Turnout | 2989 | 30.8 | -15.7 | ||
| Conservative hold | Swing | ||||
| Party | Candidate | Votes | % | ± | |
|---|---|---|---|---|---|
| Liberal Democrat | Paul Zukowskyj | 803 | 28.8 | +11.4 | |
| Conservative | Stuart Pile | 766 | 27.4 | -18.8 | |
| Labour | Cathy Watson | 640 | 22.9 | +2.5 | |
| UKIP | William Braithwaite | 474 | 17.0 | N/A | |
| Green | Barry Cross | 102 | 3.3 | -3.1 | |
| Majority | 37 | 1.4 | |||
| Turnout | 2785 | 27.3 | |||
| Liberal Democrat gain from Conservative | Swing | ||||
| Party | Candidate | Votes | % | ± | |
|---|---|---|---|---|---|
| Conservative | Richard Smith | 2117 | 52.5 | -9.7 | |
| UKIP | Arthur Stevens | 753 | 18.7 | N/A | |
| Labour | Roisin Reid | 629 | 15.6 | +4.8 | |
| Liberal Democrat | David Bartlett | 275 | 6.8 | -8.6 | |
| Green | William Berrington | 257 | 6.4 | -4.9 | |
| Majority | 1364 | 33.8 | |||
| Turnout | 4031 | 33.7 | |||
| Conservative hold | Swing | ||||
| Party | Candidate | Votes | % | ± | |
|---|---|---|---|---|---|
| Labour | Lynn Chesterman | 982 | 37.5 | +15.3 | |
| Conservative | Steve Markiewicz | 808 | 30.8 | -10.3 | |
| UKIP | Richard Colwell | 585 | 22.3 | N/A | |
| Green | Berenice Dowlen | 150 | 5.7 | -16.4 | |
| Liberal Democrat | Ayesha Rohale | 60 | 2.3 | -11.6 | |
| Trade Unionists and Socialists Against Cuts | Cameron Bransom | 29 | 1.1 | N/A | |
| Majority | 174 | 6.7 | |||
| Turnout | 2614 | 24.9 | |||
| Labour gain from Conservative | Swing | ||||
References
Unless otherwise stated, information has been taken from Hertfordshire County Council election pages
- ↑ "The Representation of the People (Form of Canvass) (England and Wales) Regulations 2006, Schedule Part 1". Legislation.gov.uk. 13 October 2011. Retrieved 18 April 2012.
- ↑ "I have two homes. Can I register at both addresses?". The Electoral Commission. Retrieved 5 January 2011.
- ↑ "Local elections: Nigel Farage hails results as a 'game changer'". BBC News. 3 May 2013. Retrieved 17 May 2013.