Cornwall Council election, 2013
| | |||||||||||||||||||||||||||||||||||||||||||||||||||||||
| |||||||||||||||||||||||||||||||||||||||||||||||||||||||
| |||||||||||||||||||||||||||||||||||||||||||||||||||||||
|
| |||||||||||||||||||||||||||||||||||||||||||||||||||||||
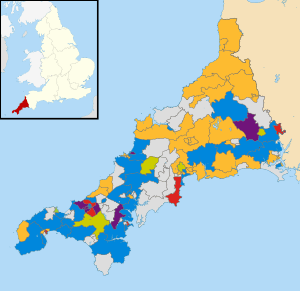
| Map showing the results of the 2013 Cornwall Council elections results by electoral division. Blue showing Conservative, Red showing Labour, Yellow showing Liberal Democrats, Purple showing UKIP, Grey showing Independents, "Old Gold" showing Mebyon Kernow and Green showing the Green Party. | |||||||||||||||||||||||||||||||||||||||||||||||||||||||
| |||||||||||||||||||||||||||||||||||||||||||||||||||||||
The Cornwall Council election, 2013, was an election for all 123 seats on the council. Cornwall Council is a unitary authority that covers the majority of the ceremonial county of Cornwall, with the exception of the Isles of Scilly which have an independent local authority. The elections took place concurrently with other local elections across England and Wales.
Background
The elections for Cornwall Council were the second since its creation in 2009. Cornwall had previously been administered as a non-metropolitan county, with local government powers split between Cornwall County Council and the six non-metropolitan districts of Caradon, Carrick, Kerrier, North Cornwall, Penwith and Restormel. These were abolished as part of the 2009 structural changes to local government in England, which created a singular unitary authority.[1] The elections in 2009 resulted in no group gaining a majority.[2] The Conservative and Independent councillors formed a coalition to control the Council, choosing the Conservative Alec Robertson as the leader.[3]
The Boundary Commission had undertaken a review of the Council's electoral divisions, which resulted in a number of changes to their boundaries and a reduction from 123 to 122 wards. One ward, Bude, would elect two councillors while the rest were represented by a single-member, leaving the number of councillors unchanged. All wards were contested in the election, with a total of 480 candidates standing across the county.[4][5] The Conservatives had the most candidates with 103, followed by the Liberal Democrats with 91 and the United Kingdom Independence Party with 77 candidates. Labour fielded 68, Cornish party Mebyon Kernow had 27, the Green Party 23 and the Liberal Party stood one person. Ninety independents were also standing, with some wards having multiple independent candidates.[6]
Elections to town and parish councils across Cornwall were also scheduled to take place on 2 May.[7] However, not all council elections were contested, as the amount of candidates were not greater than the seats available. Four parish councils with insufficient candidates would not have enough councillors to function after the elections. Councils that have vacancies after the elections would attempt to co-opt additional councillors.[8]
Campaign
The campaign was set against the backdrop of the Great Recession of the late 2000s, under a Labour government, and the subsequent public sector budget cuts of the Conservative-Liberal Democrat coalition government. There were also many issues that were pertinent to local voters in Cornwall, including the building of new houses, wind turbines, transportation infrastructure, jobs losses at the authority and the recent Council Tax freeze.[9][10]
The Conservative Party, speculated to be facing losses, hoped to attract voters through their previous record as the major party in the outgoing Conservative-Independent council administration.[10]
The Liberal Democrats, trying to become the largest party within the council, focused its campaign on cutting economic waste and increasing investment in transport infrastructure.[10][11]
Mebyon Kernow highlighted the fact that they were an alternative to the parties and groupings that had made up previous UK government or Cornwall Council administrations.[10]
UKIP, wanting to be seen as increasingly relevant to domestic politics, not just within Europe campaigned on issues of opposing the wind farm project and youth unemployment, but still highlighting its anti-EU stance.[12]
The Labour Party focused its campaign on the fact that, at the time, there was worry as to whether the UK government's Help to Buy scheme could be used to fund the buying of second homes in the county,[13] but was later announced to be untrue.[14] The party also pledged to keep Council Tax rates low.[15]
The Green Party campaigned on raising concerns over a proposed incinerator and overdeveloping land.[16]
Eligibility
All locally registered electors (British, Irish, Commonwealth and European Union citizens) who were aged 18 or over on Thursday 2 May 2013 were entitled to vote in the local elections. Those who were temporarily away from their ordinary address (for example, away working, on holiday, in student accommodation or in hospital) were also entitled to vote in the local elections,[17] although those who had moved abroad and registered as overseas electors cannot vote in the local elections. It is possible to register to vote at more than one address (such as a university student who had a term-time address and lives at home during holidays) at the discretion of the local Electoral Register Office, but it remains an offence to vote more than once in the same local government election.[18]
Composition before election
| Elected in 2009 | Before election | ||||
|---|---|---|---|---|---|
| Party | Seats | Party | Seats | ||
| Conservative | 50 | Conservative | 46 | ||
| Liberal Democrat | 38 | Liberal Democrat | 37 | ||
| Independent | 32 | Independent | 28 | ||
| Mebyon Kernow | 3 | Mebyon Kernow | 6 | ||
| Independent (non affiliated) | 0 | Independent (non affiliated) | 2 | ||
| Labour | 0 | Labour | 1 | ||
| Vacant | 0 | Vacant | 3 | ||
Election result
| Cornwall Council election, 2013[19][A][B] | ||||||||||
|---|---|---|---|---|---|---|---|---|---|---|
| Party | Seats | Gains | Losses | Net gain/loss | Seats % | Votes % | Votes | +/− | ||
| Independent | 37 | 14 | 9 | |
30.1 | 21.9% | 30,893 | | ||
| Liberal Democrat | 36 | 8 | 10 | |
29.2 | 23.0% | 32,355 | | ||
| Conservative | 31 | 4 | 19 | |
25.2 | 24.3% | 34,191 | | ||
| Labour | 8 | 8 | 0 | |
6.5 | 8.1% | 11,383 | | ||
| UKIP | 6 | 6 | 0 | |
4.9 | 15.1% | 21,306 | | ||
| Mebyon Kernow | 4 | 1 | 2 | |
3.25 | 4.8% | 6,824 | | ||
| Green | 1 | 1 | 0 | |
0.8 | 2.6% | 3,667 | | ||
| Liberal | 0 | 0 | 0 | 0 | 0 | 0.1% | 143 | | ||
- A The changes in party councillors in this table differs from that listed by the BBC because it is based purely on changes from the previous election,[20] not taking into account mid-term party defections or by-elections
- A The Independent grouping consists of those that were declared as "Independent" on the ballot paper, as well as those with no specification.[21]
Outcome
Following the election the council remained in no overall control with the Independent politicians becoming the largest grouping on the council through a modest gain of councillors from the previous election. The Liberal Democrats remained the second largest party after losing 2 councillors and the Conservatives slipped to third after losing over a third of their councillors.[22] The Labour Party, UKIP, Mebyon Kernow and the Green Party all gained seats, with UKIP and the Greens entering Cornwall Council for the first time.[22][23] Mebyon Kernow had had 6 seats prior to the election, having added 3 to their 2009 total, through defection and by-election. Following the election they held 4.
Within two weeks of the election the Conservative councillor for Ladock, St Clement and St Erme, Mike Eathorne-Gibbons, defected to the Independent grouping. Eathorne-Gibbons had been tipped to be the next leader of the Conservative group in the Council.[24][25]
The Liberal Democrats reached out to all the other parties elected to Council, wanting to form a cross-party administration.[26] The Conservatives decided not to join the alliance, after a lack of communication, therefore the Independents and Liberal Democrats formed a coalition administration with John Pollard of the Independents being elected leader of the council and the Liberal Democrats Jeremy Rowe as deputy leader.[27][28] The Green councillor and the Independent councillor for Probus, Tregony and Grampound, Bob Egerton, formed a non-aligned independent group.[29] The independent councillor for Wadebridge East, Collin Brewer, was not permitted to join the Independent grouping for his previous negative comments regarding disabled children.[30] Brewer later resigned from Cornwall Council and the Liberal Democrat, Steve Knightley, won the subsequent by-election.[31]
Electoral division results
The electoral division results listed below[32] are based on the changes from the 2009 elections,[33] not taking into account any mid-term by-elections or party defections.
| Party | Candidate | Votes | % | ± | |
|---|---|---|---|---|---|
| Conservative | Vivian Hall | 389 | 37.5 | ||
| UKIP | John Knights | 309 | 29.8 | ||
| Liberal Democrat | Sasha Gillard-Loft | 229 | 22.1 | ||
| Labour | Geoff Hale | 111 | 10.7 | ||
| Majority | 80 | 7.7 | |||
| Turnout | 1,038 | 39.6 | |||
| Conservative hold | Swing | ||||
| Party | Candidate | Votes | % | ± | |
|---|---|---|---|---|---|
| Liberal Democrat | Pat Rogerson | 517 | 62.1 | ||
| UKIP | Chris Wallis | 199 | 23.9 | ||
| Labour | David Acton | 73 | 8.8 | ||
| Conservative | Peter Scoffham | 43 | 5.2 | ||
| Majority | 318 | 38.2 | |||
| Turnout | 832 | 23.5 | |||
| Liberal Democrat hold | Swing | ||||
| Party | Candidate | Votes | % | ± | |
|---|---|---|---|---|---|
| Liberal Democrat | Ann Kerridge | 602 | 56.4 | ||
| UKIP | Pete Walters | 212 | 19.9 | ||
| Mebyon Kernow | Roger Lashbrook | 176 | 16.5 | ||
| Labour | Janet Hulme | 77 | 7.2 | ||
| Majority | 390 | 36.5 | |||
| Turnout | 1,067 | 27.4 | |||
| Liberal Democrat hold | Swing | ||||
| Party | Candidate | Votes | % | ± | |
|---|---|---|---|---|---|
| Liberal Democrat | Steve Rogerson | 649 | 56.1 | ||
| UKIP | John Masters | 188 | 16.2 | ||
| Independent | Lance Kennedy | 181 | 15.6 | ||
| Mebyon Kernow | John Gibbs | 139 | 12.0 | ||
| Majority | 461 | 39.8 | |||
| Turnout | 1,157 | 29.6 | |||
| Liberal Democrat gain from Conservative | Swing | ||||
| Party | Candidate | Votes | % | ± | |
|---|---|---|---|---|---|
| Conservative | John Keeling* | 562 | 55.1 | ||
| UKIP | Michael Mahon | 458 | 44.9 | ||
| Majority | 104 | 10.2 | |||
| Turnout | 1,020 | 28.2 | |||
| Conservative gain from Independent | Swing | ||||
- John Keeling was previously the Independent councillor for Breage
| Party | Candidate | Votes | % | ± | |
|---|---|---|---|---|---|
| Liberal Democrat | David Parsons | 1,413 | |||
| Liberal Democrat | Nigel Pearce | 1,281 | |||
| Conservative | Louise Emo | 460 | |||
| Turnout | 3,280 | 52.4 | |||
| Liberal Democrat win (new seat) | |||||
| Liberal Democrat win (new seat) | |||||
| Party | Candidate | Votes | % | ± | |
|---|---|---|---|---|---|
| Liberal Democrat | Simon Rix | 316 | 33.4 | ||
| Conservative | Rachel Beadle | 226 | 23.9 | ||
| Independent | Steve Hopper | 152 | 16.1 | ||
| Mebyon Kernow | Jerry Jefferies | 139 | 14.7 | ||
| Labour Co-op | David Doyle | 114 | 12.0 | ||
| Majority | 90 | 9.5 | |||
| Turnout | 947 | 25.2 | |||
| Liberal Democrat hold | Swing | ||||
| Party | Candidate | Votes | % | ± | |
|---|---|---|---|---|---|
| Mebyon Kernow | Andrew Long | 712 | 60.6 | ||
| UKIP | Dave Williams | 322 | 27.4 | ||
| Conservative | Sally Ann Nicholson | 107 | 9.1 | ||
| Liberal Democrat | Muriel June Merrett-Jones | 34 | 2.9 | ||
| Majority | 390 | 33.2 | |||
| Turnout | 1,175 | 31.4 | |||
| Mebyon Kernow hold | Swing | ||||
| Party | Candidate | Votes | % | ± | |
|---|---|---|---|---|---|
| UKIP | Harry Blakeley | 340 | 31.8 | ||
| Conservative | David Atherfold | 319 | 29.8 | ||
| Mebyon Kernow | John Gillingham | 211 | 19.7 | ||
| Labour | Trevor Chalker | 200 | 18.7 | ||
| Majority | 21 | 2.0 | |||
| Turnout | 1,070 | 32.1 | |||
| UKIP win (new seat) | |||||
| Party | Candidate | Votes | % | ± | |
|---|---|---|---|---|---|
| Conservative | Paul White | 475 | 39.1 | ||
| Labour Co-op | Jude Robinson | 435 | 35.8 | ||
| UKIP | Tess Hulland | 237 | 19.5 | ||
| Mebyon Kernow | John Rowe | 68 | 5.6 | ||
| Majority | 40 | 3.3 | |||
| Turnout | 1,215 | 35.1 | |||
| Conservative win (new seat) | |||||
| Party | Candidate | Votes | % | ± | |
|---|---|---|---|---|---|
| Conservative | Jon Stoneman | 243 | 30.3 | ||
| UKIP | Roger Laity | 225 | 28.0 | ||
| Labour | Adam Crickett | 197 | 24.5 | ||
| Mebyon Kernow | Zoe Fox | 104 | 13.0 | ||
| Green | David Everett | 34 | 4.2 | ||
| Majority | 18 | 2.2 | |||
| Turnout | 803 | 23.6 | |||
| Conservative win (new seat) | |||||
| Party | Candidate | Votes | % | ± | |
|---|---|---|---|---|---|
| Labour | Robert Webber | 178 | 19.8 | ||
| UKIP | Roy Appleton | 171 | 19.0 | ||
| Independent | Nicholas Heather | 151 | 16.8 | ||
| Mebyon Kernow | Alan Sanders | 146 | 16.2 | ||
| Conservative | Morwenna Williams | 136 | 15.1 | ||
| Liberal Democrat | Anna Pascoe | 61 | 6.8 | ||
| Green | Jacqueline Merrick | 58 | 6.4 | ||
| Majority | 7 | 0.8 | |||
| Turnout | 901 | 28.1 | |||
| Labour win (new seat) | |||||
| Party | Candidate | Votes | % | ± | |
|---|---|---|---|---|---|
| UKIP | Viv Lewis | 232 | 26.6 | ||
| Labour | Steve Richards | 220 | 25.2 | ||
| Conservative | Jeff Collins | 216 | 24.8 | ||
| Mebyon Kernow | Mike Champion | 204 | 23.4 | ||
| Majority | 12 | 1.4 | |||
| Turnout | 872 | 28.5 | |||
| UKIP win (new seat) | |||||
| Party | Candidate | Votes | % | ± | |
|---|---|---|---|---|---|
| Liberal Democrat | Rob Rotchell | 459 | 50.4 | +14.0 | |
| Conservative | Keith Goodenough | 452 | 49.6 | +6.5 | |
| Majority | 7 | 0.8 | |||
| Turnout | 911 | 28.8 | |||
| Liberal Democrat gain from Conservative | Swing | +3.8 | |||
| Party | Candidate | Votes | % | ± | |
|---|---|---|---|---|---|
| Independent | Mark Kaczmarek | 791 | 62.4 | ||
| UKIP | David Parker | 234 | 18.5 | ||
| Green | Geoff Garbett | 131 | 10.3 | ||
| Labour | Rosanna Phillips | 111 | 8.8 | ||
| Majority | 557 | 44.0 | |||
| Turnout | 1,267 | 32.7 | |||
| Independent win (new seat) | |||||
| Party | Candidate | Votes | % | ± | |
|---|---|---|---|---|---|
| Conservative | John Dyer | 534 | 52.3 | ||
| Independent | Ross Treseder | 264 | 25.9 | ||
| UKIP | Michael Warren | 146 | 14.3 | ||
| Labour | Peggy Wicks | 77 | 7.5 | ||
| Majority | 270 | 26.4 | |||
| Turnout | 1,021 | 33.7 | |||
| Conservative hold | Swing | ||||
| Party | Candidate | Votes | % | ± | |
|---|---|---|---|---|---|
| Conservative | Neil Hatton | 856 | 57.3 | ||
| UKIP | Lomond Handley | 434 | 29.1 | ||
| Labour | Susan Webber | 203 | 13.6 | ||
| Majority | 422 | 28.3 | |||
| Turnout | 1,493 | 38.6 | |||
| Conservative hold | Swing | ||||
| Party | Candidate | Votes | % | ± | |
|---|---|---|---|---|---|
| Mebyon Kernow | Loveday Jenkin* | 751 | 54.9 | ||
| Conservative | Linda Taylor | 290 | 21.2 | ||
| Independent | David Knight | 227 | 16.6 | ||
| Labour | Jackie Harding | 100 | 7.3 | ||
| Majority | 461 | 33.7 | |||
| Turnout | 1,368 | 32.1 | |||
| Mebyon Kernow gain from Independent | Swing | ||||
- Loveday Jenkin had won a by-election for Wendron during the previous Council
| Party | Candidate | Votes | % | ± | |
|---|---|---|---|---|---|
| Conservative | Geoffrey Evans | 624 | 68.9 | ||
| Labour | Robin Johnson | 180 | 19.9 | ||
| Liberal Democrat | Catherine Thornhill | 102 | 11.3 | ||
| Majority | 444 | 49.0 | |||
| Turnout | 906 | 30.9 | |||
| Conservative hold | Swing | ||||
| Party | Candidate | Votes | % | ± | |
|---|---|---|---|---|---|
| Conservative | Alan Jewell | 289 | 23.0 | ||
| Independent | Steve Eva | 274 | 21.9 | ||
| Liberal Democrat | Roger Bonney | 262 | 20.9 | ||
| UKIP | Mairi Hayworth | 237 | 18.9 | ||
| Labour | Nicholas Jemmett | 192 | 15.3 | ||
| Majority | 15 | 1.2 | |||
| Turnout | 1,254 | 33.5 | |||
| Conservative gain from Independent | Swing | ||||
| Party | Candidate | Votes | % | ± | |
|---|---|---|---|---|---|
| Labour Co-op | Hanna Toms | 361 | 36.2 | ||
| Independent | Grenville Chappel | 283 | 28.4 | ||
| Independent | John Body | 183 | 18.4 | ||
| UKIP | Amanda Wymer | 169 | 17.0 | ||
| Majority | 78 | 7.8 | |||
| Turnout | 996 | 27.5 | |||
| Labour Co-op gain from Independent | Swing | ||||
| Party | Candidate | Votes | % | ± | |
|---|---|---|---|---|---|
| Labour Co-op | Candy Atherton | 316 | 33.4 | ||
| Independent | Diana Merrett | 156 | 16.5 | ||
| Liberal Democrat | Kenny Edwards | 154 | 16.3 | ||
| Conservative | Liz Ashcroft | 130 | 13.8 | ||
| Independent | Christopher Smith | 115 | 12.2 | ||
| Independent | Tony Canton | 74 | 7.8 | ||
| Majority | 160 | 16.9 | |||
| Turnout | 945 | 27.3 | |||
| Labour Co-op gain from Independent | Swing | ||||
| Party | Candidate | Votes | % | ± | |
|---|---|---|---|---|---|
| Independent | David Saunby | 462 | 38.4 | ||
| Labour Co-op | Brod Ross | 285 | 23.7 | ||
| UKIP | Carole Douglas | 154 | 12.8 | ||
| Independent | Vicky Eva | 135 | 11.2 | ||
| Conservative | Peter Williams | 94 | 7.8 | ||
| Green | Euan McPhee | 43 | 3.6 | ||
| Liberal Democrat | Rhun Davies | 30 | 2.5 | ||
| Majority | 177 | 14.7 | |||
| Turnout | 1,203 | 32.6 | |||
| Independent hold | Swing | ||||
| Party | Candidate | Votes | % | ± | |
|---|---|---|---|---|---|
| Conservative | Steve Chamberlain | 801 | 44.0 | ||
| Independent | Bob Richards | 700 | 38.4 | ||
| Liberal Democrat | Christine Ryall | 183 | 10.0 | ||
| Labour | Jayne Kirkham | 138 | 7.6 | ||
| Majority | 101 | 5.5 | |||
| Turnout | 1,822 | 46.9 | |||
| Conservative hold | Swing | ||||
| Party | Candidate | Votes | % | ± | |
|---|---|---|---|---|---|
| UKIP | Derek John Elliott | 239 | 28.5 | ||
| Conservative | Peter Sheppard | 173 | 20.6 | ||
| Labour | Matthew Brown | 169 | 20.1 | ||
| Liberal | Paul Holmes | 143 | 17.0 | ||
| Mebyon Kernow | Chris Lawrence | 115 | 13.7 | ||
| Majority | 66 | 7.9 | |||
| Turnout | 839 | 24.5 | |||
| UKIP win (new seat) | |||||
| Party | Candidate | Votes | % | ± | |
|---|---|---|---|---|---|
| Liberal Democrat | David Hughes | 490 | 37.8 | ||
| Mebyon Kernow | Fiona Carlyon | 477 | 36.8 | ||
| Conservative | Adrian Howard Wildish | 329 | 25.4 | ||
| Majority | 13 | 1.0 | |||
| Turnout | 1,296 | 38.1 | |||
| Liberal Democrat win (new seat) | |||||
| Party | Candidate | Votes | % | ± | |
|---|---|---|---|---|---|
| Liberal Democrat | Paula Dolphin | 864 | 67.8 | -4.6 | |
| Conservative | Shorne Tilbey | 410 | 32.2 | +4.6 | |
| Majority | 454 | 35.6 | |||
| Turnout | 1,274 | 36.6 | |||
| Liberal Democrat hold | Swing | -4.6 | |||
| Party | Candidate | Votes | % | ± | |
|---|---|---|---|---|---|
| Liberal Democrat | Mario Fonk | 889 | 66.5 | ||
| UKIP | Rose Smith | 317 | 23.7 | ||
| Conservative | Pamela Yeates | 130 | 9.7 | ||
| Majority | 572 | 42.8 | |||
| Turnout | 1,336 | 38.9 | |||
| Liberal Democrat hold | Swing | ||||
| Party | Candidate | Votes | % | ± | |
|---|---|---|---|---|---|
| Labour | Dorothy Kirk | 477 | 34.4 | ||
| Conservative | Russell Bartlett | 418 | 30.1 | ||
| UKIP | Sam Gardner | 341 | 24.6 | ||
| Liberal Democrat | Martin Emery | 152 | 11.0 | ||
| Majority | 59 | 4.3 | |||
| Turnout | 1,388 | 37.6 | |||
| Labour gain from Conservative | Swing | ||||
| Party | Candidate | Votes | % | ± | |
|---|---|---|---|---|---|
| Conservative | Lionel Pascoe | 414 | 30.1 | ||
| UKIP | Peter Channon | 311 | 22.6 | ||
| Independent | Angelo Spencer-Smith | 248 | 18.0 | ||
| Independent | Michael Roberts | 183 | 13.3 | ||
| Labour | Michael Smith | 118 | 8.6 | ||
| Liberal Democrat | Yvonne Bates | 61 | 4.4 | ||
| Green | Theresa Byrne | 42 | 3.1 | ||
| Majority | 103 | 7.5 | |||
| Turnout | 1,377 | 37.2 | |||
| Conservative hold | Swing | ||||
| Party | Candidate | Votes | % | ± | |
|---|---|---|---|---|---|
| Independent | John Pollard | 716 | 65.4 | ||
| UKIP | Lynda Chidell | 260 | 23.8 | ||
| Labour | Anthony Phillips | 118 | 10.8 | ||
| Majority | 456 | 41.7 | |||
| Turnout | 1,094 | 29.3 | |||
| Independent hold | Swing | ||||
| Party | Candidate | Votes | % | ± | |
|---|---|---|---|---|---|
| Independent | John Coombe | 503 | 44.7 | ||
| UKIP | Clive Polkinghorne | 328 | 29.1 | ||
| Labour | Anne-Marie Rance | 181 | 16.1 | ||
| Independent | Graham Coad | 114 | 10.1 | ||
| Majority | 175 | 15.5 | |||
| Turnout | 1,126 | 33.9 | |||
| Independent hold | Swing | ||||
| Party | Candidate | Votes | % | ± | |
|---|---|---|---|---|---|
| Independent | Phil Martin | 590 | 44.2 | ||
| Conservative | Alec Robertson | 494 | 37.0 | ||
| UKIP | Leonie Gough | 184 | 13.8 | ||
| Liberal Democrat | Mollie Scrase | 68 | 5.1 | ||
| Majority | 96 | 7.2 | |||
| Turnout | 1,336 | 35.6 | |||
| Independent gain from Conservative | Swing | ||||
| Party | Candidate | Votes | % | ± | |
|---|---|---|---|---|---|
| Independent | Judith Haycock | 427 | 39.3 | ||
| Liberal Democrat | John Martin | 215 | 19.8 | ||
| UKIP | Scott Blandford | 210 | 19.3 | ||
| Conservative | Tanya Dyer | 141 | 13.0 | ||
| Independent | James Buchanan | 94 | 8.6 | ||
| Majority | 212 | 19.5 | |||
| Turnout | 1,087 | 27.2 | |||
| Independent hold | Swing | ||||
| Party | Candidate | Votes | % | ± | |
|---|---|---|---|---|---|
| Conservative | Terry Wilkins | 331 | 28.8 | ||
| Mebyon Kernow | Stephen Richardson | 290 | 25.2 | ||
| UKIP | Don Armstrong | 259 | 22.5 | ||
| Liberal Democrat | David Raymond Ekinsmyth | 157 | 13.7 | ||
| Labour | Linda Moore | 113 | 9.8 | ||
| Majority | 41 | 3.6 | |||
| Turnout | 1,150 | 30.4 | |||
| Conservative hold | Swing | ||||
| Party | Candidate | Votes | % | ± | |
|---|---|---|---|---|---|
| Conservative | Mike Eathorne-Gibbons | 666 | 57.4 | ||
| Green | Jo Poland | 234 | 20.2 | ||
| Liberal Democrat | Ian Jones | 171 | 14.7 | ||
| Labour | Stuart Venison | 89 | 7.7 | ||
| Majority | 432 | 37.2 | |||
| Turnout | 1,160 | 32.6 | |||
| Conservative hold | Swing | ||||
| Party | Candidate | Votes | % | ± | |
|---|---|---|---|---|---|
| Liberal Democrat | Chris Batters | 532 | 47.5 | ||
| UKIP | Tom Hobbs | 403 | 36.0 | ||
| Green | Steve Haynes | 185 | 16.5 | ||
| Majority | 129 | 11.5 | |||
| Turnout | 1,120 | 34.1 | |||
| Liberal Democrat gain from Conservative | Swing | ||||
| Party | Candidate | Votes | % | ± | |
|---|---|---|---|---|---|
| Independent | John Thomas | 441 | 33.3 | ||
| Independent | Neil Plummer | 399 | 30.1 | ||
| Independent | James Biscoe | 195 | 14.7 | ||
| UKIP | Bob Mims | 140 | 10.6 | ||
| Labour | Laura Eyre | 85 | 6.4 | ||
| Independent | Peter Tisdale | 66 | 5.0 | ||
| Majority | 42 | 3.2 | |||
| Turnout | 1,326 | 34.2 | |||
| Independent win (new seat) | |||||
| Party | Candidate | Votes | % | ± | |
|---|---|---|---|---|---|
| Liberal Democrat | Alex Folkes | 551 | 70.8 | ||
| Conservative | Philip Tucker | 134 | 17.2 | ||
| Labour | Kris Roberts | 93 | 12.0 | ||
| Majority | 417 | 53.6 | |||
| Turnout | 778 | 25.9 | |||
| Liberal Democrat hold | Swing | ||||
| Party | Candidate | Votes | % | ± | |
|---|---|---|---|---|---|
| Liberal Democrat | Adam Paynter | 769 | 51.6 | ||
| UKIP | Graham Ford | 364 | 24.4 | ||
| Conservative | Bill Sowerby | 206 | 13.8 | ||
| Independent | Max Richard Hailey | 79 | 5.3 | ||
| Independent | Krystyna Zdan-Michajlowicz | 73 | 4.9 | ||
| Majority | 405 | 27.2 | |||
| Turnout | 1,491 | 39.3 | |||
| Liberal Democrat hold | Swing | ||||
| Party | Candidate | Votes | % | ± | |
|---|---|---|---|---|---|
| Liberal Democrat | Jade Lynne Farrington | 452 | 45.5 | ||
| UKIP | James Alan Wonnacott | 239 | 24.1 | ||
| Independent | John Charles Conway | 211 | 21.2 | ||
| Labour | Susan Roberts Alfar | 91 | 9.2 | ||
| Majority | 213 | 21.5 | |||
| Turnout | 993 | 34.4 | |||
| Liberal Democrat hold | Swing | ||||
| Party | Candidate | Votes | % | ± | |
|---|---|---|---|---|---|
| Conservative | Liz Penhaligon | 393 | 34.7 | ||
| UKIP | Sandy Martin | 256 | 22.6 | ||
| Green | Maxine Armstrong | 156 | 13.8 | ||
| Independent | Richard Glanville | 114 | 10.1 | ||
| Liberal Democrat | Howard Hollingsbee | 112 | 9.9 | ||
| Labour | Graham Webster | 102 | 9.0 | ||
| Majority | 137 | 12.1 | |||
| Turnout | 1,133 | 35.6 | |||
| Conservative hold | Swing | ||||
| Party | Candidate | Votes | % | ± | |
|---|---|---|---|---|---|
| Independent | Sally Jane Hawken | 334 | 33.5 | ||
| Liberal Democrat | Tony Powell | 283 | 28.4 | ||
| UKIP | Oliver John Challis | 235 | 23.6 | ||
| Conservative | John Gerrard Stevenson | 145 | 14.5 | ||
| Majority | 51 | 5.1 | |||
| Turnout | 997 | 26.1 | |||
| Independent gain from Liberal Democrat | Swing | ||||
| Party | Candidate | Votes | % | ± | |
|---|---|---|---|---|---|
| Independent | Roger Graeme Holmes | 151 | 29.0 | ||
| Liberal Democrat | Jan Powell* | 145 | 27.8 | ||
| Conservative | Thusha Balalojanan | 115 | 22.1 | ||
| UKIP | Jenifer Grace Lucas | 110 | 21.1 | ||
| Majority | 6 | 1.2 | |||
| Turnout | 521 | 36.1 | |||
| Independent gain from Conservative | Swing | ||||
- Previous councillor Jan Powell had defected from the Conservatives to join the Liberal Democrats in June 2011[35]
| Party | Candidate | Votes | % | ± | |
|---|---|---|---|---|---|
| Liberal Democrat | Michael George | 796 | 68.0 | ||
| UKIP | Patricia Kareen Mary Marris | 375 | 32.0 | ||
| Majority | 421 | 36.0 | |||
| Turnout | 1,171 | 34.7 | |||
| Liberal Democrat hold | Swing | ||||
| Party | Candidate | Votes | % | ± | |
|---|---|---|---|---|---|
| Independent | Armand Toms* | 687 | 58.6 | ||
| Conservative | James Stephen Gowing | 225 | 19.2 | ||
| UKIP | Les Richmond | 183 | 15.6 | ||
| Green | Rick Harmes | 47 | 4.0 | ||
| Liberal Democrat | Sandra Margaret Preston | 30 | 2.6 | ||
| Majority | 462 | 39.4 | |||
| Turnout | 1,172 | 42.2 | |||
| Independent gain from Conservative | Swing | ||||
- Previous councillor Armand Toms defected from the Conservatives to join the Independents in March 2013[36]
| Party | Candidate | Votes | % | ± | |
|---|---|---|---|---|---|
| Liberal Democrat | Edwina Hannaford | 963 | 51.0 | ||
| Conservative | Brian Galipeau | 523 | 27.7 | ||
| UKIP | Tony Winter | 402 | 21.3 | ||
| Majority | 440 | 23.3 | |||
| Turnout | 1,888 | 48.2 | |||
| Liberal Democrat hold | Swing | ||||
| Party | Candidate | Votes | % | ± | |
|---|---|---|---|---|---|
| Conservative | Benedicte Poula Gwyneth Bay | 442 | 35.6 | ||
| UKIP | Nigel Andrew Challis | 354 | 28.5 | ||
| Independent | Graham Thomas Jarrett | 334 | 26.9 | ||
| Liberal Democrat | Marian Oldor Candy | 113 | 9.1 | ||
| Majority | 88 | 7.1 | |||
| Turnout | 1,243 | 36.6 | |||
| Conservative hold | Swing | ||||
| Party | Candidate | Votes | % | ± | |
|---|---|---|---|---|---|
| Conservative | Roy Mann | 477 | 40.2 | ||
| UKIP | Robert Smith | 426 | 35.9 | ||
| Green | Ian Flindall | 283 | 23.9 | ||
| Majority | 51 | 4.3 | |||
| Turnout | 1,186 | 34.7 | |||
| Conservative gain from Independent | Swing | ||||
| Party | Candidate | Votes | % | ± | |
|---|---|---|---|---|---|
| UKIP | Stephanie McWilliam | 469 | 35.0 | ||
| Conservative | Finbar John Heely | 391 | 29.2 | ||
| Liberal Democrat | Christine Joy Hordley | 388 | 29.0 | ||
| Independent | Alan William Neal | 91 | 6.8 | ||
| Majority | 78 | 5.8 | |||
| Turnout | 1,339 | 37.8 | |||
| UKIP gain from Liberal Democrat | Swing | ||||
| Party | Candidate | Votes | % | ± | |
|---|---|---|---|---|---|
| UKIP | Michael Keogh | 413 | 28.6 | ||
| Conservative | Chris Ridgers | 410 | 28.4 | ||
| Liberal Democrat | John Ault | 331 | 22.9 | ||
| Independent | Christopher Jackson | 160 | 11.1 | ||
| Labour | Betty Ross | 129 | 8.9 | ||
| Majority | 3 | 0.2 | |||
| Turnout | 1,443 | 39.7 | |||
| UKIP gain from Conservative | Swing | ||||
| Party | Candidate | Votes | % | ± | |
|---|---|---|---|---|---|
| Conservative | Sue Nicholas | 578 | 41.9 | ||
| UKIP | Glyn Owen | 511 | 37.1 | ||
| Green | Peter Williams | 289 | 21.0 | ||
| Majority | 67 | 4.9 | |||
| Turnout | 1,378 | 37.0 | |||
| Conservative hold | Swing | ||||
| Party | Candidate | Votes | % | ± | |
|---|---|---|---|---|---|
| Conservative | Bernie Ellis | 549 | 38.0 | ||
| UKIP | David Clue | 450 | 31.2 | ||
| Liberal Democrat | Charles Robert Boney | 352 | 24.4 | ||
| Green | Richard John Sedgley | 93 | 6.4 | ||
| Majority | 99 | 6.9 | |||
| Turnout | 1,444 | 45.7 | |||
| Conservative hold | Swing | ||||
| Party | Candidate | Votes | % | ± | |
|---|---|---|---|---|---|
| Labour | Michael Bunney | 391 | 29.7 | ||
| UKIP | Michael Williams | 364 | 27.6 | ||
| Conservative | James Michael Mustoe | 316 | 24.0 | ||
| Liberal Democrat | Ella Jill Westland | 184 | 14.0 | ||
| Green | Katherine Moseley | 62 | 4.7 | ||
| Majority | 28 | 2.1 | |||
| Turnout | 1,316 | 40.5 | |||
| Labour gain from Conservative | Swing | ||||
| Party | Candidate | Votes | % | ± | |
|---|---|---|---|---|---|
| Independent | Gary James King | 312 | 37.0 | ||
| Conservative | Anne Rachel Double | 221 | 26.2 | ||
| Independent | Shirley Polmounter | 153 | 18.1 | ||
| Labour | Paul David Roberts | 102 | 12.1 | ||
| Liberal Democrat | Eileen Rix | 56 | 6.6 | ||
| Majority | 91 | 10.8 | |||
| Turnout | 844 | 23.9 | |||
| Independent gain from Liberal Democrat | Swing | ||||
| Party | Candidate | Votes | % | ± | |
|---|---|---|---|---|---|
| Liberal Democrat | Joyce Duffin | 808 | 66.7 | ||
| UKIP | Eileen Lewis | 281 | 23.2 | ||
| Labour | Phillip Knight | 123 | 10.1 | ||
| Majority | 527 | 43.5 | |||
| Turnout | 1,212 | 33.4 | |||
| Liberal Democrat hold | Swing | ||||
| Party | Candidate | Votes | % | ± | |
|---|---|---|---|---|---|
| Independent | Carolyn Rule | 577 | 48.0 | ||
| UKIP | Nina Sutherland | 341 | 28.3 | ||
| Conservative | Alfred Mesropians | 285 | 23.7 | ||
| Majority | 236 | 19.7 | |||
| Turnout | 1,203 | 35.9 | |||
| Independent gain from Conservative | Swing | ||||
| Party | Candidate | Votes | % | ± | |
|---|---|---|---|---|---|
| Conservative | Lisa Shuttlewood | 555 | 46.2 | ||
| Mebyon Kernow | Rod Toms | 529 | 44.0 | ||
| Labour | Meg Tremayne | 118 | 9.8 | ||
| Majority | 26 | 2.2 | |||
| Turnout | 1,202 | 31.1 | |||
| Conservative hold | Swing | ||||
| Party | Candidate | Votes | % | ± | |
|---|---|---|---|---|---|
| Conservative | Roger Harding | 695 | 47.9 | ||
| UKIP | Tracy Smith | 265 | 18.3 | ||
| Green | George Ford | 159 | 11.0 | ||
| Labour | Nicholas Round | 159 | 11.0 | ||
| Independent | Nigel Davis | 92 | 6 | ||
| Liberal Democrat | Caroline White | 82 | 6.3 | ||
| Majority | 430 | 29.4 | |||
| Turnout | 1,452 | 40.4 | |||
| Conservative hold | Swing | ||||
| Party | Candidate | Votes | % | ± | |
|---|---|---|---|---|---|
| Liberal Democrat | Geoff Brown | 267 | 52.3 | ||
| Independent | Steven Charles Slade | 244 | 47.7 | ||
| Majority | 23 | 4.5 | |||
| Turnout | 511 | 17.6 | |||
| Liberal Democrat hold | Swing | ||||
| Party | Candidate | Votes | % | ± | |
|---|---|---|---|---|---|
| Liberal Democrat | Joanna Nora Kenny | 516 | 64.8 | ||
| Conservative | Lyndon Spencer Harrison | 280 | 35.2 | ||
| Majority | 236 | 29.6 | |||
| Turnout | 796 | 25.6 | |||
| Liberal Democrat hold | Swing | ||||
| Party | Candidate | Votes | % | ± | |
|---|---|---|---|---|---|
| Liberal Democrat | Dave Sleeman | 384 | 54.0 | ||
| Conservative | Kevin Towill | 327 | 46.0 | ||
| Majority | 57 | 8.0 | |||
| Turnout | 711 | 22.0 | |||
| Liberal Democrat hold | Swing | ||||
| Party | Candidate | Votes | % | ± | |
|---|---|---|---|---|---|
| Conservative | Patrick Lambshead | 292 | 35.6 | ||
| Liberal Democrat | George Edwards | 269 | 32.8 | ||
| UKIP | Doris Latham | 260 | 31.7 | ||
| Majority | 23 | 2.8 | |||
| Turnout | 821 | 26.9 | |||
| Conservative hold | Swing | ||||
| Party | Candidate | Votes | % | ± | |
|---|---|---|---|---|---|
| UKIP | Mark Hicks | 266 | 30.3 | ||
| Conservative | Andy Hannan | 237 | 27.0 | ||
| Liberal Democrat | Sandy Carter | 218 | 24.9 | ||
| Labour | Joan Bowden | 156 | 17.8 | ||
| Majority | 29 | 3.3 | |||
| Turnout | 877 | 27.5 | |||
| UKIP gain from Independent | Swing | ||||
| Party | Candidate | Votes | % | ± | |
|---|---|---|---|---|---|
| Liberal Democrat | Richard Buscombe | 676 | 53.4 | ||
| Conservative | Stephen Rushworth | 589 | 46.6 | ||
| Majority | 87 | 6.9 | |||
| Turnout | 1,265 | 38.5 | |||
| Liberal Democrat gain from Conservative | Swing | ||||
| Party | Candidate | Votes | % | ± | |
|---|---|---|---|---|---|
| Liberal Democrat | Douglas Scrafton | 355 | 39.6 | ||
| Conservative | Richard Pears | 279 | 31.1 | ||
| Independent | Alison Jane Watkins | 263 | 29.3 | ||
| Majority | 76 | 8.5 | |||
| Turnout | 897 | 28.9 | |||
| Liberal Democrat win (new seat) | |||||
| Party | Candidate | Votes | % | ± | |
|---|---|---|---|---|---|
| Conservative | Tony Martin | 343 | 23.3 | ||
| Independent | John Symons | 327 | 22.2 | ||
| Liberal Democrat | Judith Whiteley | 320 | 21.7 | ||
| UKIP | Paula Clements | 268 | 18.2 | ||
| Labour | Miriam Venner | 124 | 8.4 | ||
| Mebyon Kernow | David Garwood | 92 | 6.2 | ||
| Majority | 16 | 1.1 | |||
| Turnout | 1,474 | 35.6 | |||
| Conservative hold | Swing | ||||
| Party | Candidate | Votes | % | ± | |
|---|---|---|---|---|---|
| Independent | Mary May | 399 | 42.6 | ||
| Liberal Democrat | Cait Hutchings | 261 | 27.9 | ||
| UKIP | Martin Orders | 183 | 19.6 | ||
| Labour | Jim Lloyd-Davies | 93 | 9.9 | ||
| Majority | 138 | 14.7 | |||
| Turnout | 936 | 26.2 | |||
| Independent hold | Swing | ||||
| Party | Candidate | Votes | % | ± | |
|---|---|---|---|---|---|
| Mebyon Kernow | Matthew John Luke | 356 | 43.6 | ||
| Liberal Democrat | Christopher Rowe | 295 | 36.2 | ||
| Conservative | Jamie Hanlon | 165 | 20.2 | ||
| Majority | 61 | 7.5 | |||
| Turnout | 816 | 23.7 | |||
| Mebyon Kernow gain from Liberal Democrat | Swing | ||||
| Party | Candidate | Votes | % | ± | |
|---|---|---|---|---|---|
| Labour | Cornelius Olivier | 398 | 31.4 | ||
| Liberal Democrat | Penny Young | 354 | 27.9 | ||
| UKIP | Peter Mates | 178 | 14.0 | ||
| Independent | John Moreland | 158 | 12.5 | ||
| Conservative | Michael Rabbitte | 127 | 10.0 | ||
| Mebyon Kernow | Phillip Rendle | 53 | 4.2 | ||
| Majority | 44 | 3.5 | |||
| Turnout | 1,268 | 38.6 | |||
| Labour gain from Liberal Democrat | Swing | ||||
| Party | Candidate | Votes | % | ± | |
|---|---|---|---|---|---|
| Labour | Tim Dwelly | 378 | 30.6 | ||
| Liberal Democrat | Ruth Lewarne | 358 | 29.0 | ||
| UKIP | Mick Faulkner | 194 | 15.7 | ||
| Conservative | Angela Elliott | 124 | 10.0 | ||
| Mebyon Kernow | Rob Simmons | 91 | 7.4 | ||
| Green | Michelle Paine | 89 | 7.2 | ||
| Majority | 20 | 1.6 | |||
| Turnout | 1,234 | 35.9 | |||
| Labour gain from Liberal Democrat | Swing | ||||
| Party | Candidate | Votes | % | ± | |
|---|---|---|---|---|---|
| Independent | Jim McKenna | 484 | 33.4 | ||
| Liberal Democrat | Daniel Garside | 368 | 25.4 | ||
| Labour | John Kirman | 283 | 19.5 | ||
| UKIP | Elizabeth Shore | 198 | 13.6 | ||
| Conservative | David Miles | 118 | 8.1 | ||
| Majority | 116 | 8.0 | |||
| Turnout | 1,451 | 45.7 | |||
| Independent hold | Swing | ||||
| Party | Candidate | Votes | % | ± | |
|---|---|---|---|---|---|
| Independent | Michael Callan | 832 | 64.9 | ||
| Mebyon Kernow | Paul Dunbar | 171 | 13.3 | ||
| Conservative | Lisa Marshall | 143 | 11.2 | ||
| Independent | Mark Langdon | 75 | 5.9 | ||
| Labour | Simon Coley | 61 | 4.8 | ||
| Majority | 661 | 51.6 | |||
| Turnout | 1,282 | 33.9 | |||
| Independent hold | Swing | ||||
| Party | Candidate | Votes | % | ± | |
|---|---|---|---|---|---|
| Labour | Malcom Moyle | 344 | 41.4 | ||
| Conservative | Clive Bramley | 244 | 29.4 | ||
| UKIP | Brenda Blakeley | 242 | 29.2 | ||
| Majority | 100 | 12.0 | |||
| Turnout | 830 | 25.6 | |||
| Labour win (new seat) | |||||
| Party | Candidate | Votes | % | ± | |
|---|---|---|---|---|---|
| Independent | Andrew Wallis | 706 | 65.0 | ||
| Conservative | Liz Lane | 189 | 17.4 | ||
| UKIP | Stephen Gough | 156 | 14.4 | ||
| Liberal Democrat | Richard Goedegebuur | 35 | 3.2 | ||
| Majority | 517 | 47.6 | |||
| Turnout | 1,086 | 31.9 | |||
| Independent hold | Swing | ||||
| Party | Candidate | Votes | % | ± | |
|---|---|---|---|---|---|
| Liberal Democrat | Nicky Chopak | 487 | 37.1 | ||
| Conservative | Andrew Vernon Ades | 449 | 34.2 | ||
| Mebyon Kernow | Paul Sousek | 206 | 15.7 | ||
| Independent | Rupert Powell | 171 | 13.0 | ||
| Majority | 38 | 2.9 | |||
| Turnout | 1,313 | 35.9 | |||
| Liberal Democrat gain from Conservative | Swing | ||||
| Party | Candidate | Votes | % | ± | |
|---|---|---|---|---|---|
| Independent | Bob Egerton | 903 | 66.1 | ||
| UKIP | Steve Kendall | 283 | 20.7 | ||
| Conservative | Sean Marshall | 138 | 10.1 | ||
| Labour | Norman Roach | 42 | 3.1 | ||
| Majority | 620 | 45.4 | |||
| Turnout | 1,366 | 42.4 | |||
| Independent hold | Swing | ||||
| Party | Candidate | Votes | % | ± | |
|---|---|---|---|---|---|
| Independent | George Trubody | 536 | 28.1 | ||
| Conservative | Chris Wilton | 533 | 28.0 | ||
| UKIP | Peter John McLaren | 524 | 27.5 | ||
| Liberal Democrat | Becky Lingard | 312 | 16.4 | ||
| Majority | 3 | 0.2 | |||
| Turnout | 1,905 | 48.8 | |||
| Independent gain from Conservative | Swing | ||||
| Party | Candidate | Votes | % | ± | |
|---|---|---|---|---|---|
| Conservative | Mike Eddowes | 257 | 40.3 | ||
| UKIP | Wally Duncan | 221 | 34.6 | ||
| Labour | Raymond Webber | 160 | 25.1 | ||
| Majority | 36 | 5.6 | |||
| Turnout | 638 | 20.9 | |||
| Conservative hold | Swing | ||||
| Party | Candidate | Votes | % | ± | |
|---|---|---|---|---|---|
| Independent | Lisa Dolley | 443 | 41.2 | ||
| Labour | Robert Barnes | 365 | 34.0 | ||
| UKIP | Ann Wood | 266 | 24.8 | ||
| Majority | 78 | 7.3 | |||
| Turnout | 1,074 | 22.9 | |||
| Independent hold | Swing | ||||
| Party | Candidate | Votes | % | ± | |
|---|---|---|---|---|---|
| Independent | Ian Thomas | 342 | 41.4 | ||
| Labour | Will Tremayne | 311 | 37.7 | ||
| UKIP | Ray Wyse | 173 | 20.9 | ||
| Majority | 31 | 3.8 | |||
| Turnout | 826 | 27.0 | |||
| Independent hold | Swing | ||||
| Party | Candidate | Votes | % | ± | |
|---|---|---|---|---|---|
| Independent | John Wood | 448 | 52.6 | ||
| Mebyon Kernow | Brian John Higman | 336 | 39.5 | ||
| Conservative | Derek Robert Walker | 67 | 7.9 | ||
| Majority | 112 | 13.2 | |||
| Turnout | 851 | 27.8 | |||
| Independent hold | Swing | ||||
| Party | Candidate | Votes | % | ± | |
|---|---|---|---|---|---|
| Independent | Julian German | 976 | 67.5 | ||
| Conservative | Frederick Greenslade | 252 | 17.4 | ||
| UKIP | Elizabeth Coleman | 175 | 12.1 | ||
| Labour | Callum Macleod | 42 | 2.9 | ||
| Majority | 724 | 50.1 | |||
| Turnout | 1,445 | 47.8 | |||
| Independent hold | Swing | ||||
| Party | Candidate | Votes | % | ± | |
|---|---|---|---|---|---|
| Independent | Derek Alan Holley | 870 | 80.5 | ||
| Conservative | David Ward | 139 | 12.9 | ||
| Liberal Democrat | James Alexander Shepherd | 72 | 6.7 | ||
| Majority | 731 | 67.6 | |||
| Turnout | 1,081 | 32.2 | |||
| Independent hold | Swing | ||||
| Party | Candidate | Votes | % | ± | |
|---|---|---|---|---|---|
| Independent | Joe Ellison | 372 | 45.6 | ||
| Liberal Democrat | Denise Watkins | 270 | 33.1 | ||
| Independent | John Joseph Brady | 174 | 21.3 | ||
| Majority | 102 | 12.5 | |||
| Turnout | 816 | 25.3 | |||
| Independent gain from Liberal Democrat | Swing | ||||
| Party | Candidate | Votes | % | ± | |
|---|---|---|---|---|---|
| Liberal Democrat | Hilary Anne Frank | 685 | 70.3 | ||
| Conservative | Beryl Rosekilly | 289 | 29.7 | ||
| Majority | 396 | 40.7 | |||
| Turnout | 974 | 29.6 | |||
| Liberal Democrat hold | Swing | ||||
| Party | Candidate | Votes | % | ± | |
|---|---|---|---|---|---|
| Liberal Democrat | Bob Austin | 628 | 62.5 | ||
| Conservative | Gloria Mary Challen | 377 | 37.5 | ||
| Majority | 251 | 25.0 | |||
| Turnout | 1,005 | 29.1 | |||
| Liberal Democrat hold | Swing | ||||
| Party | Candidate | Votes | % | ± | |
|---|---|---|---|---|---|
| Liberal Democrat | Pete Mitchell | 613 | 52.9 | ||
| Conservative | Dawn Brown | 398 | 34.4 | ||
| Labour | Robert Harrison | 147 | 12.7 | ||
| Majority | 215 | 18.6 | |||
| Turnout | 1,158 | 31.4 | |||
| Liberal Democrat hold | Swing | ||||
| Party | Candidate | Votes | % | ± | |
|---|---|---|---|---|---|
| Conservative | Tom French | 582 | 46.3 | ||
| Independent | Anne Langley | 546 | 43.4 | ||
| Labour | Maggi Pitches | 129 | 10.3 | ||
| Majority | 36 | 2.9 | |||
| Turnout | 1,257 | 34.1 | |||
| Conservative hold | Swing | ||||
| Party | Candidate | Votes | % | ± | |
|---|---|---|---|---|---|
| Liberal Democrat | Malcolm Alan Brown | 276 | 27.0 | ||
| Independent | Graham Eric Walker* | 264 | 25.8 | ||
| Conservative | Bob Davidson | 194 | 19.0 | ||
| UKIP | Ian Proctor | 173 | 16.9 | ||
| Labour Co-op | Brendan Parkinson | 115 | 11.3 | ||
| Majority | 12 | 1.2 | |||
| Turnout | 1,022 | 27.5 | |||
| Liberal Democrat hold | Swing | ||||
- Previous councillor Graham Eric Walker had defected from the Liberal Democrats to join the Independents in May 2012[37]
| Party | Candidate | Votes | % | ± | |
|---|---|---|---|---|---|
| Independent | Sandra Elizabeth Heyward | 475 | 53.3 | ||
| Conservative | Jenny Stewart | 290 | 32.5 | ||
| Labour | Ann Mary Phillips | 126 | 14.1 | ||
| Majority | 185 | 20.8 | |||
| Turnout | 891 | 26.1 | |||
| Independent gain from Conservative | Swing | ||||
| Party | Candidate | Votes | % | ± | |
|---|---|---|---|---|---|
| Liberal Democrat | Jackie Bull | 325 | 35.6 | ||
| Conservative | Adam William Harris | 232 | 25.4 | ||
| Mebyon Kernow | Derek Charles Collins | 187 | 20.5 | ||
| Labour Co-op | Andrea Hilary Lanxon | 168 | 18.4 | ||
| Majority | 93 | 10.2 | |||
| Turnout | 912 | 27.6 | |||
| Liberal Democrat gain from Conservative | Swing | ||||
| Party | Candidate | Votes | % | ± | |
|---|---|---|---|---|---|
| Liberal Democrat | Roy Taylor | 310 | 40.1 | ||
| Labour | Stuart David Wheeler | 186 | 24.1 | ||
| Independent | Liam John Bellamy | 172 | 22.3 | ||
| Conservative | Peter Sinclair | 105 | 13.6 | ||
| Majority | 124 | 16.0 | |||
| Turnout | 773 | 24.0 | |||
| Liberal Democrat hold | Swing | ||||
| Party | Candidate | Votes | % | ± | |
|---|---|---|---|---|---|
| Conservative | Bill Maddern | 608 | 40.5 | ||
| Independent | Norman Bliss | 429 | 28.5 | ||
| Labour | Juliet Eavis | 206 | 13.7 | ||
| Green | Peter Hardy | 150 | 10.0 | ||
| Liberal Democrat | Frank Blewett | 110 | 7.3 | ||
| Majority | 179 | 11.9 | |||
| Turnout | 1,503 | 40.9 | |||
| Conservative hold | Swing | ||||
| Party | Candidate | Votes | % | ± | |
|---|---|---|---|---|---|
| Liberal Democrat | Derris Rosslyn Watson | 463 | 32.2 | ||
| UKIP | David Garth Lucas | 348 | 24.2 | ||
| Independent | Len Clark | 341 | 23.7 | ||
| Conservative | Lisa Jane Sargeant | 288 | 20.0 | ||
| Majority | 115 | 8.0 | |||
| Turnout | 1,440 | 39.6 | |||
| Liberal Democrat hold | Swing | ||||
| Party | Candidate | Votes | % | ± | |
|---|---|---|---|---|---|
| Independent | Pat Harvey | 586 | 55.3 | ||
| Conservative | John Bell | 204 | 19.2 | ||
| Liberal Democrat | Alvin Augustus Martin | 193 | 18.2 | ||
| Labour | Debbie Hopkins | 77 | 7.3 | ||
| Majority | 382 | 36.0 | |||
| Turnout | 1,060 | 28.3 | |||
| Independent hold | Swing | ||||
| Party | Candidate | Votes | % | ± | |
|---|---|---|---|---|---|
| Independent | Fred Greenslade | 518 | 72.4 | ||
| Independent | Kim Wonnacott | 154 | 21.5 | ||
| Conservative | Barbara Hannan | 43 | 6.0 | ||
| Majority | 364 | 50.9 | |||
| Turnout | 715 | 21.0 | |||
| Independent hold | Swing | ||||
| Party | Candidate | Votes | % | ± | |
|---|---|---|---|---|---|
| Conservative | Jim Flashman | 477 | 36.2 | ||
| UKIP | Dave Lawson | 371 | 28.1 | ||
| Independent | Phillip Edward Lawrence Harriman | 193 | 14.6 | ||
| Mebyon Kernow | Maria Coakley | 139 | 10.5 | ||
| Liberal Democrat | Charles Andrew Merrett Jones | 138 | 10.5 | ||
| Majority | 106 | 8.0 | |||
| Turnout | 1,318 | 38.0 | |||
| Conservative hold | Swing | ||||
| Party | Candidate | Votes | % | ± | |
|---|---|---|---|---|---|
| Mebyon Kernow | Dick Cole | 834 | 86.9 | ||
| Independent | Elizabeth Hawken | 126 | 13.1 | ||
| Majority | 708 | 73.8 | |||
| Turnout | 960 | 27.0 | |||
| Mebyon Kernow hold | Swing | ||||
| Party | Candidate | Votes | % | ± | |
|---|---|---|---|---|---|
| Conservative | Daniel Richard Pugh | 425 | 31.5 | ||
| UKIP | Joseph Anthony Cummins | 384 | 28.4 | ||
| Liberal Democrat | Jesse Foot | 370 | 27.4 | ||
| Independent | Mervyn Richard Ellis | 171 | 12.7 | ||
| Majority | 41 | 3.0 | |||
| Turnout | 1,350 | 38.9 | |||
| Conservative hold | Swing | ||||
| Party | Candidate | Votes | % | ± | |
|---|---|---|---|---|---|
| Liberal Democrat | Jeremy Charles Rowe | 601 | 53.3 | ||
| Independent | Emma Karenza Hambly | 526 | 46.7 | ||
| Majority | 75 | 6.7 | |||
| Turnout | 1,127 | 32.9 | |||
| Liberal Democrat hold | Swing | ||||
| Party | Candidate | Votes | % | ± | |
|---|---|---|---|---|---|
| Green | Tim Andrewes | 471 | 37.3 | ||
| Conservative | Joan Symons | 339 | 26.8 | ||
| Independent | Morag Robertson | 182 | 14.4 | ||
| UKIP | Roy Britton | 170 | 13.5 | ||
| Labour | Terry Murray | 70 | 5.5 | ||
| Liberal Democrat | Madie Parkinson-Evans | 31 | 2.5 | ||
| Majority | 132 | 10.5 | |||
| Turnout | 1,263 | 41.2 | |||
| Green gain from Conservative | Swing | ||||
| Party | Candidate | Votes | % | ± | |
|---|---|---|---|---|---|
| Independent | Andrew Mitchell | 308 | 27.9 | ||
| Green | Ron Tulley | 301 | 27.3 | ||
| UKIP | Stuart Guppy | 194 | 17.6 | ||
| Conservative | Joan Tanner | 124 | 11.2 | ||
| Labour | Malcolm Hurst | 111 | 10.1 | ||
| Liberal Democrat | Lester Scott | 66 | 6.0 | ||
| Majority | 7 | 0.6 | |||
| Turnout | 1,104 | 34.1 | |||
| Independent gain from Conservative | Swing | ||||
| Party | Candidate | Votes | % | ± | |
|---|---|---|---|---|---|
| Liberal Democrat | Sue James | 574 | 36.6 | ||
| Independent | Kevin McFadden | 332 | 21.2 | ||
| UKIP | Adrian Smith | 304 | 19.4 | ||
| Labour | Kirsty Pritchard | 251 | 16.0 | ||
| Conservative | David Lenaghan | 106 | 6.8 | ||
| Majority | 242 | 15.4 | |||
| Turnout | 1,567 | 41.2 | |||
| Liberal Democrat gain from Independent | Swing | ||||
| Party | Candidate | Votes | % | ± | |
|---|---|---|---|---|---|
| Conservative | Walter Sanger | 631 | 40.5 | ||
| Green | Dominic Brandreth | 502 | 32.2 | ||
| UKIP | Brian Bailey | 355 | 22.8 | ||
| Labour | Ann Round | 69 | 4.4 | ||
| Majority | 129 | 8.3 | |||
| Turnout | 1,557 | 38.3 | |||
| Conservative gain from Independent | Swing | ||||
| Party | Candidate | Votes | % | ± | |
|---|---|---|---|---|---|
| Conservative | John Fitter | 588 | 76.1 | ||
| Mebyon Kernow | Rob Poole | 185 | 23.9 | ||
| Majority | 403 | 52.1 | |||
| Turnout | 773 | 28.3 | |||
| Conservative hold | Swing | ||||
| Party | Candidate | Votes | % | ± | |
|---|---|---|---|---|---|
| Independent | Malcolm Harvey Harris | 367 | 36.6 | ||
| Conservative | John Edward Charles Kneller | 323 | 32.2 | ||
| Liberal Democrat | Janet Hazel Lockyer | 312 | 31.1 | ||
| Majority | 44 | 4.4 | |||
| Turnout | 1,002 | 32.7 | |||
| Independent gain from Liberal Democrat | Swing | ||||
| Party | Candidate | Votes | % | ± | |
|---|---|---|---|---|---|
| Independent | Andy Penny | 455 | 42.1 | ||
| Conservative | Brian Allan Gisbourne | 439 | 40.6 | ||
| Liberal Democrat | Ed Headley-Hughes | 186 | 17.2 | ||
| Majority | 16 | 1.5 | |||
| Turnout | 1,080 | 42.0 | |||
| Independent gain from Conservative | Swing | ||||
| Party | Candidate | Votes | % | ± | |
|---|---|---|---|---|---|
| Independent | Des Curnow | 636 | 65.8 | ||
| UKIP | Keith Hickman | 331 | 34.2 | ||
| Majority | 305 | 31.5 | |||
| Turnout | 967 | 25.6 | |||
| Independent hold | Swing | ||||
| Party | Candidate | Votes | % | ± | |
|---|---|---|---|---|---|
| Independent | John Lugg | 628 | 51.5 | ||
| Liberal Democrat | Eddie Jones | 388 | 31.8 | ||
| Conservative | Henry Hine | 204 | 16.7 | ||
| Majority | 240 | 19.7 | |||
| Turnout | 1,220 | 37.7 | |||
| Independent hold | Swing | ||||
| Party | Candidate | Votes | % | ± | |
|---|---|---|---|---|---|
| Independent | Neil Hillson Burden | 810 | 62.0 | ||
| UKIP | Antonia Mary Damaris Willis | 272 | 20.8 | ||
| Conservative | John Phillips | 124 | 9.5 | ||
| Liberal Democrat | Wayne Gostling | 100 | 7.7 | ||
| Majority | 538 | 41.2 | |||
| Turnout | 1,306 | 42.6 | |||
| Independent hold | Swing | ||||
| Party | Candidate | Votes | % | ± | |
|---|---|---|---|---|---|
| Independent | Tim Deeble | 251 | 26.2 | ||
| Independent | John Humar | 207 | 21.6 | ||
| Conservative | Adam Desmonde | 182 | 19.0 | ||
| Liberal Democrat | Moyra Nolan | 149 | 15.6 | ||
| Labour | Phillip Fenton | 69 | 7.2 | ||
| Independent | Ken Hart | 64 | 6.7 | ||
| Independent | Chris Pascoe | 36 | 3.8 | ||
| Majority | 44 | 4.6 | |||
| Turnout | 958 | 29.8 | |||
| Independent gain from Liberal Democrat | Swing | ||||
| Party | Candidate | Votes | % | ± | |
|---|---|---|---|---|---|
| Liberal Democrat | Glenton Bruce Brown | 664 | 57.1 | ||
| UKIP | Susan Jane Bowen | 313 | 26.9 | ||
| Conservative | Paul William Charlesworth | 185 | 15.9 | ||
| Majority | 351 | 30.2 | |||
| Turnout | 1,162 | 36.1 | |||
| Liberal Democrat hold | Swing | ||||
| Party | Candidate | Votes | % | ± | |
|---|---|---|---|---|---|
| Liberal Democrat | Brian Hobbs | 466 | 45.2 | ||
| Conservative | John Crago | 300 | 29.1 | ||
| UKIP | Rob White | 265 | 25.7 | ||
| Majority | 166 | 16.1 | |||
| Turnout | 1,031 | 33.2 | |||
| Liberal Democrat hold | Swing | ||||
| Party | Candidate | Votes | % | ± | |
|---|---|---|---|---|---|
| Conservative | Mike Pearn | 649 | 83.3 | ||
| Liberal Democrat | Adam David Evan Killeya | 130 | 16.7 | ||
| Majority | 519 | 66.6 | |||
| Turnout | 779 | 24.9 | |||
| Conservative hold | Swing | ||||
| Party | Candidate | Votes | % | ± | |
|---|---|---|---|---|---|
| Liberal Democrat | Jim Candy | 695 | 43.4 | ||
| Conservative | Peter Hunt | 513 | 32.1 | ||
| UKIP | Anthony Hamilton Marris | 392 | 24.5 | ||
| Majority | 182 | 11.4 | |||
| Turnout | 1,600 | 41.8 | |||
| Liberal Democrat gain from Conservative | Swing | ||||
| Party | Candidate | Votes | % | ± | |
|---|---|---|---|---|---|
| Independent | Bert Biscoe | 680 | 52.6 | ||
| Conservative | Noel Krishnan | 226 | 17.5 | ||
| Green | Lindsay Southcombe | 135 | 10.4 | ||
| Liberal Democrat | Maurice Vella | 127 | 9.8 | ||
| Labour | Susan Street | 125 | 9.7 | ||
| Majority | 454 | 35.1 | |||
| Turnout | 1,293 | 30.9 | |||
| Independent hold | Swing | ||||
| Party | Candidate | Votes | % | ± | |
|---|---|---|---|---|---|
| Liberal Democrat | Rob Nolan | 702 | 52.9 | ||
| Conservative | Lorrie Eathorne-Gibbons | 315 | 23.8 | ||
| Mebyon Kernow | Lance Dyer | 113 | 8.5 | ||
| Labour | Pamela Atherton | 109 | 8.2 | ||
| Green | Howard Newlove | 87 | 6.6 | ||
| Majority | 387 | 29.2 | |||
| Turnout | 1,326 | 36.7 | |||
| Liberal Democrat hold | Swing | ||||
| Party | Candidate | Votes | % | ± | |
|---|---|---|---|---|---|
| Independent | Loic Rich | 461 | 40.9 | ||
| Liberal Democrat | Ros Cox | 217 | 19.3 | ||
| Conservative | Judy Cresswell | 182 | 16.2 | ||
| UKIP | James Minahan | 169 | 15.0 | ||
| Labour | Margaret George | 68 | 6.0 | ||
| Green | Godfrey Allen | 29 | 2.6 | ||
| Majority | 244 | 21.7 | |||
| Turnout | 1,126 | 31.1 | |||
| Independent gain from Liberal Democrat | Swing | ||||
| Party | Candidate | Votes | % | ± | |
|---|---|---|---|---|---|
| Conservative | Fiona Ferguson | 565 | 44.7 | ||
| Independent | Charlotte Mackenzie | 279 | 22.1 | ||
| UKIP | Michael Inglefield | 174 | 13.8 | ||
| Green | Steve Angove | 87 | 6.9 | ||
| Labour | Richard Lees | 84 | 6.7 | ||
| Liberal Democrat | Peter Congdon | 74 | 5.9 | ||
| Majority | 286 | 22.6 | |||
| Turnout | 1,263 | 33.7 | |||
| Conservative hold | Swing | ||||
| Party | Candidate | Votes | % | ± | |
|---|---|---|---|---|---|
| Independent | Collin William Brewer | 335 | 25.2 | ||
| Liberal Democrat | Steve Knightley | 331 | 24.9 | ||
| UKIP | Roderick Harrison | 208 | 15.6 | ||
| Labour | Adrian Darrell Jones | 161 | 12.1 | ||
| Conservative | Brian Aubone Bennetts | 150 | 11.3 | ||
| Independent | Sarah Hannah Maguire | 146 | 11.0 | ||
| Majority | 4 | 0.3 | |||
| Turnout | 1,331 | 42.0 | |||
| Independent hold | Swing | ||||
| Party | Candidate | Votes | % | ± | |
|---|---|---|---|---|---|
| Conservative | Scott Mann | 830 | 65.5 | ||
| Liberal Democrat | Elliot Anthony Osborne | 308 | 24.3 | ||
| Labour Co-op | John David Whitby | 129 | 10.2 | ||
| Majority | 522 | 41.2 | |||
| Turnout | 1,267 | 41.2 | |||
| Conservative hold | Swing | ||||
Electoral division changes
- ↑ Electoral division Bodmin St Leonard renamed from Bodmin Central[34]
- ↑ Electoral division Bodmin St Mary's renamed from Bodmin West[34]
- ↑ Electoral division Bodmin St Petroc renamed from Bodmin East[34]
- ↑ Electoral division Breage, Germoe and Sithney renamed from Breage[34]
- ↑ Electoral division Bude formed from Bude North and Stratton and Bude South [34]
- ↑ Electoral division Chacewater, Kenwyn and Baldhu renamed from Chacewater and Kenwyn[34]
- ↑ Electoral division Constantine, Mawnan and Budock renamed from Constantine[34]
- ↑ Electoral division Crowan and Wendron created from the addition of Crowan parish to Wendron[34]
- ↑ Electoral division Falmouth Arwenack renamed from Falmouth Gyllyngvase (Not to be confused with Falmouth Arwenack division from 2009)[34]
- ↑ Electoral division Falmouth Smithick renamed from Falmouth Arwenack[34]
- ↑ Electoral division Feock and Playing Place renamed from Feock and Kea[34]
- ↑ Electoral division Grenville and Stratton renamed from Bude North and Stratton[34]
- ↑ Electoral division Gunnislake and Calstock renamed from Gunnislake[34]
- ↑ Electoral division Helston South created from the majority of Helston Central[34]
- ↑ Electoral division Lanivet and Blisland renamed from Lanivet[34]
- ↑ Electoral division Launceston North and North Petherwin renamed from Launceston North[34]
- ↑ Electoral division Liskeard East renamed from Liskeard Central[34]
- ↑ Electoral division Liskeard West and Dobwalls renamed from Liskeard South and Dobwalls[34]
- ↑ Electoral division Looe West, Lansallos and Lanteglos renamed from Looe West and Lansallos after the addition of Lanteglos parish[34]
- ↑ Electoral division Lynher renamed from St Ive[34]
- ↑ Electoral division Mabe, Perranarworthal and St Gluvias renamed from Mabe[34]
- ↑ Electoral division Marazion and Perranuthoe renamed from Marazion[34]
- ↑ Electoral division Penwithick and Boscoppa renamed from Penwithick[34]
- ↑ Electoral division Porthleven and Helston West renamed from Porthleven and Helston South[34]
- ↑ Electoral division Probus, Tregony and Grampound renamed from Probus[34]
- ↑ Electoral division Rame Peninsular renamed from Rame[34]
- ↑ Electoral division Saltash East renamed from Saltash Pill[34]
- ↑ Electoral division Saltash North renamed from Saltash St Stephens*[34]
- ↑ Electoral division Saltash South renamed from Saltash Essa*[34]
- ↑ Electoral division Saltash West renamed from Saltash Burraton[34]
- ↑ Electoral division St Blazey renamed from St Blaise[34]
- ↑ Electoral division St Columb Major renamed from St Columb[34]
- ↑ Electoral division St Dennis and Nanpean renamed from St Dennis[34]
- ↑ Electoral division St Dominick, Harrowbarrow and Kelly Bray renamed from Kelly Bray[34]
- ↑ Electoral division St Germans and Landulph renamed from St Germans[34]
- ↑ Electoral division St Issey and St Tudy renamed from St Issey[34]
- ↑ Electoral division St Ives East renamed from St Ives North[34]
- ↑ Electoral division St Ives West renamed from St Ives South[34]
- ↑ Electoral division St Mawgan and Colan renamed from Colan and Mawgan [34]
- ↑ Electoral division St Minver and St Endellion renamed from St Endellion[34]
- ↑ Electoral division St Stephen-In-Brannel renamed from St Stephen[34]
- ↑ Electoral division St Teath and St Breward renamed from St Teath[34]
- ↑ Electoral division Truro Boscawen renamed from Truro Moresk (Not to be confused with Truro Boscawen division from 2009)[34]
- ↑ Electoral division Truro Redannick renamed from Truro Boscawen[34]
References
- ↑ "Unitary status agreed for council". BBC News Online. 5 December 2007. Retrieved 5 May 2013.
- ↑ "Election 09 LIVE BLOG". Thisiscornwall.com. Local World. 29 April 2011. Retrieved 6 May 2013.
- ↑ "Split vote sees Cornwall's Tory council leader clings on to position". Thisiscornwall.com. Local World. 5 June 2009. Retrieved 6 May 2013.
- ↑ "Cornwall Council election sees 480 candidates". BBC News Online. 9 April 2013. Retrieved 6 May 2013.
- ↑ Wallis, Andrew (16 April 2013). "Cornwall Council Candidates by political groups". Cllr Andrew Wallis' blog. Retrieved 6 May 2013.
- ↑ "List of candidates for Cornwall Council election released". Falmouth Packet. Newsquest Media. 5 April 2013. Retrieved 8 May 2013.
- ↑ "Cornwall Council and Parish and Town Council Elections 2013". Cornwall Council. Retrieved 10 May 2013.
- ↑ Meyjes, Toby (17 April 2013). "Election apathy leaves Cornwall parish and town councils struggling to fill seats". ThisisCornwall.com. Local World. Retrieved 10 May 2013.
- ↑ "Over to you fair Cornwall - it's time to get out and vote". Falmouth Packet. 1 May 2013. Retrieved 14 March 2014.
- 1 2 3 4 "Cornwall Council elections preview". ThisisCornwall.com. Local World. 2 May 2013. Retrieved 14 March 2014.
- ↑ "Lib Dems launch election campaign". ThisisCornwall.com. Local World. 21 March 2013. Retrieved 17 March 2014.
- ↑ "UKIP leader hopes for cluster of councillors". ThisisCornwall.com. Local World. 11 April 2013. Retrieved 14 March 2014.
- ↑ "'Second home subsidy' tops Labour's Cornwall campaign". ThisisCornwall.com. Local World. 27 March 2013. Retrieved 17 March 2014.
- ↑ "Help to Buy not for second homes, says George Osborne". BBC News Online. 23 July 2013. Retrieved 17 March 2014.
- ↑ "Labour's manifesto for council poll is launched". ThisisCornwall.com. Local World. 28 March 2013. Retrieved 17 March 2014.
- ↑ "Green Party leader meets Truro's mayor". ThisisCornwall.com. Local World. 7 March 2013. Retrieved 14 March 2014.
- ↑ "The Representation of the People (Form of Canvass) (England and Wales) Regulations 2006, Schedule Part 1". Legislation.gov.uk. 13 October 2011. Retrieved 18 April 2012.
- ↑ "I have two homes. Can I register at both addresses?". The Electoral Commission. Retrieved 5 January 2011.
- ↑ "Cornwall Council elections - Thursday, 2nd May, 2013". Cornwall Council. Retrieved 17 March 2014.
- ↑ "Cornwall Council elections - Thursday, 4th June, 2009". Cornwall Council. Retrieved 17 March 2014.
- ↑ "Results for Cornwall". Vote 2013. BBC News Online. Retrieved 25 March 2014.
- 1 2 "Jolt given to coalition's parties in Cornwall". ThisisCornwall.com. Local World. 9 May 2013. Retrieved 25 March 2014.
- ↑ "Cornwall's First Green Councillor Elected". West Cornwall Green Party. 3 May 2013. Retrieved 25 March 2014.
- ↑ "Tory quits and makes Cornwall independents and Lib Dems equal". BBC News Online. 14 May 2013. Retrieved 26 April 2014.
- ↑ "Top conservative Mike Eathorne-Gibbons jumps ship to Independent group in shock Cornwall Council defection". West Briton. Local World. 13 May 2013. Retrieved 26 April 2014.
- ↑ "Lib Dems call for cross-group Cornwall Council administration". BBC News Online. 9 May 2013. Retrieved 26 April 2014.
- ↑ "Cornwall independents and Lib Dems 'to form coalition'". BBC News Online. 17 May 2013. Retrieved 26 April 2014.
- ↑ "John Pollard appointed leader of Cornwall Council". BBC News Online. 21 May 2013. Retrieved 26 April 2014.
- ↑ "Councillors by Party". Cornwall Council. Retrieved 26 April 2014.
- ↑ Wood, Jo (5 April 2013). "Disabled children "should be put down" ex-councillor Collin Brewer will stand for May elections". West Briton. Local World. Retrieved 26 April 2014.
- ↑ "Lib Dems take former Collin Brewer seat in Wadebridge East". BBC News Online. 6 September 2013. Retrieved 26 April 2014.
- ↑ "Cornwall Council elections - Thursday, 2nd May, 2013". Election results by electoral divisions. Cornwall Council. Retrieved 30 December 2013.
- ↑ "Cornwall Council elections - Thursday, 4th June, 2009". Election results by electoral divisions. Cornwall Council. Retrieved 30 December 2013.
- 1 2 3 4 5 6 7 8 9 10 11 12 13 14 15 16 17 18 19 20 21 22 23 24 25 26 27 28 29 30 31 32 33 34 35 36 37 38 39 40 41 42 43 44 "Future electoral arrangements for Cornwall Council" (pdf). Boundary Committee for England. December 2009. Retrieved 30 December 2013.
- ↑ Smith, Graham (17 June 2011). "Jan Powell quits Tories and joins Lib Dems". bbc.co.uk. Retrieved 26 January 2014.
- ↑ "Cornwall Council cabinet member Armand Toms quits Conservatives". BBC News Online. 14 March 2013. Retrieved 26 January 2014.
- ↑ "A highly respected Lib Dem Cllr has left the party in 'disillusion' at the Con/Dem coalition's education policies.". Cornwall Community News. 16 May 2012. Retrieved 13 January 2014.
External links
| Cornwall Council | |
|---|---|
| Council of the Isles of Scilly | |
| Caradon District Council |
|
| Carrick District Council |
|
| Kerrier District Council |
|
| North Cornwall District Council |
|
| Penwith District Council | |
| Restormel Borough Council | |
| |