List of sovereign states and dependent territories by immigrant population
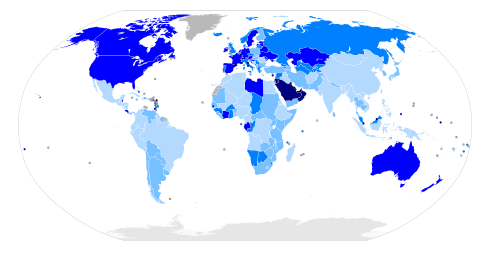
| More than 50% | 20% to 50% | 10% to 20% | 4% to 10% | 1% to 4% | Less than 1% | No data |
This is a list of countries by immigrant population. Foreign-born population is not the same as immigrant population, as there are births of citizens abroad who work or travel overseas, as well as non-immigrants who reside in a country temporarily for work or other reasons.
As of 2013, the United States has the largest population of migrants of any country. China has the world's lowest population of migrants as a percentage of its population.
2015 report
This is a list of countries by immigrant population, based on the United Nations Department of Economic and Social Affairs report Trends in International Migrant Stock: The 2015 Revision.[1]
| Country | Immigrants | Notes | ||
|---|---|---|---|---|
| Total | Of world (%) | Of national (%) | ||
| | 19.8 | 14.3 | The Migration Policy Institute reported that in 2014, some 17.5 million children (age 18 and younger) in the U.S. lived with at least one immigrant parent. Of these, the majority (88%) were second-generation (i.e., children born in the U.S. to at least one foreign-born parent).[2] Collectively, "[i]mmigrants in the United States and their U.S.-born children now number approximately 81 million people, or 26 percent of the overall U.S. population."[2] | |
| | 4.9 | 14.9 | ||
| | 4.8 | 7.7 | Includes immigrants who expatriated to foreign countries and subsequently returned. | |
| | 9,060,433 | 3.9 | 31.4 | |
| | 3 | 11.3 | ||
| | 7,826,981 | 3.4 | 83.7 | |
| | 3.1 | 11.1 | ||
| | 7,284,069 | 3.1 | 20.7 | |
| | 2.8 | 27.7 | ||
| | 2.8 | 14 | ||
| | 2 | 8 | ||
| | 5,338,486 | 2.3 | 0.4 | |
| | 2.2 | 11.4 | ||
| | 2.1 | 5.81 | Refugees currently residing in the Turkish Republic are considered 'guests' and therefore count towards the immigrant population of the Republic. News outlets and governmental bodies have all taken to the use of the word 'migrant' rather than 'refugee'. | |
| | 4,080,766 | 1.8 | 2.2 | |
| | 3,721,735 | 1.6 | 5.6 | |
| | 3,476,233 | 1.5 | 21.1 | |
| | 3,276,880 | 1.1 | 10.88 | |
| | 2,925,780 | 1.3 | 40.2 | |
| | 2,920,000 | 1.3 | 70 | |
| | 2,804,753 | 1.2 | 38.9 | |
| | 2,649,516 | 1.1 | 3.4 | |
| | 2,446,171 | 1.1 | 12.0 | |
| | 1.0 | 28.9 | ||
| | 2,437,169 | 1.1 | 1.9 | |
| | 2,399,238 | 1.0 | 4.6 | |
| | 2,323,252 | 1.0 | 42.9 | |
| | 2,046,873 | 0.9 | 26.5 | |
| | 0.8 | 11.1 | ||
| | 1,885,678 | 0.8 | 4.6 | |
| | 1,847,274 | 0.8 | 0.9 | |
| | 0.7 | 14.3 | ||
| | 1,600,955 | 0.7 | 73.8 | |
| | 0.6 | 15.2 | ||
| | 1,396,514 | 0.6 | 0.9 | |
| | 1,394,227 | 0.6 | 6.4 | |
| | 0.6 | 12.9 | ||
| | 1,266,278 | 0.6 | 4.4 | |
| | 0.6 | 11.1 | ||
| | 1,233,592 | 0.5 | 0.7 | |
| | 1,230,000 | 0.5 | 2.9 | |
| | 1,171,331 | 0.5 | 3.9 | |
| | 0.5 | 25.1 | ||
| | 1,112,032 | 0.5 | 30.6 | |
| | 1,103,460 | 0.5 | 0.9 | |
| | 0.5 | 11.6 | ||
| | 971,247 | 0.4 | 3.5 | |
| | 955,452 | 0.4 | 2.2 | |
| | 848,511 | 0.4 | 0.1 | |
| | 0.3 | 7.5 | ||
| | 0.3 | 5.6 | ||
| | 755,974 | 0.3 | 12.2 | |
| | 0.3 | 15.9 | ||
| | 0.3 | 13.8 | ||
| | 729,357 | 0.3 | 54.7 | |
| | 718,241 | 0.3 | 0.8 | |
| | 696,983 | 0.3 | 4.1 | |
| | 629,577 | 0.3 | 5.6 | |
| | 0.3 | 0.9 | ||
| | 0.3 | 17.6 | ||
| | 0.3 | 9 | ||
| | 531,401 | 0.3 | 1.4 | |
| | 469,400 | 0.2 | 2.2 | |
| | 452,406 | 0.2 | 3.8 | |
| | 0.3 | 4.7 | ||
| | 446,924 | 0.2 | 0.7 | |
| | 446,707 | 0.2 | 1.2 | |
| | 431,470 | 0.2 | 9.7 | |
| | 419,572 | 0.2 | 8.7 | |
| | 0.2 | 3.9 | ||
| | 0.2 | 4.0 | ||
| | 394,953 | 0.2 | 23.6 | |
| | 378,464 | 0.2 | 3.2 | |
| | 360,992 | 0.2 | 2.6 | |
| | 359,315 | 0.2 | 2.2 | |
| | 358,829 | 0.2 | 1.4 | |
| | 333,269 | 0.2 | 58.8 | |
| | 331,251 | 0.2 | 3.4 | |
| | 324,977 | 0.2 | 1.5 | |
| | 323,843 | 0.2 | 3.4 | |
| | 317,001 | 0.2 | 10.6 | |
| | 0.2 | 5.4 | ||
| | 314,683 | 0.2 | 1.3 | |
| | 312,778 | 0.2 | 0.6 | |
| | 297,448 | 0.2 | 0.4 | |
| | 295,433 | 0.2 | 0.1 | |
| | 291,792 | 0.2 | 1.3 | |
| | 275,735 | 0.2 | 3.4 | |
| | 270,407 | 0.2 | 0.7 | |
| | 0.2 | 13.8 | ||
| | 256,517 | 0.2 | 5.9 | |
| | 254,477 | 0.2 | 2.5 | |
| | 0.1 | 43.3 | ||
| | 0.2 | 11.3 | ||
| | 234,241 | 0.2 | 2.3 | |
| | 226,960 | 0.1 | 4.6 | |
| | 0.1 | 0.9 | ||
| | 226,327 | 0.1 | 4.3 | |
| | 225,484 | 0.1 | 5.3 | |
| | 218,881 | 0.1 | 0.8 | |
| | 213,150 | 0.1 | 0.3 | |
| | 209,398 | 0.1 | 1.5 | |
| | 207,313 | 0.1 | 18.2 | |
| | 206,578 | 0.1 | 1.3 | |
| | 206,173 | 0.1 | 49.3 | |
| | 202,476 | 0.1 | 3.0 | |
| | 0.1 | 16.4 | ||
| | 195,553 | 0.1 | 1.3 | |
| | 189,893 | 0.1 | 4.4 | |
| | 185,776 | 0.1 | 2.8 | |
| | 0.1 | 3.3 | ||
| | 162,919 | 0.1 | 8.8 | |
| | 158,417 | 0.1 | 3.8 | |
| | 154,330 | 0.1 | 1.4 | |
| | 146,456 | 0.1 | 7.2 | |
| | 0.2 | 11.2 | ||
| | 136,493 | 0.1 | 15.6 | |
| | 0.1 | 4.9 | ||
| | 134,237 | 0.1 | 2.9 | |
| | 132,294 | 0.1 | 0.7 | |
| | 0.1 | 6.6 | ||
| | 129,632 | 0.1 | 0.3 | |
| | 123,537 | 0.1 | 14.2 | |
| | 105,090 | 0.1 | 0.3 | |
| | 104,919 | 0.1 | 0.3 | |
| | 104,291 | 0.1 | 43.3 | |
| | 103,117 | 0.1 | 0.2 | |
| | 0.1 | 1.2 | ||
| | 98,907 | 0.1 | 0.7 | |
| | 0.1 | 20.8 | ||
| | 96,368 | 0.1 | 1.6 | |
| | 95,780 | 0.1 | 0.3 | |
| | 90,206 | 0.1 | 2.3 | |
| | 87,436 | 0.1 | 0.4 | |
| | 84,230 | 0.1 | 24.4 | |
| | 0.1 | 51.0 | ||
| | 0.1 | 49.6 | ||
| | 75,556 | 0.1 | 0.5 | |
| | 73,528 | 0.1 | 2.3 | |
| | 73,107 | 0.2 | 32.9 | |
| | 72,764 | 0.1 | 0.5 | |
| | 68,290 | 0.1 | 0.1 | |
| | 63,271 | 0.1 | 59.3 | |
| | 0.1 | 24.8 | ||
| | 0.1 | 16.3 | ||
| | 0.1 | 15.0 | ||
| | 0.1 | 3.1 | ||
| | 51,448 | 0.1 | 2.2 | |
| | 50,862 | 0.1 | 6.7 | |
| | 50,860 | 0.1 | 15.0 | |
| | 50,771 | 0.1 | 0.2 | |
| | 0.1 | 8.2 | ||
| | 46,813 | 0.1 | 0.2 | |
| | 0.1 | 56.9 | ||
| | 44,997 | 0.1 | 3.6 | |
| | 0.1 | 52.0 | ||
| | 41,670 | 0.1 | 7.5 | |
| | 41,615 | 0.1 | 0.6 | |
| | 41,482 | 0.1 | 0.7 | |
| | 0.1 | 71.2 | ||
| | 0.1 | 0.4 | ||
| | 0.1 | 23.2 | ||
| | 36,526 | 0.1 | 0.3 | |
| | 0.1 | 34.9 | ||
| | 0.1 | 1.3 | ||
| | 0.1 | 12.8 | ||
| | 0.1 | 10.7 | ||
| | 32,488 | 0.1 | 2.4 | |
| | 0.1 | 8.0 | ||
| | 34,313 | 0.1 | 0.1 | |
| | 0.1 | 11.3 | ||
| | 0.1 | 31.9 | ||
| | 27,503 | 0.1 | 0.4 | |
| | 27,021 | 0.1 | 59.7 | |
| | 25,524 | 0.1 | 2.0 | |
| | 0.1 | 0.4 | ||
| | 24,593 | 0.1 | 0.2 | |
| | 0.1 | 64.2 | ||
| | 0.1 | 49.9 | ||
| | 0.1 | 0.6 | ||
| | 0.1 | 2.5 | ||
| | 21,801 | 0.1 | 0.3 | |
| | 19,066 | 0.1 | 29.1 | |
| | 18,024 | 0.1 | 1.1 | |
| | 17,225 | 0.1 | 0.6 | |
| | 0.1 | 0.1 | ||
| | 15,798 | 0.1 | 0.2 | |
| | 14,874 | 0.1 | 3.0 | |
| | 14,770 | 0.1 | 1.7 | |
| | 12,613 | 0.1 | 65.9 | |
| | 12,511 | 0.1 | 1.7 | |
| | 0.1 | 33.1 | ||
| | 12,180 | 0.1 | 6.7 | |
| | 12,079 | 0.1 | 13.0 | |
| | 11,565 | 0.1 | 1.0 | |
| | 0.1 | 10.7 | ||
| | 11,356 | 0.1 | 24.8 | |
| | 10,260 | 0.1 | 9.4 | |
| | 10,141 | 0.1 | 1.3 | |
| | 0.1 | 33.0 | ||
| | 0.1 | 32.3 | ||
| | 0.1 | 1.4 | ||
| | 0.1 | 45.6 | ||
| | 0.1 | 8.9 | ||
| | 6,345 | 0.1 | 3.3 | |
| | 0.1 | 10.4 | ||
| | 5,673 | 0.1 | 10.5 | |
| | 0.1 | 3.0 | ||
| | 0.1 | 27.8 | ||
| | 0.1 | 4.8 | ||
| | 4,932 | 0.1 | 0.9 | |
| | 0.1 | 15.4 | ||
| | 0.1 | 7.4 | ||
| | 0.1 | 15.4 | ||
| | 0.1 | 1.3 | ||
| | 3,095 | 0.1 | 0.1 | |
| | 0.1 | 20.5 | ||
| | 0.1 | 2.6 | ||
| | 0.1 | 2.6 | ||
| | 0.1 | 21.1 | ||
| | 1,975 | 0.1 | 62.1 | |
| | 0.1 | 3.2 | ||
| | 0.1 | 25.9 | ||
| | 972 | 0.1 | 17.1 | |
| | 0.1 | 100.0 | ||
| | 590 | 0.1 | 14.3 | |
| | 0.1 | 37.1 | ||
| | 0.1 | 25.4 | ||
| | 0.1 | 1.6 | ||
2005 report
This is a list of countries by immigrant population, based on the United Nations report World Population Policies 2005.[3] [4] The total immigrant population was estimated to be 186,579,300. UN member and observer states are ranked.
| Rank | Country | Immigrants | Notes | ||
|---|---|---|---|---|---|
| Total | Of world (%) | Of national (%) | |||
| 1 | | 38,355,000 | 20.56 | 12.81 | 2009: 38.5 million foreign-born residents, 12.5% of the total population.[5] |
| 2 | | 12,080,000 | 6.474 | 8.483 | |
| 3 | | 10,144,000 | 5.437 | 12.31 | 2011: 10.7 million foreign-born residents[6] |
| 4 | | 6,833,000 | 3.662 | 14.7 | |
| 5 | | 6,471,000 | 3.468 | 10.18 | |
| 6 | | 6,361,000 | 3.409 | 25.25 | |
| 7 | | 6,200,000 | 3.272 | 18.76 | |
| 8 | | 5,700,000 | 3.055 | 0.517 | |
| 9 | | 5,408,000 | 2.898 | 8.982 | |
| 10 | | 4,790,000 | 2.567 | 10.79 | 5.6 million (2009) [7] |
| 11 | | 4,097,000 | 2.196 | 19.93 | Other sources give higher estimates.[8] |
| 12 | | 3,852,000 | 2.064 | 0.2944 | does not include Hong Kong (SAR) and Macau (SAR) |
| 13 | | 3,254,000 | 1.744 | 1.984 | |
| 14 | | 3,212,000 | 1.722 | 71.4 | |
| | 2,999,000 | 1.607 | 42.59 | According to the 2006 By-Census, 60.3% of the population was born in Hong Kong, 33.5% in other parts of China, and 6.2% elsewhere.[9] | |
| 15 | | 2,661,000 | 1.426 | 37.87 | |
| 16 | | 2,519,000 | 1.35 | 4.288 | The number of immigrants has risen steeply since the publication of the UN report.[10] According to a 2010 report, the number is now close to 4.3 million.[11] |
| 17 | | 2,502,000 | 1.341 | 16.88 | |
| 18 | | 2,371,000 | 1.271 | 13.06 | |
| 19 | | 2,225,000 | 1.193 | 39.01 | Note the UN definition of Palestine refugees.[12] |
| 20 | | 2,048,000 | 1.098 | 1.599 | |
| 21 | | 1,959,000 | 1.05 | 2.861 | |
| 22 | | 1,843,000 | 0.9878 | 42.6 | |
| | 1,680,000 | 0.9004 | 45.38 | Note the UN definition of Palestine refugees.[12] | |
| 23 | | 1,669,000 | 0.8945 | 7.548 | |
| 24 | | 1,669,000 | 0.8945 | 62.11 | |
| 25 | | 1,660,000 | 0.8897 | 22.89 | |
| 26 | | 1,636,112 | 0.8784 | 6.4 | |
| 27 | | 1,638,000 | 0.8779 | 10.05 | |
| 28 | | 1,500,000 | 0.8039 | 3.871 | |
| 29 | | 1,328,000 | 0.7118 | 1.814 | |
| 30 | | 1,268,000 | 0.6796 | 4.768 | |
| 31 | | 1,234,000 | 0.6614 | 14.9 | |
| 32 | | 1,191,000 | 0.6383 | 12.21 | |
| 33 | | 1,117,000 | 0.5987 | 12.3 | |
| 34 | | 1,106,000 | 0.5928 | 2.332 | The real figure may be much higher.[13][14][15] The 2011 Census placed the figure at 4.4%,[16] and that may be an underestimate due to xenophobia. |
| 35 | | 1,050,000 | 0.5628 | 1.635 | |
| 36 | | 1,032,000 | 0.5531 | 0.7277 | |
| 37 | | 1,010,000 | 0.5413 | 3.776 | |
| 38 | | 985,000 | 0.5279 | 5.173 | Note the UN definition of Palestine refugees.[12] |
| 39 | | 974,000 | 0.522 | 8.662 | |
| 40 | | 971,000 | 0.5204 | 0.7382 | |
| 41 | | 819,000 | < 0.5 | 3.018 | |
| 42 | | 792,000 | < 0.5 | 2.066 | |
| 43 | | 773,000 | < 0.5 | 5.844 | |
| 44 | | 764,000 | < 0.5 | 7.204 | |
| 45 | | 719,000 | < 0.5 | 6.901 | |
| 46 | | 703,000 | < 0.5 | 1.843 | |
| 47 | | 661,000 | < 0.5 | 14.52 | |
| 48 | | 1,657,000 | < 0.5 | 27.58 | 1.1 million Syrian refugees; Note the UN definition of Palestine refugees.[12] |
| 49 | | 644,000 | < 0.5 | 0.6017 | |
| 50 | | 642,000 | < 0.5 | 15.48 | |
| 51 | | 641,000 | < 0.5 | 0.3439 | |
| 52 | | 639,000 | < 0.5 | 1.727 | |
| 53 | | 637,000 | < 0.5 | 75.9 | |
| 54 | | 628,000 | < 0.5 | 24.46 | |
| 55 | | 618,000 | < 0.5 | 10.56 | |
| 56 | | 585,000 | < 0.5 | 13.81 | |
| 57 | | 555,000 | < 0.5 | 0.7393 | |
| 58 | | 551,000 | < 0.5 | 1.152 | Over 1.5 million foreign residents as of June 2013.[17] |
| 59 | | 539,000 | < 0.5 | 0.9086 | |
| 60 | | 518,000 | < 0.5 | 1.876 | |
| 61 | | 512,000 | < 0.5 | 4.726 | The UN report was produced before Montenegro declared independence from Serbia on June 3, 2006. 822,308 foreign-born according to the 2011 Serbian Census.[18] |
| 62 | | 511,000 | < 0.5 | 3.928 | |
| 63 | | 453,000 | < 0.5 | 4.413 | |
| 64 | | 449,000 | < 0.5 | 19.46 | Note the special case of Latvian non-citizens |
| 65 | | 441,000 | < 0.5 | 10.19 | |
| 66 | | 440,000 | < 0.5 | 12.96 | |
| 67 | | 437,000 | < 0.5 | 4.483 | |
| 68 | | 406,000 | < 0.5 | 2.051 | |
| 69 | | 406,000 | < 0.5 | 4.318 | |
| 70 | | 389,000 | < 0.5 | 7.163 | |
| 71 | | 374,000 | < 0.5 | 0.4503 | |
| 72 | | 368,000 | < 0.5 | 1.774 | |
| 73 | | 345,000 | < 0.5 | 1.007 | |
| 74 | | 655,000 | < 0.5 | 13.1 | Updated feb. 2013 |
| 75 | | 326,000 | < 0.5 | 2.796 | |
| 76 | | 316,000 | < 0.5 | 3.136 | |
| 77 | | 306,000 | < 0.5 | 4.703 | |
| 78 | | 304,000 | < 0.5 | 2.16 | |
| 79 | | 295,000 | < 0.5 | 42.22 | |
| 80 | | 288,000 | < 0.5 | 7.202 | |
| 81 | | 288,000 | < 0.5 | 5.471 | |
| 82 | | 282,000 | < 0.5 | 3.427 | |
| 83 | | 279,000 | < 0.5 | 2.165 | |
| 84 | | 275,000 | < 0.5 | 2.357 | |
| 85 | | 265,000 | < 0.5 | 1.263 | |
| | 257,000 | < 0.5 | 51.09 | According to the 2006 By-Census, 42.5% of the population was born in Macau, 51% in other parts of China, and 6.5% elsewhere.[19] | |
| 86 | | 245,000 | < 0.5 | 17.7 | |
| 87 | | 242,000 | < 0.5 | 0.7366 | |
| 88 | | 235,000 | < 0.5 | 7.308 | |
| 89 | | 232,000 | < 0.5 | 15.29 | |
| 90 | | 231,000 | < 0.5 | 1.406 | |
| 91 | | 224,000 | < 0.5 | 4.634 | |
| 92 | | 202,000 | < 0.5 | 15.19 | |
| 93 | | 191,000 | < 0.1 | 4.269 | |
| 94 | | 183,000 | < 0.1 | 2.978 | |
| 95 | | 182,000 | < 0.1 | 2.164 | |
| 96 | | 175,000 | < 0.1 | 2.074 | |
| 97 | | 174,000 | < 0.1 | 37.42 | |
| 98 | | 168,000 | < 0.1 | 2.728 | |
| 99 | | 167,000 | < 0.1 | 8.332 | |
| 100 | | 166,000 | < 0.1 | 0.2242 | |
| 101 | | 165,000 | < 0.1 | 4.809 | |
| 102 | | 160,000 | < 0.1 | 0.0718 | |
| 103 | | 156,000 | < 0.1 | 2.962 | |
| 104 | | 156,000 | < 0.1 | 1.754 | |
| 105 | | 143,000 | < 0.1 | 7.041 | |
| 106 | | 137,000 | < 0.1 | 0.8394 | |
| 107 | | 133,000 | < 0.1 | 0.596 | |
| 108 | | 132,000 | < 0.1 | 0.4193 | |
| 109 | | 124,000 | < 0.1 | 33.16 | |
| 110 | | 124,000 | < 0.1 | 2.296 | |
| 111 | | 124,000 | < 0.1 | 0.8884 | |
| 112 | | 123,000 | < 0.1 | 0.2697 | |
| 113 | | 121,000 | < 0.1 | 1.339 | |
| 114 | | 121,000 | < 0.1 | 5.949 | |
| 115 | | 119,000 | < 0.1 | 2.154 | |
| 116 | | 117,000 | < 0.1 | 0.2316 | |
| 117 | | 116,000 | < 0.1 | 13.89 | |
| 118 | | 116,000 | < 0.1 | 1.263 | |
| 119 | | 114,000 | < 0.1 | 0.8618 | |
| 120 | | 104,000 | < 0.1 | 1.346 | |
| 121 | | 102,000 | < 0.1 | 3.156 | |
| 122 | | 100,000 | < 0.1 | 1.325 | |
| 123 | | 84,000 | < 0.1 | 2.426 | |
| 124 | | 83,000 | < 0.1 | 2.317 | |
| 125 | | 80,000 | < 0.1 | 4.533 | |
| 126 | | 76,000 | < 0.1 | 1.882 | |
| 127 | | 74,000 | < 0.1 | 0.6501 | |
| 128 | | 67,000 | < 0.1 | 8.396 | |
| 129 | | 66,000 | < 0.1 | 2.151 | |
| 130 | | 63,000 | < 0.1 | 0.3386 | |
| 131 | | 56,000 | < 0.1 | 0.3513 | |
| 132 | | 53,000 | < 0.1 | 0.4141 | |
| 133 | | 52,000 | < 0.1 | 77.25 | |
| 134 | | 50,000 | < 0.1 | 1.523 | |
| 135 | | 46,000 | < 0.1 | 0.3403 | |
| 136 | | 45,000 | < 0.1 | 4.36 | |
| 137 | | 43,000 | < 0.1 | 0.144 | |
| 138 | | 42,000 | < 0.1 | 0.1502 | |
| 139 | | 41,000 | < 0.1 | 15.19 | |
| 140 | | 41,000 | < 0.1 | 0.9113 | |
| 141 | | 38,000 | < 0.1 | 0.3762 | |
| 142 | | 38,000 | < 0.1 | 2.912 | |
| 143 | | 37,000 | < 0.1 | 0.16 | |
| 144 | | 32,000 | < 0.1 | 9.907 | |
| 145 | | 30,000 | < 0.1 | 0.3518 | |
| 146 | | 28,000 | < 0.1 | 0.5103 | |
| 147 | | 28,000 | < 0.1 | 0.0972 | |
| 148 | | 26,000 | < 0.1 | 9.311 | |
| 149 | | 26,000 | < 0.1 | 0.3609 | |
| 150 | | 25,000 | < 0.1 | 70.11 | |
| 151 | | 25,000 | < 0.1 | 0.422 | |
| 152 | | 25,000 | < 0.1 | 0.4247 | |
| 153 | | 24,000 | < 0.1 | 0.3429 | |
| 154 | | 23,000 | < 0.1 | 7.667 | |
| 155 | | 21,000 | < 0.1 | 1.687 | |
| 156 | | 21,000 | < 0.1 | 0.0249 | |
| 157 | | 20,000 | < 0.1 | 2.522 | |
| 158 | | 19,000 | < 0.01 | 1.198 | |
| 159 | | 18,000 | < 0.01 | 22.09 | |
| 160 | | 18,000 | < 0.01 | 0.679 | |
| 161 | | 17,000 | < 0.01 | 2.005 | |
| 162 | | 15,000 | < 0.01 | 0.3408 | |
| 163 | | 12,000 | < 0.01 | 35.31 | |
| 164 | | 11,000 | < 0.01 | 10.68 | |
| 165 | | 11,000 | < 0.01 | 2.723 | |
| 166 | | 11,000 | < 0.01 | 2.17 | |
| 167 | | 10,000 | < 0.01 | 8.403 | |
| 168 | | 10,000 | < 0.01 | 0.448 | |
| 169 | | 9,000 | < 0.01 | 5.6 | |
| 170 | | 9,000 | < 0.01 | 4.865 | |
| 171 | | 9,000 | < 0.01 | 0.3401 | |
| 172 | | 9,000 | < 0.01 | 32.01 | |
| 173 | | 7,000 | < 0.01 | 4.459 | |
| 174 | | 6,000 | < 0.01 | 1.19 | |
| 175 | | 6,000 | < 0.01 | 0.334 | |
| 176 | | 6,000 | < 0.01 | 0.6336 | |
| 177 | | 5,000 | < 0.01 | 7.257 | |
| 178 | | 5,000 | < 0.01 | 38.45 | |
| 179 | | 5,000 | < 0.01 | 6.199 | |
| 180 | | 5,000 | < 0.01 | 1.114 | |
| 181 | | 4,000 | < 0.01 | 3.687 | |
| 182 | | 4,000 | < 0.01 | 9.369 | |
| 183 | | 3,000 | < 0.01 | 15.04 | |
| 184 | | 3,000 | < 0.01 | 3.02 | |
| 185 | | 3,000 | < 0.01 | 16.04 | Self-governing state in free association with New Zealand |
| 186 | | 3,000 | < 0.01 | 0.9119 | |
| 187 | | 3,000 | < 0.01 | 0.6276 | |
| 188 | | 2,000 | < 0.01 | 3.228 | |
| 189 | | 1,000 | < 0.01 | 100 | Due to the unique nature of the Vatican state, there are no natural citizens |
| 190 | | 1,000 | < 0.01 | 0.9804 | |
| 191 | | 1,000 | < 0.01 | 0.4739 | |
| 192 | | 1,000 | < 0.01 | 0.1332 | |
| 193 | | 300 | < 0.01 | 2.873 | |
| 194 | | 100 | < 0.01 | 4.617 | Self-governing state in free association with New Zealand |
![]() Western Sahara did not supply data. Western Sahara is a disputed territory in North Africa, mostly administered by Morocco, and claimed by both Morocco and the Sahrawi Arab Democratic Republic. Immigration to the Moroccan-administered region is primarily from other Moroccan regions. The area administered by the Sahrawi Arab Democratic Republic is sparsely populated.)
Western Sahara did not supply data. Western Sahara is a disputed territory in North Africa, mostly administered by Morocco, and claimed by both Morocco and the Sahrawi Arab Democratic Republic. Immigration to the Moroccan-administered region is primarily from other Moroccan regions. The area administered by the Sahrawi Arab Democratic Republic is sparsely populated.)
By country of origin, 2015 report
This is a list of countries by emigrant population, based on the UN report International Migrant Stock: The 2015 Revision.[20]
| Country | Emigrants | Notes | |
|---|---|---|---|
| Total | Of nation[21] | ||
| | 4,843,117 | 12.96% | |
| | 1,122,910 | 27.94% | |
| | 2,035 | 3.58% | |
| | 1,763,771 | 4.26% | |
| | 7,571 | 8.13% | |
| | 555,403 | 2.14% | |
| | 2,406 | 15.03% | |
| | 65,489 | 44.46% | |
| | 940,273 | 2.12% | |
| | 937,299 | 23.70% | |
| | 16,724 | 13.92% | |
| | 575,828 | 6.31% | |
| | 526,579 | 2.15% | |
| | 1,146,769 | 10.52% | |
| | 40,095 | 9.35% | |
| | 55,964 | 4.00% | |
| | 7,205,410 | 4.28% | |
| | 98,464 | 26.16% | |
| | 1,485,323 | 13.53% | |
| | 530,990 | 4.48% | |
| | 59,884 | 14.29% | |
| | 615,852 | 5.36% | |
| | 17,046 | 20.97% | |
| | 44,190 | 5.40% | |
| | 799,605 | 6.94% | |
| | 1,650,772 | 30.23% | |
| | 58,346 | 2.51% | |
| | 1,544,024 | 0.73% | |
| | 4,624 | 14.16% | |
| | 46,237 | 9.85% | |
| | 1,176,390 | 14.13% | |
| | 1,453,378 | 7.43% | |
| | 284,187 | 2.48% | |
| | 165,732 | 24.00% | |
| | 1,187,142 | 7.08% | |
| | 328,604 | 1.39% | |
| | 1,286,176 | 3.45% | |
| | 8,920 | 29.68% | |
| | 1,569 | 2.69% | |
| | 440,745 | 8.17% | |
| | 20,335 | 11.04% | |
| | 208,335 | 1.43% | |
| | 612,409 | 3.30% | |
| | 9,546,065 | 0.69% | |
| | 4,738,852 | 9.19% | [22] |
| | 116,516 | 12.74% | |
| | 220,501 | 4.56% | |
| | 21,505 | 58.95% | |
| | 133,185 | 2.70% | |
| | 865,147 | 16.95% | |
| | 1,426,380 | 11.13% | |
| | 69,893 | 31.10% | |
| | 177,185 | 13.20% | |
| | 932,582 | 8.13% | |
| | 1,403,757 | 1.68% | |
| | 250,675 | 4.23% | |
| | 15,927 | 1.76% | |
| | 69,817 | 49.11% | |
| | 1,304,493 | 10.96% | |
| | 1,101,923 | 6.93% | |
| | 3,268,970 | 3.43% | |
| | 1,436,158 | 18.99% | |
| | 81,029 | 8.75% | |
| | 499,916 | 8.68% | |
| | 198,042 | 13.11% | |
| | 753,492 | 0.74% | |
| | 14,284 | 22.32% | |
| | 1,124 | 27.71% | |
| | 204,934 | 18.65% | |
| | 295,077 | 5.09% | |
| | 2,145,975 | 2.91% | |
| | 4,372 | 1.71% | |
| | 1,337 | 0.49% | |
| | 63,209 | 3.53% | |
| | 89,639 | 4.31% | |
| | 838,430 | 17.33% | |
| | 4,045,411 | 4.77% | |
| | 801,710 | 2.84% | |
| | 13,065 | 28.86% | |
| | 871,643 | 7.37% | |
| | 17,552 | 23.80% | |
| | 65,812 | 37.52% | |
| | 10,610 | 2.56% | |
| | 2,144 | 1.30% | |
| | 1,017,517 | 5.86% | |
| | 426,941 | 3.27% | |
| | 101,828 | 5.67% | |
| | 460,286 | 37.03% | |
| | 1,195,240 | 9.76% | |
| | 182 | 20.87% | |
| | 648,520 | 7.43% | |
| | 1,041,264 | 1.25% | |
| | 595,937 | 5.70% | |
| | 38,496 | 10.46% | |
| | 15,575,724 | 1.17% | |
| | 3,876,739 | 1.48% | |
| | 1,123,383 | 1.40% | |
| | 1,479,966 | 3.90% | |
| | 882,022 | 15.83% | |
| | 10,957 | 11.47% | |
| | 342,585 | 3.35% | |
| | 2,900,924 | 4.62% | |
| | 850,105 | 3.61% | |
| | 1,067,455 | 27.61% | |
| | 797,496 | 0.63% | |
| | 699,719 | 7.82% | |
| | 4,075,738 | 18.78% | |
| | 455,889 | 0.96% | |
| | 4,717 | 4.33% | |
| | 187,871 | 4.20% | |
| | 760,847 | 11.35% | |
| | 1,345,075 | 16.50% | |
| | 337,678 | 14.63% | |
| | 798,140 | 11.96% | |
| | 363,763 | 14.56% | |
| | 276,630 | 5.79% | |
| | 141,623 | 2.20% | |
| | 3,870 | 9.39% | |
| | 544,120 | 15.90% | |
| | 61,058 | 9.72% | |
| | 140,395 | 17.91% | |
| | 516,024 | 19.89% | |
| | 169,984 | 0.63% | |
| | 302,515 | 1.73% | |
| | 1,835,252 | 5.71% | |
| | 2,844 | 0.82% | |
| | 1,005,607 | 5.40% | |
| | 103,392 | 18.83% | |
| | 6,901 | 11.49% | |
| | 13,618 | 3.40% | |
| | 119,334 | 2.85% | |
| | 168,255 | 11.77% | |
| | 6,602 | 3.01% | |
| | 12,339,062 | 8.85% | |
| | 19,798 | 15.72% | |
| | 888,610 | 17.92% | |
| | 28,626 | 43.09% | |
| | 59,266 | 1.96% | |
| | 138,356 | 18.11% | |
| | 17,744 | 78.36% | |
| | 2,834,641 | 7.62% | |
| | 713,867 | 2.49% | |
| | 2,881,797 | 5.08% | |
| | 145,852 | 5.60% | |
| | 2,391 | 19.16% | |
| | 1,629,306 | 5.41% | |
| | 981,434 | 5.48% | |
| | 6,330 | 1.71% | |
| | 802,335 | 15.00% | |
| | 638,958 | 9.51% | |
| | 356,793 | 1.76% | |
| | 1,093,644 | 0.59% | |
| | 5,355 | 81.80% | |
| | 112,783 | 0.45% | |
| | 2,649 | 4.81% | |
| | 193,477 | 3.58% | |
| | 21,333 | 0.27% | |
| | 5,935,193 | 3.05% | |
| | 2,552 | 12.44% | |
| | 142,706 | 3.50% | |
| | 4,631 | 0.06% | |
| | 3,551,185 | 43.83% | |
| | 845,373 | 11.29% | |
| | 1,409,676 | 4.30% | |
| | 5,316,320 | 5.01% | |
| | 4,449,789 | 10.33% | |
| | 2,306,321 | 18.14% | |
| | 1,768,384 | 33.73% | |
| | 25,681 | 0.69% | |
| | 3,028 | 3.44% | |
| | 3,408,118 | 14.87% | |
| | 10,576,766 | 6.87% | |
| | 315,866 | 2.65% | |
| | 3,958 | 48.19% | |
| | 39,132 | 41.58% | |
| | 55,414 | 23.18% | |
| | 435 | 6.67% | |
| | 60,424 | 36.97% | |
| | 113,139 | 36.68% | |
| | 2,303 | 6.60% | |
| | 35,833 | 15.83% | |
| | 270,029 | 0.78% | |
| | 586,870 | 3.73% | |
| | 964,585 | 9.83% | |
| | 11,772 | 11.34% | |
| | 145,003 | 2.20% | |
| | 313,884 | 5.36% | |
| | 23,811 | 41.46% | |
| | 341,620 | 5.92% | |
| | 140,490 | 6.36% | |
| | 3,833 | 0.65% | |
| | 1,998,764 | 15.63% | |
| | 841,120 | 1.52% | |
| | 2,345,840 | 4.46% | |
| | 634,613 | 4.89% | |
| | 1,251,004 | 2.60% | |
| | 1,637,385 | 7.32% | |
| | 1,890,861 | 3.22% | |
| | 267,800 | 30.38% | |
| | 95,671 | 6.92% | |
| | 333,428 | 3.30% | |
| | 664,557 | 7.41% | |
| | 5,011,509 | 21.30% | |
| | 294,531 | 0.55% | |
| | 589,748 | 6.50% | |
| | 854,327 | 1.24% | |
| | 37,311 | 3.01% | |
| | 446,982 | 5.77% | |
| | 2,255 | 61.51% | |
| | 56,524 | 35.42% | |
| | 363,332 | 20.89% | |
| | 651,044 | 5.46% | |
| | 3,114,471 | 3.81% | |
| | 242,948 | 4.33% | |
| | 1,878 | 3.69% | |
| | 3,472 | 24.60% | |
| | 736,017 | 1.50% | |
| | 5,825,745 | 11.50% | |
| | 136,557 | 1.35% | |
| | 4,917,460 | 7.05% | |
| | 3,023,657 | 0.92% | |
| | 3,407 | 3.18% | |
| | 346,976 | 9.18% | |
| | 1,991,040 | 6.24% | |
| | 8,583 | 3.40% | |
| | 606,344 | 1.91% | |
| | 2,558,678 | 2.67% | |
| | 7,843 | 39.13% | |
| | 91,034 | 13.44% | |
| | 1,012,889 | 3.63% | |
| | 238,121 | 1.45% | |
| | 856,345 | 5.20% | |
See also
References
- ↑ "Trends in International Migrant Stock: The 2015 Revision". United Nations Department of Economic and Social Affairs, Population Division. 2015.
- 1 2 Jie Zong & Jeanne Batalova, Frequently Requested Statistics on Immigrants and Immigration in the United States, Migration Policy Institute (April 14, 2016).
- ↑ “World Population Policies 2005”, United Nations, Department of Economic and Social Affairs, March 2006. ISBN 978-92-1-151420-9.
- ↑ “International Migration 2006”, United Nations, Department of Economic and Social Affairs, Population Division. United Nations Publication, No. E.06.XIII.6, March 2006.
- ↑ “Place of Birth of the Foreign-Born Population: 2009”, United States Census Bureau.
- ↑ "10,7 Millionen Migranten aus 194 Ländern leben in Deutschland", press release 448/12, Statistisches Bundesamt. 2012-12-18.
- ↑ 5,598,691 foreign population in Spain (2009), Spanish National Statistic Institute press report, INE (Spain). June 3, 2009. (Spanish)
- ↑ http://www.immi.gov.au/media/fact-sheets/15population.htm: 5,350,000 immigrants or 25% of the population.
- ↑ "Place of Birth", 2006 Population By-Census (PDF), Hong Kong: Census and Statistics Department, 2006, retrieved 2012-06-24
- ↑ “Immigrants should be citizens”, press report, ANSA. November 3, 2009.
- ↑ “Italy wakes up to the realities of immigration”, The Guardian. February 21, 2010.
- 1 2 3 4 The UN source uses a broader definition of “immigrant” (i.e., other than “people born outside their country of residence”) for all countries where the UNRWA registers Palestine refugees, defined by UNRWA as both actual refugees of 1949 and all of their descendants. See “Palestine refugees”, UNRWA. Accessed October 25, 2011.
- ↑ So where are Zimbabweans going?, BBC News. November 8, 2005.
- ↑ SA population may be much larger than previously thought, Beeld June 1, 2009.
- ↑ http://www.home-affairs.gov.za/faq.asp Reference to 1996 HSRC study
- ↑ Census in Brief
- ↑ 강영관. "국내 체류 외국인 150만명 돌파". 이투데이. Retrieved 13 May 2016.
- ↑ "РЗС - Резултати извештаја". Retrieved 13 May 2016.
- ↑ "Resident Population By Age Group, Gender, and Place of Birth", Global Results of 2006 By-Census, Macau: Statistics and Census Service, 2006, p. 200, retrieved 2012-06-24
- ↑ "United Nations Population Division - Department of Economic and Social Affairs". Retrieved 13 May 2016.
- ↑ "World Migration". International Organization for Migration. Retrieved 13 May 2016.
- ↑ http://www.elpais.com.co/elpais/colombia/noticias/colombia-pais-con-mayor-numero-emigrantes-suramerica