Manchester City Council election, 2016
| |||||||||||||||||||||||||||||||||||||||||||||||||||||||||||
| |||||||||||||||||||||||||||||||||||||||||||||||||||||||||||
| |||||||||||||||||||||||||||||||||||||||||||||||||||||||||||
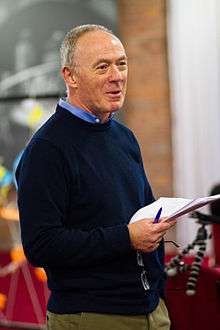
Elections to Manchester City Council were held on 5 May 2016. One third of the council was up for election, with each successful candidate serving a four-year term of office, expiring in 2020. The Labour Party retained overall control of the council, managing to hold all but one seat contested and won by former Withington MP, John Leech. Leech's win signified the first gain for any party in Manchester other than Labour for the first time in six years.
Councillors elected in 2012 were defending their seats this year, and vote share changes are compared on this basis.
Result
| Manchester City Council | |||||||||||||||
|---|---|---|---|---|---|---|---|---|---|---|---|---|---|---|---|
| Candidates | Votes | ||||||||||||||
| Party | Standing | Elected | Gained | Unseated | Net | % of total | % | № | Net % | ||||||
| Labour | 32 | 31 | 0 | 1 | -1 | 96.9 | 64.13 | 68,668 | |||||||
| Liberal Democrat | 32 | 1 | 1 | 0 | +1 | 3.1 | 11.13 | 11,920 | |||||||
| Green | 29 | 0 | 0 | 0 | 0 | 0.0 | 8.86 | 9,486 | |||||||
| Conservative | 32 | 0 | 0 | 0 | 0 | 0.0 | 6.98 | 7,475 | |||||||
| UKIP | 13 | 0 | 0 | 0 | 0 | 0.0 | 6.20 | 6,639 | |||||||
| Independent | 4 | 0 | 0 | 0 | 0 | 0.0 | 1.52 | 1,625 | |||||||
| TUSC | 16 | 0 | 0 | 0 | 0 | 0.0 | 0.91 | 974 | |||||||
| Monster Raving Loony | 3 | 0 | 0 | 0 | 0 | 0.0 | 0.21 | 223 | |||||||
| Christian Democrat Party for a Consensus | 1 | 0 | 0 | 0 | 0 | 0.0 | 0.05 | 57 | |||||||
| Communist League | 1 | 0 | 0 | 0 | 0 | 0.0 | 0.01 | 12 | |||||||
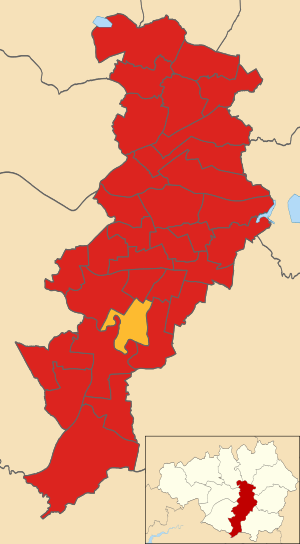
Council Composition
Prior to the election the composition of the council was:
| 96 |
| Labour |
After the election, the composition of the council was:
| 95 | 1 |
| Labour | LD |
LD - Liberal Democrat
Ward Results
Asterisks denote incumbent Councillors seeking re-election. Councillors seeking re-election were elected in 2012, and results are compared to that year's polls on that basis. All results are listed below:[1]
Ancoats and Clayton
| Party | Candidate | Votes | % | ± | |
|---|---|---|---|---|---|
| Labour | Ollie Manco | 1,864 | 54.49 | ||
| Independent | Ken Dobson | 941 | 27.51 | ||
| Green | Steffeny Louise McGiffen | 322 | 9.41 | ||
| Conservative | Denis Kostyan | 164 | 4.79 | ||
| Liberal Democrat | Chris Wilkinson | 130 | 3.80 | ||
| Majority | 923 | 26.98 | |||
| Turnout | 3,421 | 26.60 | |||
| Labour hold | Swing | ||||
Ardwick
| Party | Candidate | Votes | % | ± | |
|---|---|---|---|---|---|
| Labour | Tarjuah Tina Hewitson | 2,086 | 80.88 | ||
| Conservative | Akbar Ali Arif | 185 | 7.17 | ||
| Green | Kara Ng | 156 | 6.05 | ||
| Liberal Democrat | Charles Richard George Gadsden | 79 | 3.06 | ||
| TUSC | John Neill | 73 | 2.83 | ||
| Majority | 1,901 | 73.71 | |||
| Turnout | 2,579 | 25.28 | |||
| Labour hold | Swing | ||||
Baguley
| Party | Candidate | Votes | % | ± | |
|---|---|---|---|---|---|
| Labour | Luke John Rakes* | 1,579 | 64.79 | ||
| Conservative | Ralph John Ellerton | 400 | 16.41 | ||
| Green | Bonnie Mercer | 154 | 6.32 | ||
| TUSC | Lynn Worthington | 127 | 5.21 | ||
| Monster Raving Loony | Lord Cameron of Roundwood | 91 | 3.73 | ||
| Liberal Democrat | Phil Stubbs | 86 | 3.53 | ||
| Majority | 858 | 35.21 | |||
| Turnout | 2,437 | 22.60 | |||
| Labour hold | Swing | ||||
Bradford
| Party | Candidate | Votes | % | ± | |
|---|---|---|---|---|---|
| Labour | Emma Victoria Taylor | 2,121 | 73.39 | ||
| Green | Rachel Harper | 283 | 9.79 | ||
| Conservative | Michael Charles Barnes | 249 | 8.62 | ||
| Liberal Democrat | Gary McKenna | 105 | 3.63 | ||
| TUSC | Alexander Robert John Powell | 75 | 2.60 | ||
| Christian Democrat Party for a Consensus | Jonathan Cox | 57 | 1.97 | ||
| Majority | 1,838 | 63.60 | |||
| Turnout | 2,890 | 24.00 | |||
| Labour hold | Swing | ||||
Brooklands
| Party | Candidate | Votes | % | ± | |
|---|---|---|---|---|---|
| Labour | Glynn Evans* | 1,738 | 59.30 | ||
| UKIP | Pat Bebby | 544 | 18.56 | ||
| Conservative | Stephen Paul Woods | 504 | 17.20 | ||
| Liberal Democrat | Andrew McGuinness | 145 | 4.95 | ||
| Majority | 1,194 | 40.74 | |||
| Turnout | 2,931 | 28.20 | |||
| Labour hold | Swing | ||||
Burnage
| Party | Candidate | Votes | % | ± | |
|---|---|---|---|---|---|
| Labour | Bev Craig* | 2,291 | 63.20 | ||
| Liberal Democrat | Maria Theresa Turner | 489 | 13.49 | ||
| UKIP | Liam Thomas Evans | 460 | 12.69 | ||
| Green | Sam Darby | 339 | 9.35 | ||
| Conservative | Sahed Hossain | 46 | 1.27 | ||
| Majority | 1,802 | 49.71 | |||
| Turnout | 3,625 | 33.82 | |||
| Labour hold | Swing | ||||
Charlestown
| Party | Candidate | Votes | % | ± | |
|---|---|---|---|---|---|
| Labour | Hannah Kate Priest | 1,671 | 59.38 | ||
| UKIP | Neil Caradoc Griffiths | 770 | 27.36 | ||
| Conservative | Nicholas David St John Savage | 204 | 7.25 | ||
| Green | Astrid Johnson | 92 | 3.27 | ||
| Liberal Democrat | Charles William Turner | 77 | 2.74 | ||
| Majority | 901 | 32.02 | |||
| Turnout | 2,814 | 27.75 | |||
| Labour hold | Swing | ||||
Cheetham
| Party | Candidate | Votes | % | ± | |
|---|---|---|---|---|---|
| Labour | Shaukat Ali* | 3,485 | 81.79 | ||
| Conservative | Peter Malcolm Schofield | 318 | 7.46 | ||
| Green | Dave Taylor | 225 | 5.28 | ||
| Liberal Democrat | Arthur Craig Whittall | 2.84 | |||
| TUSC | Catherine Spencer | 112 | 2.63 | ||
| Majority | 3,167 | 74.33 | |||
| Turnout | 4,261 | 29.19 | |||
| Labour hold | Swing | ||||
Chorlton
| Party | Candidate | Votes | % | ± | |
|---|---|---|---|---|---|
| Labour | Sheila Newman* | 3,296 | 65.68 | ||
| Green | Nigel James Woodcock | 778 | 15.50 | ||
| Liberal Democrat | Ludo Tolhurst-Cleaver | 719 | 14.33 | ||
| Conservative | Colm George Lock | 225 | 4.48 | ||
| Majority | 2,518 | 50.18 | |||
| Turnout | 5,018 | 47.00 | |||
| Labour hold | Swing | ||||
Chorlton Park
| Party | Candidate | Votes | % | ± | |
|---|---|---|---|---|---|
| Labour | Joanna Rachel Midgley* | 2,564 | 50.29 | ||
| Liberal Democrat | Norman Lewis | 1,950 | 38.25 | ||
| Green | Hannah Lisa Richmond | 412 | 8.08 | ||
| Conservative | Luke Oisin Bourke Costello | 172 | 3.37 | ||
| Majority | 614 | 12.04 | |||
| Turnout | 5,098 | 45.17 | |||
| Labour hold | Swing | ||||
City Centre
| Party | Candidate | Votes | % | ± | |
|---|---|---|---|---|---|
| Labour | Joan Elizabeth Davies* | 1,410 | 64.74 | ||
| Liberal Democrat | John Richard Bridges | 403 | 18.50 | ||
| Conservative | Paul Wan | 365 | 16.76 | ||
| Majority | 1,007 | 46.24 | |||
| Turnout | 2,178 | 22.15 | |||
| Labour hold | Swing | ||||
Crumpsall
| Party | Candidate | Votes | % | ± | |
|---|---|---|---|---|---|
| Labour | Richard Charles Leese* | 2,704 | 74.35 | ||
| UKIP | Bob Willescroft | 375 | 10.31 | ||
| Conservative | Sarah Idowu Ajiboye | 288 | 7.92 | ||
| Green | Penny Miller-Swann | 151 | 4.15 | ||
| Liberal Democrat | Iain Colin Donaldson | 75 | 2.06 | ||
| TUSC | Martin Conway | 44 | 1.21 | ||
| Majority | 2,329 | 64.04 | |||
| Turnout | 3,637 | 32.79 | |||
| Labour hold | Swing | ||||
Didsbury East
| Party | Candidate | Votes | % | ± | |
|---|---|---|---|---|---|
| Labour | Kelly Suzanne Simcock | 2,484 | 53.74 | ||
| Liberal Democrat | Dominic Hardwick | 1,281 | 27.72 | ||
| Green | Wendy Ann Lynas | 316 | 6.84 | ||
| Conservative | Robert George Manning | 305 | 6.60 | ||
| UKIP | Mark Davies | 236 | 5.11 | ||
| Majority | 1,203 | 26.03 | |||
| Turnout | 4,622 | 44.00 | |||
| Labour hold | Swing | ||||
Didsbury West
| Party | Candidate | Votes | % | ± | |
|---|---|---|---|---|---|
| Liberal Democrat | John Leech | 2,295 | 52.61 | +24.5% | |
| Labour | Barnaby Edward Lane | 1,593 | 36.52 | -7.5% | |
| Green | Arnold James Spencer | 244 | 5.59 | -6% | |
| Conservative | Max Dowling | 161 | 3.69 | -12% | |
| UKIP | Robert Gutenfreund-Walmsley | 69 | 1.58 | -2% | |
| Majority | 702 | 16.09 | |||
| Turnout | 4,362 | 44.40 | |||
| Liberal Democrat gain from Labour | Swing | ||||
- Leech's win signified the first gain for any party in Manchester other than Labour for the first time in six years and provided Manchester with its first opposition for two years.
Fallowfield
| Party | Candidate | Votes | % | ± | |
|---|---|---|---|---|---|
| Labour | Zahra Alijah | 1,932 | 71.16 | ||
| Green | Laura Alice Bannister | 408 | 15.03 | ||
| Conservative | Luke Aidan Dyks | 197 | 7.26 | ||
| Liberal Democrat | Christopher Jones | 125 | 4.60 | ||
| TUSC | Aidan Ryan Matthews | 53 | 1.95 | ||
| Majority | 1,524 | 56.13 | |||
| Turnout | 2,715 | 24.74 | |||
| Labour hold | Swing | ||||
Gorton North
| Party | Candidate | Votes | % | ± | |
|---|---|---|---|---|---|
| Labour | Afia Begum Kamal* | 1,743 | 61.01 | ||
| UKIP | Katie Elizabeth Fanning | 628 | 21.98 | ||
| Liberal Democrat | Andrew Peter Hickey | 194 | 6.79 | ||
| Conservative | Phelim Rowe | 161 | 5.64 | ||
| Green | Karl Wardlaw | 131 | 4.59 | ||
| Majority | 1,115 | 39.03 | |||
| Turnout | 2,857 | 26.80 | |||
| Labour hold | Swing | ||||
Gorton South
| Party | Candidate | Votes | % | ± | |
|---|---|---|---|---|---|
| Labour | Bernard Eric Stone* | 2,792 | 70.17 | ||
| UKIP | Bob Catterall | 481 | 12.09 | ||
| Liberal Democrat | Sarah Louise Brown | 246 | 6.18 | ||
| Green | Melvyn Newton | 239 | 6.01 | ||
| Conservative | Tmo Opesan | 141 | 3.54 | ||
| Independent | Martin Burke | 80 | 2.01 | ||
| Majority | 2,311 | 58.08 | |||
| Turnout | 3,979 | 31.28 | |||
| Labour hold | Swing | ||||
Harpurhey
| Party | Candidate | Votes | % | ± | |
|---|---|---|---|---|---|
| Labour | Patrick Charles Karney* | 1,791 | 64.31 | ||
| UKIP | Mandy Michelle Howard | 552 | 19.82 | ||
| Conservative | Alexandru Stelian Stancu | 166 | 5.96 | ||
| Green | Mary Rosalind Candeland | 132 | 4.74 | ||
| Liberal Democrat | Rodney Alan Isherwood | 102 | 3.66 | ||
| TUSC | Emma Windefride | 42 | 1.51 | ||
| Majority | 1,239 | 44.49 | |||
| Turnout | 2,785 | 23.50 | |||
| Labour hold | Swing | ||||
Higher Blackley
| Party | Candidate | Votes | % | ± | |
|---|---|---|---|---|---|
| Labour | Shelley Margaret Lanchbury* | 1,569 | 58.52 | ||
| UKIP | Martin Power | 691 | 25.77 | ||
| Conservative | Barney Bradley Watson | 202 | 7.53 | ||
| Liberal Democrat | Peter George Matthews | 115 | 4.29 | ||
| Green | Anne Vivienne Power | 104 | 3.88 | ||
| Majority | 878 | 32.75 | |||
| Turnout | 2,681 | 25.76 | |||
| Labour hold | Swing | ||||
Hulme
| Party | Candidate | Votes | % | ± | |
|---|---|---|---|---|---|
| Labour | Amina Lone* | 1,726 | 65.30 | ||
| Green | Deyika Nzeribe | 515 | 19.49 | ||
| Liberal Democrat | Hannah Jane Gee | 184 | 6.96 | ||
| Conservative | Kevin Gerard O'Neill | 162 | 6.13 | ||
| TUSC | Martin Shaw | 56 | 2.12 | ||
| Majority | 1,211 | 45.82 | |||
| Turnout | 2,643 | 25.30 | |||
| Labour hold | Swing | ||||
Levenshulme
| Party | Candidate | Votes | % | ± | |
|---|---|---|---|---|---|
| Labour | Nasrin Bibi Ali* | 2,066 | 54.53 | ||
| Green | Dick Venes | 764 | 20.16 | ||
| Independent | Mark Breeze | 470 | 12.40 | ||
| Liberal Democrat | Liaqat Ali | 285 | 7.52 | ||
| Conservative | Calum Tudur James Davies | 164 | 4.33 | ||
| TUSC | Joe McArdle | 40 | 1.06 | ||
| Majority | 1,302 | 34.36 | |||
| Turnout | 3,789 | 35.2 | |||
| Labour hold | Swing | ||||
Longsight
| Party | Candidate | Votes | % | ± | |
|---|---|---|---|---|---|
| Labour | Luthfur Rahman* | 2,897 | 78.98 | ||
| Conservative | Anjnarra Huque | 254 | 6.92 | ||
| Green | Vicky Matthews | 219 | 5.97 | ||
| Liberal Democrat | Timothy Charles Crump | 140 | 3.82 | ||
| Independent | Raees Ahmad Khan | 134 | 3.65 | ||
| TUSC | Mercedes Caccia Mesorio | 24 | 0.65 | ||
| Majority | 2,643 | 72.06 | |||
| Turnout | 3,668 | 36.4 | |||
| Labour hold | Swing | ||||
Miles Platting and Newton Heath
| Party | Candidate | Votes | % | ± | |
|---|---|---|---|---|---|
| Labour | Carmine Geatano Grimshaw* | 1,938 | 78.49 | ||
| Conservative | Harry Kagkouras | 193 | 7.82 | ||
| Green | Isobel Mary Patience | 134 | 5.43 | ||
| Liberal Democrat | Richard Martin Kilpatrick | 116 | 4.70 | ||
| TUSC | Bridget Taylor | 88 | 3.56 | ||
| Majority | 1,745 | 70.68 | |||
| Turnout | 2,469 | 24.12 | |||
| Labour hold | Swing | ||||
Moss Side
| Party | Candidate | Votes | % | ± | |
|---|---|---|---|---|---|
| Labour | Mahadi Hussein Sharif Mahamed | 2,869 | 74.33 | ||
| Green | Muhammad Anwar Shahzad | 415 | 10.75 | ||
| Conservative | Aden Hassan | 309 | 8.01 | ||
| Liberal Democrat | Annie Jackson | 267 | 6.92 | ||
| Majority | 2,454 | 63.58 | |||
| Turnout | 3,860 | 29.20 | |||
| Labour hold | Swing | ||||
Moston
| Party | Candidate | Votes | % | ± | |
|---|---|---|---|---|---|
| Labour | Carl Peter Ollerhead* | 1,899 | 56.65 | ||
| UKIP | Phil Eckersley | 899 | 26.82 | ||
| Conservative | Hector James Robertson Williams | 301 | 8.98 | ||
| Green | Eithne Quinn | 118 | 3.52 | ||
| Liberal Democrat | Dave Page | 102 | 3.04 | ||
| TUSC | Jack Joseph Metcalf | 33 | 0.98 | ||
| Majority | 1,000 | 29.83 | |||
| Turnout | 3,352 | 30.28 | |||
| Labour hold | Swing | ||||
Northenden
| Party | Candidate | Votes | % | ± | |
|---|---|---|---|---|---|
| Labour | Mary Theresa Monaghan | 2,003 | 64.06 | ||
| Conservative | Fiona Mary Green | 541 | 17.30 | ||
| Green | Simon James Gray | 308 | 9.85 | ||
| Liberal Democrat | Pablo O'Hana | 166 | 5.31 | ||
| Monster Raving Loony | Johnny Disco | 109 | 3.49 | ||
| Majority | 1,462 | 46.75 | |||
| Turnout | 3,127 | 28.30 | |||
| Labour hold | Swing | ||||
Old Moat
| Party | Candidate | Votes | % | ± | |
|---|---|---|---|---|---|
| Labour | Andrew Henryk Fender* | 2,244 | 67.29 | ||
| Liberal Democrat | April Preston | 561 | 16.82 | ||
| Green | Nathan Rae | 329 | 9.87 | ||
| Conservative | Jeanmiguel Uva | 138 | 4.14 | ||
| TUSC | Jane Elizabeth Lee | 63 | 1.89 | ||
| Majority | 1,683 | 50.46 | |||
| Turnout | 3,335 | 31.85 | |||
| Labour hold | Swing | ||||
Rusholme
| Party | Candidate | Votes | % | ± | |
|---|---|---|---|---|---|
| Labour | Ahmed Ali* | 2.346 | 75.14 | ||
| Green | Rob Jones | 415 | 13.29 | ||
| Liberal Democrat | Abu Mohiuddin Chowdhury | 195 | 6.25 | ||
| Conservative | Archie Stuart Galbraith | 166 | 5.32 | ||
| Majority | 1,931 | 61.85 | |||
| Turnout | 3,122 | 31.24 | |||
| Labour hold | Swing | ||||
Sharston
| Party | Candidate | Votes | % | ± | |
|---|---|---|---|---|---|
| Labour | Tommy Judge* | 1,645 | 61.84 | ||
| UKIP | Bob Burke | 561 | 21.09 | ||
| Conservative | Jagdeep Singh Mehat | 227 | 8.53 | ||
| Liberal Democrat | Bernie Ryan | 100 | 3.76 | ||
| Green | Sylvia June Buchan | 92 | 3.46 | ||
| Monster Raving Loony | Silly Sir Oink A-Lot | 23 | 0.86 | ||
| Communist League | Peter Clifford | 12 | 0.45 | ||
| Majority | 1,084 | 40.75 | |||
| Turnout | 2,660 | 23.00 | |||
| Labour hold | Swing | ||||
Whalley Range
| Party | Candidate | Votes | % | ± | |
|---|---|---|---|---|---|
| Labour | Angeliki Stogia* | 3,091 | 63.75 | ||
| Green | Ben Godfrey | 1,321 | 27.24 | ||
| Conservative | David Robert Semple | 223 | 4.60 | ||
| Liberal Democrat | Rhona Eva Elizabeth Cowan Brown | 169 | 3.49 | ||
| TUSC | Liam David | 45 | 0.93 | ||
| Majority | 1,770 | 36.50 | |||
| Turnout | 4,849 | 44.52 | |||
| Labour hold | Swing | ||||
Withington
| Party | Candidate | Votes | % | ± | |
|---|---|---|---|---|---|
| Labour Co-op | Chris Wills | 1,683 | 55.25 | ||
| Liberal Democrat | Simon David Wheale | 844 | 27.71 | ||
| Green | Lucy Jane Bannister | 370 | 12.15 | ||
| Conservative | Shaden Jaradat | 113 | 3.71 | ||
| TUSC | Zoe Brunswick | 36 | 1.18 | ||
| Majority | 839 | 27.54 | |||
| Turnout | 3,046 | 31.47 | |||
| Labour hold | Swing | ||||
Woodhouse Park
| Party | Candidate | Votes | % | ± | |
|---|---|---|---|---|---|
| Labour | Brian Darral O'Neil* | 1,548 | 68.22 | ||
| UKIP | Tony Welch | 373 | 16.44 | ||
| Conservative | Eric Houghton | 231 | 10.18 | ||
| TUSC | Laurie Joseph Carefoot | 63 | 2.78 | ||
| Liberal Democrat | Martha O'Donoghue | 54 | 2.38 | ||
| Majority | 1,175 | 51.78 | |||
| Turnout | 2,269 | 22.25 | |||
| Labour hold | Swing | ||||
References
- ↑ "Local Election Results - Thursday 5 May 2016". Manchester City Council. Retrieved 7 May 2016.
| Mayor | |
|---|---|
| Bolton | |
| Bury | |
| Manchester | |
| Oldham | |
| Rochdale | |
| Salford | |
| Stockport | |
| Tameside | |
| Trafford | |
| Wigan | |
| County Council |
|
| |