United States House of Representatives elections, 1890
| | |||||||||||||||||||||||||||||||||||||||||||
| |||||||||||||||||||||||||||||||||||||||||||
| |||||||||||||||||||||||||||||||||||||||||||
| |||||||||||||||||||||||||||||||||||||||||||
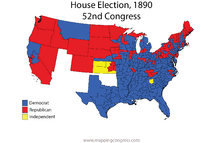
Elections to the United States House of Representatives were held in 1890 for members of the 52nd Congress, taking place in the middle of President Benjamin Harrison's term.
A stagnant economy which became worse after the Panic of 1890, combined with a lack of support for then Representative William McKinley's (defeated in the election) steep tariff act, which favored large industries at the expense of consumers, led to a sharp defeat for Harrison's Republican Party, giving a large majority to the Democratic Party and presaging Harrison's defeat in 1892. The Republican-controlled Congress was highly criticized for its lavish spending, and it earned the unflattering nickname of The Billion Dollar Congress. Democrats promised to cut the outlandish budget.
Furthermore, aggressive Republican promotion of controversial English-only education laws enacted by Wisconsin and Illinois in 1889, accompanied by a surge in nativist and anti-Catholic sentiment within the state parties, had greatly hollowed out the party's support base in these former strongholds. A rare multi-confessional alliance of mainly German clergy rallied their flocks in defense of language and faith to the Democratic Party, which tore through incumbent Republican majorities in both states, capturing a total of 11 formerly Republican seats between them alone.[2] Bitterly divisive struggles over temperance laws had also been alienating immigrants from the increasingly prohibitionist Republican Party across the Midwest more broadly. Dramatic losses in the previous year's gubernatorial elections in Iowa and Ohio (which would lose another 14 Republican congressional seats between them during this election) were due in no small part to wet immigrant communities, especially Germans, expressing their resentment toward Republican efforts to ban or otherwise curtail alcohol consumption by throwing their support behind the Democratic candidates.[3]
This election also saw the Populist Party, a coalition of farmers and laborers who wanted to overhaul the nation's financial system, make a small mark on Congress.
Election summaries
| 238 | 8 | 86 |
| Democratic | P | Republican |
| State | Type | Total seats |
Democratic | Republican | Populist | |||
|---|---|---|---|---|---|---|---|---|
| Seats | Change | Seats | Change | Seats | Change | |||
| Alabama | District | 8 | 8 | |
0 | |
0 | |
| Arkansas | District | 5 | 5 | |
0 | |
0 | |
| California | District | 6 | 2 | |
4 | |
0 | |
| Colorado | At-large | 1 | 0 | |
1 | |
0 | |
| Connecticut | District | 4 | 3 | |
1 | |
0 | |
| Delaware | At-large | 1 | 1 | |
0 | |
0 | |
| Florida | District | 2 | 2 | |
0 | |
0 | |
| Georgia | District | 10 | 10 | |
0 | |
0 | |
| Idaho[Note 4] | At-large | 1 | 0 | |
1 | |
0 | |
| Illinois | District | 20 | 14 | |
6 | |
0 | |
| Indiana | District | 13 | 11 | |
2 | |
0 | |
| Iowa | District | 11 | 6 | |
5 | |
0 | |
| Kansas | District | 7 | 0 | |
2 | |
5 | |
| Kentucky | District | 11 | 10 | |
1 | |
0 | |
| Louisiana | District | 6 | 6 | |
0 | |
0 | |
| Maine[Note 4] | District | 4 | 0 | |
4 | |
0 | |
| Maryland | District | 6 | 6 | |
0 | |
0 | |
| Massachusetts | District | 12 | 7 | |
5 | |
0 | |
| Michigan | District | 11 | 8 | |
3 | |
0 | |
| Minnesota | District | 5 | 3 | |
1 | |
1 | |
| Mississippi | District | 7 | 7 | |
0 | |
0 | |
| Missouri | District | 14 | 14 | |
0 | |
0 | |
| Montana | At-large | 1 | 1 | |
0 | |
0 | |
| Nebraska | District | 3 | 1 | |
0 | |
2 | |
| Nevada | At-large | 1 | 0 | |
1 | |
0 | |
| New Hampshire | District | 2 | 2 | |
0 | |
0 | |
| New Jersey | District | 7 | 5 | |
2 | |
0 | |
| New York | District | 34 | 23 | |
11 | |
0 | |
| North Carolina | District | 9 | 8 | |
1 | |
0 | |
| North Dakota | At-large | 1 | 0 | |
1 | |
0 | |
| Ohio | District | 21 | 14 | |
7 | |
0 | |
| Oregon[Note 4] | At-large | 1 | 0 | |
1 | |
0 | |
| Pennsylvania | District | 28 | 11 | |
17 | |
0 | |
| Rhode Island | District | 2 | 2 | |
0 | |
0 | |
| South Carolina | District | 7 | 7 | |
0 | |
0 | |
| South Dakota | At-large | 2 | 0 | |
2 | |
0 | |
| Tennessee | District | 10 | 8 | |
2 | |
0 | |
| Texas | District | 11 | 11 | |
0 | |
0 | |
| Vermont[Note 4] | District | 2 | 0 | |
2 | |
0 | |
| Virginia | District | 10 | 10 | |
0 | |
0 | |
| Washington | At-large | 1 | 0 | |
1 | |
0 | |
| West Virginia | District | 4 | 4 | |
0 | |
0 | |
| Wisconsin | District | 9 | 8 | |
1 | |
0 | |
| Wyoming[Note 4] | At-large | 1 | 0 | |
1 | |
0 | |
| Total | 332 | 238[1] 71.7% |
|
86[1] 25.9% |
|
8[1] 2.4% |
| |
The previous election of 1888 saw the election of one Labor Party representative in Arkansas.
[[Image:52 us house membership.png|thumb|450px|
]] |
[[Image:52 us house changes.png|thumb|450px|
]] | |||||||||||||||||||||||||||
Early election dates
In 1890, five states, with 9 seats among them, held elections early:
Idaho and Wyoming held elections for both the outgoing 51st Congress and the incoming 52nd Congress in 1890, having been admitted that year, and held future elections on the standard election day.
Separate races
- December 9, 1890: Thomas J. Geary (D) elected to finish the term of John J. De Haven (R), who had resigned October 1, 1890.
Complete returns
California
| District | Incumbent | Party | First elected |
Result | Candidates |
|---|---|---|---|---|---|
| California 1 | Vacant | Democratic gain. | √ Thomas J. Geary (Democratic) 49.3% John A. Barham (Republican) 48.8% L. B. Scranton (Prohibition) 1.9% | ||
| California 2 | Marion Biggs | Democratic | 1886 | Incumbent retired. Democratic hold. |
√ Anthony Caminetti (Democratic) 49% George I. Blanchard (Republican) 48.6% J. S. Witherell (Prohibition) 2.4% |
| California 3 | Joseph McKenna | Republican | 1884 | Incumbent re-elected. | √ Joseph McKenna (Republican) 55.4% John P. Irish (Democratic) 42.5% O. O. Felkner (Prohibition) 2.1% |
| California 4 | William W. Morrow | Republican | 1884 | Incumbent retired. Republican hold. |
√ John T. Cutting (Republican) 49.2% Robert Ferral (Democratic) 45.1% Thomas V. Cator (Socialist) 5.6% Joseph Rowell (Prohibition) 0.2% |
| California 5 | Thomas J. Clunie | Democratic | 1888 | Incumbent lost re-election. Republican gain. |
√ Eugene F. Loud (Republican) 52.8% Thomas J. Clunie (Democratic) 45.9% E. F. Howe (Prohibition) 1.3% |
| California 6 | William Vandever | Republican | 1886 | Incumbent retired. Republican hold. |
√ William W. Bowers (Republican) 51.1% W. J. Curtis (Democratic) 44.1% O. R. Dougherty (Prohibition) 4.8% |
Florida
| District | Incumbent | Party | First elected |
Result | Candidates |
|---|---|---|---|---|---|
| Florida 1 | Robert H. M. Davidson | Democratic | 1876 | Incumbent lost renomination. Democratic hold. |
√ Stephen R. Mallory, Jr. (Democratic) 78.5% Harrison Reed (Republican) 21.5% |
| Florida 2 | Robert Bullock | Democratic | 1888 | Incumbent re-elected. | √ Robert Bullock (Democratic) 58.8% Joseph Stripling (Republican) 41.2% |
Ohio
The Ohio Legislature redistricted the state between censuses. Coupled with other Democratic gains, this redistricting gave the Democrats a nine-seat net gain.
| District | Incumbent | Party | First elected |
Result | Candidates[4] |
|---|---|---|---|---|---|
| Ohio 1 | Benjamin Butterworth | Republican | 1884 | Incumbent retired. Republican hold. |
|
| Ohio 2 | John A. Caldwell | Republican | 1888 | Incumbent re-elected. |
|
| Ohio 3 | Elihu S. Williams | Republican | 1886 | Incumbent retired. Republican loss. |
|
| Henry Lee Morey Redistricted from the 7th district |
Republican | 1888 | Incumbent lost re-election. Democratic gain. | ||
| Ohio 4 | Samuel S. Yoder | Democratic | 1886 | Incumbent retired. Democratic hold. |
|
| Ohio 5 | George E. Seney | Democratic | 1886 | Incumbent retired. Democratic hold. |
|
| Ohio 6 | Melvin M. Boothman | Republican | 1886 | Incumbent retired. Democratic gain. |
|
| Ohio 7 | William E. Haynes Redistricted from the 10th district |
Democratic | 1888 | Incumbent re-elected. |
|
| Ohio 8 | Robert P. Kennedy | Republican | 1886 | Incumbent retired. Democratic gain. |
|
| Ohio 9 | William C. Cooper | Republican | 1884 | Incumbent retired. Republican loss. |
|
| Joseph H. Outhwaite Redistricted from the 13th district |
Democratic | 1884 | Incumbent re-elected. | ||
| Ohio 10 | Open seat | New seat Republican gain. |
| ||
| Ohio 11 | Albert C. Thompson | Republican | 1886 | Lost renomination Democratic gain. |
|
| Ohio 12 | Jacob J. Pugsley | Republican | 1886 | Incumbent retired. Republican hold. |
|
| Ohio 13 | Open seat | New seat Democratic gain. |
| ||
| Ohio 14 | Charles Preston Wickham | Republican | 1886 | Incumbent retired. Republican loss. |
|
| James W. Owens Redistricted from the 16th district |
Democratic | 1888 | Incumbent re-elected. | ||
| Ohio 15 | Charles H. Grosvenor | Republican | 1886 | Lost renomination Democratic gain. |
|
| Ohio 16 | William McKinley Redistricted from the 18th district |
Republican | 1886 | Incumbent lost re-election. Democratic gain. |
|
| Ohio 17 | Open seat | New seat Democratic gain. |
| ||
| Ohio 18 | Joseph D. Taylor Redistricted from the 17th district |
Republican | 1886 | Incumbent re-elected. |
|
| Ohio 19 | Ezra B. Taylor | Republican | 1880 | Incumbent re-elected. |
|
| Ohio 20 | Martin L. Smyser | Republican | 1888 | Lost renomination Republican hold. |
|
| Ohio 21 | Theodore E. Burton | Republican | 1888 | Incumbent lost re-election. Democratic gain. |
|
South Carolina
| District | Incumbent | Party | First elected |
Result | Candidates |
|---|---|---|---|---|---|
| South Carolina 1 | Samuel Dibble | Democratic | 1882 | Incumbent retired. Democratic hold. |
√ William H. Brawley (Democratic) 84.2% William D. Crum (Republican) 15.7% Others 0.1% |
| South Carolina 2 | George D. Tillman | Democratic | 1878 | Incumbent re-elected. | √ George D. Tillman (Democratic) 85.5% Seymour E. Smith (Republican) 14.3% Others 0.2% |
| South Carolina 3 | James S. Cothran | Democratic | 1886 | Incumbent retired. Democratic hold. |
√ George Johnstone (Democratic) 91.4% John R. Tolbert (Republican) 8.2% Others 0.4% |
| South Carolina 4 | William H. Perry | Democratic | 1884 | Incumbent retired. Democratic hold. |
√ George W. Shell (Democratic) 81.9% J. F. Ensor (Republican) 17.8% Others 0.3% |
| South Carolina 5 | John J. Hemphill | Democratic | 1882 | Incumbent re-elected. | √ John J. Hemphill (Democratic) 87.1% G. G. Alexander (Republican) 12.2% Others 0.7% |
| South Carolina 6 | George W. Dargan | Democratic | 1882 | Incumbent retired. Democratic hold. |
√ Eli T. Stackhouse (Democratic) 78.8% Edmund H. Deas (Republican) 20.5% Others 0.7% |
| South Carolina 7 | Thomas E. Miller | Republican | 1888[Note 5] | Incumbent lost re-election. Democratic gain. |
√ William Elliott (Democratic) 44.4% Thomas E. Miller (Republican) 38.8% E. M. Brayton (Independent Republican) 16.5% Others 0.3% |
See also
Notes
References
- 1 2 3 4 5 6 Martis, pp. 144–145.
- ↑ Jensen, Richard J. The Winning of the Midwest: Social and Political Conflict, 1888-1896, ch. 5: Education, the Tariff, and the Melting Pot. Chicago: The University of Chicago Press, 1971. pp. 122-153.
- ↑ Jensen, ch. 4: Iowa, Wet or Dry?. pp. 89-121.
- ↑ Smith, Joseph P, ed. (1898). History of the Republican Party in Ohio. I. Chicago: the Lewis Publishing Company. pp. 592, 593.
Bibliography
- Dubin, Michael J. (March 1, 1998). United States Congressional Elections, 1788-1997: The Official Results of the Elections of the 1st Through 105th Congresses. McFarland and Company. ISBN 978-0786402830.
- Martis, Kenneth C. (January 1, 1989). The Historical Atlas of Political Parties in the United States Congress, 1789-1989. Macmillan Publishing Company. ISBN 978-0029201701.
- Moore, John L., ed. (1994). Congressional Quarterly's Guide to U.S. Elections (Third ed.). Congressional Quarterly Inc. ISBN 978-0871879967.
- "Party Divisions of the House of Representatives* 1789–Present". Office of the Historian, House of United States House of Representatives. Retrieved January 21, 2015.
External links
- Office of the Historian (Office of Art & Archives, Office of the Clerk, U.S. House of Representatives)