United States House of Representatives elections, 1884
| | |||||||||||||||||||||||||||||||||||||||||||
| |||||||||||||||||||||||||||||||||||||||||||
| |||||||||||||||||||||||||||||||||||||||||||
| |||||||||||||||||||||||||||||||||||||||||||
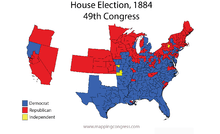
Elections to the United States House of Representatives were held in 1884 for Representatives in the 49th Congress. These election coincided with the election of President Grover Cleveland.
In spite of Cleveland's victory, the opposition Republican Party gained back some of the seats lost in 1882, but the Democratic Party retained a majority in the House. Republicans were able to make these slight gains by connecting their pro-business and industry message with progress. The Democrats were also hindered by the Panic of 1884, but were not greatly affected by it since the depression ended quickly.
Election summaries
| 183 | 1 | 141 |
| Democratic | Gb | Republican |
| State | Type | Total seats |
Democratic | Republican | Others | |||
|---|---|---|---|---|---|---|---|---|
| Seats | Change | Seats | Change | Seats | Change | |||
| Alabama | District | 8 | 8 | |
0 | |
0 | |
| Arkansas | District[Note 6] | 5 | 5 | |
0 | |
0 | |
| California | District[Note 6] | 6 | 1 | |
5 | |
0 | |
| Colorado | At-large | 1 | 0 | |
1 | |
0 | |
| Connecticut | District | 4 | 2 | |
2 | |
0 | |
| Delaware | At-large | 1 | 1 | |
0 | |
0 | |
| Florida | District | 2 | 2 | |
0 | |
0 | |
| Georgia | District[Note 6] | 10 | 10 | |
0 | |
0 | |
| Illinois | District | 20 | 10 | |
10 | |
0 | |
| Indiana | District | 13 | 9 | |
4 | |
0 | |
| Iowa | District | 11 | 3 | |
7 | |
1[Note 7] | |
| Kansas | District[Note 6] | 7 | 0 | |
7 | |
0 | |
| Kentucky | District | 11 | 10 | |
1 | |
0 | |
| Louisiana | District | 6 | 5 | |
1 | |
0 | |
| Maine[Note 8] | District[Note 9] | 4 | 0 | |
4 | |
0 | |
| Maryland | District | 6 | 5 | |
1 | |
0 | |
| Massachusetts | District | 12 | 2 | |
10 | |
0 | |
| Michigan | District | 11 | 7 | |
4 | |
0 | |
| Minnesota | District | 5 | 0 | |
5 | |
0 | |
| Mississippi | District | 7 | 7 | |
0 | |
0 | |
| Missouri | District | 14 | 12 | |
2 | |
0 | |
| Nebraska | District | 3 | 0 | |
3 | |
0 | |
| Nevada | At-large | 1 | 0 | |
1 | |
0 | |
| New Hampshire | District | 2 | 0 | |
2 | |
0 | |
| New Jersey | District | 7 | 3 | |
4 | |
0 | |
| New York | District[Note 6] | 34 | 17[Note 5] | |
17 | |
0 | |
| North Carolina | District[Note 6] | 9 | 8 | |
1 | |
0 | |
| Ohio[Note 8] | District | 21 | 11 | |
10 | |
0 | |
| Oregon[Note 8] | At-large | 1 | 0 | |
1 | |
0 | |
| Pennsylvania | District + at-large |
28 | 8 | |
20 | |
0 | |
| Rhode Island | District | 2 | 0 | |
2 | |
0 | |
| South Carolina | District | 7 | 6 | |
1 | |
0 | |
| Tennessee | District | 10 | 7 | |
3 | |
0 | |
| Texas | District | 11 | 11 | |
0 | |
0 | |
| Vermont[Note 8] | District | 2 | 0 | |
2 | |
0 | |
| Virginia | District[Note 6] | 10 | 8 | |
2 | |
0 | |
| West Virginia | District | 4 | 3 | |
1 | |
0 | |
| Wisconsin | District | 9 | 2 | |
7 | |
0 | |
| Total | 325 | 183[1][Note 5] 56.3% |
|
141[1] 43.4% |
|
1[1] 0.6% |
| |
[[Image:49 us house membership.png|thumb|left|350px|
]] |
[[Image:49 us house changes.png|thumb|left|350px|
]] | ||||||||||||||||||
Early election dates
In 1884, four states, with 28 seats among them, held elections early:
Complete returns
Party abbreviations
- D: Democratic
- I: Independent
- IR: Independent Republican
- Pop: Populist
- Pr: Prohibition
- R: United States
California
Two new districts were created for the seats gained in the 1882 reapportionment, eliminating the at-large district that had been created for them.
| District | Incumbent | Party | First elected |
Result | Candidates |
|---|---|---|---|---|---|
| California 1 | Barclay Henley Redistricted from 2nd district |
Democratic | 1882 | Re-elected | Barclay Henley (D) 49.7% Thomas L. Carothers (R) 49.3% C. C. Bateman (Pr) 1% |
| California 2 | Charles A. Sumner Redistricted from the at-large district |
Democratic | 1882 | Lost re-election Republican gain |
James A. Louttit (R) 49.4% Charles A. Sumner (D) 49.1% Joshua B. Webster (Pr) 1.5% |
| California 3 | John R. Glascock Redistricted from the at-large district |
Democratic | 1882 | Lost re-election Republican gain |
Joseph McKenna (R) 55.8% John R. Glascock (D) 42.3% Joshua B. Wills (Pr) 1% A. B. Burns (Pop) 0.9% |
| California 4 | William Rosecrans Redistricted from 1st district |
Democratic | 1880 | Retired Republican gain |
William W. Morrow (R) 58.8% R. P. Hastings (D) 40.7% H. S. Fitch (Pop) 0.5% George Babcock (Pr) 0.0% |
| California 5 | Pleasant B. Tully Redistricted from 4th district |
Democratic | 1882 | Retired Republican gain |
Charles N. Felton (R) 48.8% Frank J. Sullivan (D) 48.4% C. Henderson (Pr) 1.4% A. E. Redstone (I) 1.4% |
| California 6 | None (District created) | New seat Republican gain |
Henry H. Markham (R) 49.1% R. F. Del Valle (D) 47.9% Will D. Gould (Pr) 2.3% Isaac Kinley (Pop) 0.7% | ||
Florida
| District | Incumbent | Party | First elected |
Result | Candidates |
|---|---|---|---|---|---|
| Florida 1 | Robert H. M. Davidson | Democratic | 1876 | Re-elected | Robert H. M. Davidson (D) 55.1% Eugene O. Locke (R) 44.9% |
| Florida 2 | Horatio Bisbee, Jr. | Republican | 1880 | Lost re-election Democratic gain |
Charles Dougherty (D) 51.8% Horatio Bisbee, Jr. (R) 47.6% Josiah T. Walls (IR) 0.6% |
South Carolina
| District | Incumbent | Party | First elected |
Result | Candidates |
|---|---|---|---|---|---|
| South Carolina 1 | Samuel Dibble | Democratic | 1882 | Re-elected | Samuel Dibble (D) 73.5% W. N. Taft (R) 26.5% |
| South Carolina 2 | George D. Tillman | Democratic | 1878 | Re-elected | George D. Tillman (D) 84.4% E. J. Dickerson (R) 14.2% Others 1.4% |
| South Carolina 3 | D. Wyatt Aiken | Democratic | 1876 | Re-elected | D. Wyatt Aiken (D) 93.5% John R. Tolbert (R) 6.5% |
| South Carolina 4 | Previous incumbent John H. Evins (D) died on October 20, 1884 | Democratic hold | William H. Perry (D) 99.4% Others 0.6% | ||
| South Carolina 5 | John J. Hemphill | Democratic | 1882 | Re-elected | John J. Hemphill (D) 74.5% C. C. Macoy (R) 21.8% Others 3.7% |
| South Carolina 6 | George W. Dargan | Democratic | 1882 | Re-elected | George W. Dargan (D) 74.0% Edmund H. Deas (R) 23.3% Others 2.7% |
| South Carolina 7 | Robert Smalls | Republican | 1884 (special) | Re-elected | Robert Smalls (R) 63.6% William Elliott (D) 34.6% Others 1.8% |
See also
Notes
- ↑ Four states held early elections between June 2 and October 14.
- ↑ Included 3 Independent Democrats.
- ↑ Included 1 Independent Republican.
- 1 2 3 Dubin (p. 271) counts 182 Democrats, 142 Republicans, and 1 Greenback at the start of the 49th United States Congress.
- 1 2 3 Includes 1 Independent Democrat, Truman A. Merriman of NY-11.
- 1 2 3 4 5 6 7 At-large seats eliminated in redistricting.
- 1 2 Greenback Party
- 1 2 3 4 Elections held early.
- ↑ Changed from at-large.
- 1 2 Independent in previous election.
- ↑ Readjuster Party
References
Bibliography
- Dubin, Michael J. (March 1, 1998). United States Congressional Elections, 1788-1997: The Official Results of the Elections of the 1st Through 105th Congresses. McFarland and Company. ISBN 978-0786402830.
- Martis, Kenneth C. (January 1, 1989). The Historical Atlas of Political Parties in the United States Congress, 1789-1989. Macmillan Publishing Company. ISBN 978-0029201701.
- Moore, John L., ed. (1994). Congressional Quarterly's Guide to U.S. Elections (Third ed.). Congressional Quarterly Inc. ISBN 978-0871879967.
- "Party Divisions of the House of Representatives* 1789–Present". Office of the Historian, House of United States House of Representatives. Retrieved January 21, 2015.
External links
- Office of the Historian (Office of Art & Archives, Office of the Clerk, U.S. House of Representatives)