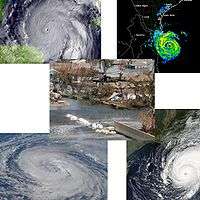
2005 Atlantic hurricane season statistics
The 2005 Atlantic hurricane season broke numerous records for cyclonic formation and intensity. It saw a total of thirty-one tropical and subtropical cyclones form, many of which broke records as individual storm as well as contributing to a number of season records. This article is an in-depth look at the statistics of the 2005 Atlantic hurricane season.
There were 8 hurricanes, 7 of them reached major strength, the remaining a Category 1.
| Related articles |
|---|
Number of storms
The 2005 Atlantic hurricane season, with 28 nameable storms (wind speed ≥ 39 mph), is the most active season on record, surpassing the 1933 season's 20 nameable storms.[1][2] With 15 hurricanes, the 2005 season also has had the most hurricanes formed, surpassing the 1969 season's 12. The season holds the record for the most major hurricanes, seven, tied the 1999 season's record of five Category 4 and 5 hurricanes and holds the record for the most Category 5 hurricanes in a single season, four (see below).

With the formation of Tropical Storm Vince, Tropical Storm Wilma, and Tropical Storm Alpha, 2005 became the first season to use the 'V', 'W' and Greek Letter names, respectively, since naming of Atlantic storms began in the 1950 season.[1] It also has the distinction of being only the second season to use the 'R', 'S', and 'T' names. Only the 1995 season had previously used these letters.[3]
2005 holds the record for the most storms to ever form during the month of July. Five storms (Cindy, Dennis, Emily, Franklin, and Gert) formed during that period. The previous record for most storms to form in the month of July was four; this record was held by the 1966 and 1995 seasons.[2] The number of storms before the end of July (seven) is also a record, breaking the record of five set in the 1887, 1933, 1936, 1959, 1966, and 1995 seasons.[2]
2005 and 1933 share the record for the most storms (17) forming before the end of September. The 2005 season now also holds the record for most storms (24) forming before the end of October (but not the record for within the month itself, the 1950 season had eight storms). 2005 also broke the record for most storms forming in November, with 3 storms (Gamma, Delta and Epsilon).[4]
Total activity
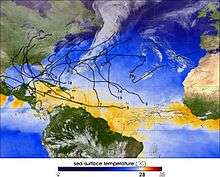
Tropical activity during the 2005 season was unusually continuous from start to finish, unlike most hurricane seasons, which have significant quiet periods. Out of the 26 weeks in the hurricane season, just two had no tropical cyclones active at some point (the weeks of June 19 and November 6). For a 126-day stretch (June 28–October 31), only 16 didn't have a storm active and never more than three consecutive. There was record or near-record activity in every month of the season except for June.[2] The 2005 season was the first time since reliable measurements began that the Atlantic basin recorded more tropical storms than the Western Pacific Ocean, which is typically the most active basin worldwide.
Statistics
This table gives the number of storms by month of formation and storm category on the Saffir-Simpson Hurricane Scale. The meanings of the one-letter (or number) categories can be ascertained by placing the cursor on that heading.
Entries which are bolded surpassed or tied records established by previous seasons.
| Month | # Storms of class | # Storms at least of class | |||||||||||||
|---|---|---|---|---|---|---|---|---|---|---|---|---|---|---|---|
| D | S | 1 | 2 | 3 | 4 | 5 | D | S | 1 | 2 | 3 | 4 | 5 | ||
| Jan-May | 0 | 0 | 0 | 0 | 0 | 0 | 0 | 0 | 0 | 0 | 0 | 0 | 0 | 0 | |
| June | 0 | 2 | 0 | 0 | 0 | 0 | 0 | 2 | 2 | 0 | 0 | 0 | 0 | 0 | |
| July | 0 | 2 | 1 | 0 | 0 | 1 | 1 | 5 | 5 | 3 | 2 | 2 | 2 | 1 | |
| August | 1 | 3 | 0 | 1 | 0 | 0 | 1 | 6 | 5 | 2 | 2 | 1 | 1 | 1 | |
| September | 1 | 0 | 3 | 0 | 1 | 0 | 1 | 6 | 5 | 5 | 2 | 2 | 1 | 1 | |
| October | 1 | 3 | 2 | 0 | 1 | 0 | 1 | 8 | 7 | 4 | 2 | 2 | 1 | 1 | |
| November | 0 | 2 | 1 | 0 | 0 | 0 | 0 | 3 | 3 | 1 | 0 | 0 | 0 | 0 | |
| December | 0 | 1 | 0 | 0 | 0 | 0 | 0 | 1 | 1 | 0 | 0 | 0 | 0 | 0 | |
| Season | 3 | 13 | 7 | 1 | 2 | 1 | 4 | 31 | 28 | 15 | 8 | 7 | 5 | 4 | |
Strongest storms
| Most intense Atlantic hurricanes | |||||
|---|---|---|---|---|---|
| Rank | Hurricane | Season | Pressure | ||
| hPa | inHg | ||||
| 1 | Wilma | 2005 | 882 | 26.05 | |
| 2 | Gilbert | 1988 | 888 | 26.23 | |
| 3 | "Labor Day" | 1935 | 892 | 26.34 | |
| 4 | Rita | 2005 | 895 | 26.43 | |
| 5 | Allen | 1980 | 899 | 26.55 | |
| 6 | Camille | 1969 | 900 | 26.58 | |
| 7 | Katrina | 2005 | 902 | 26.64 | |
| 8 | Mitch | 1998 | 905 | 26.73 | |
| Dean | 2007 | ||||
| 10 | "Cuba" | 1924 | 910 | 26.88 | |
| Ivan | 2004 | ||||
| Source: HURDAT[4] | |||||
Hurricane Katrina was briefly the fourth most intense Atlantic hurricane on record, with a minimum central pressure of 902 mbar on August 28.[5] It was surpassed by hurricanes Rita[6] and Wilma[7] later that season.
Hurricane Rita became the third most intense Atlantic hurricane and the most intense hurricane on record in the Gulf of Mexico after reaching a pressure of 895 mbar on September 21.[6] It was surpassed by Wilma later in the season.[7]
Hurricane Wilma became the most intense North Atlantic hurricane in recorded history shortly before 5:00 am EDT on October 18, when the central pressure was measured at 884 mbar.[7] At 8:00 am EDT, Wilma continued to intensify, reaching 882 mbar.[7] Wilma also holds the record of being the only storm recorded in the Atlantic basin to have a minimum central pressure below 900 mbar without also having Category 5 winds: on October 20 its winds were 155 mph and its central pressure was 894 mbar.[7] Katrina, Rita and Wilma are the three most intense storms ever in a single Atlantic hurricane season.
2005 was the first time two storms recorded pressures below 900 millibars in a single season (Rita, 895; and Wilma, 882).[4]
Hurricane Wilma also underwent the most rapid deepening for a 24-hour period ever measured.[7] At noon on October 18, Wilma had a central pressure of 980 mbar (28.93 inches). At noon on October 19, Wilma had a central pressure of 882 mbar (26.04 inches), a pressure fall of 98 mbar (2.89 inches),[7] breaking the previous record of 92 mbar (2.71 inches) set by Super Typhoon Forrest in the Western Pacific in 1983.[8] Some sources, however, say that Forrest's pressure was lower than originally measured (876 mbar instead of 883 mbar). This would imply that Forrest retains the record with a pressure fall of 100 mbar in 24 hours, and thus this uncertainty is noted here.
In addition, Hurricane Dennis and Hurricane Emily, both in July, reached 930 mbar[9] and 929 mbar[10] respectively, becoming the two strongest storms on record in July.[4]
Katrina was also the third most intense hurricane on record to make landfall in the United States in terms of pressure (920 mbar), behind the Labor Day Hurricane of 1935 and Hurricane Camille in 1969.[5][4]
When Emily reached Category 5 intensity on July 16, it became the earliest Category 5 hurricane ever, shattering the record set by Hurricane Allen in the 1980 season.[4][10] When Katrina reached Category 5 intensity on August 28, it became only the third time in recorded history (and the first time since the 1961 season) that there had been two Category 5 hurricanes in a single season.[5][4] When Rita reached Category 5 intensity on September 21, 25 days after Katrina, the 2005 season became the first that had three Category 5 storms.[6][4] When Wilma became a Category 5 storm on October 19, the 2005 season doubled the record set by the 1960 and 1961 seasons, becoming the first that had four Category 5 storms.[4][11]
Rapid formation
Almost every storm in 2005 has set a record for early formation. The table shows the dates on which each storm formed, and the old record for earliest-forming storm of that number.
| Storm # | Formation Day | Name | Previous Record | Difference |
|---|---|---|---|---|
| 1 | June 9 | Arlene | January 3, 1938 | +157 days |
| 2 | June 28 | Bret | May 17, 1887 | +42 days |
| 3 | July 5 | Cindy | June 11, 1887 | +24 days |
| 4 | July 5 | Dennis† | Cindy - July 7, 1959 | -2 days |
| 5 | July 11 | Emily | Danny - July 16, 1997 | -5 days |
| 6 | July 21 | Franklin | August 4, 1936 | -14 days |
| 7 | July 24 | Gert | August 7, 1936 | -14 days |
| 8 | August 3 | Harvey | August 15, 1936 | -12 days |
| 9 | August 7 | Irene | August 20, 1936 | -13 days |
| 10 | August 22 | Jose | Jerry - August 23, 1995 | -1 day |
| 11 | August 24 | Katrina | August 28, 1936/ Karen - 1995 | -4 days |
| 12 | August 31 | Lee | Luis - August 29, 1995 | +2 days |
| 13 | September 2 | Maria | September 8, 1936 | -6 days |
| 14 | September 5 | Nate | September 10, 1936 | -5 days |
| 15 | September 7 | Ophelia | September 18, 1936 | -11 days |
| 16 | September 17 | Philippe | October 1, 1933 | -14 days |
| 17 | September 18 | Rita | October 1, 1933 | -13 days |
| 18 | October 2 | Stan | October 25, 1933 | -23 days |
| 19 | October 4 | Unnamed | October 26, 1933 | -22 days |
| 20 | October 5 | Tammy | November 15, 1933 | -41 days |
| 21 | October 8 | Vince | none | N/A |
| 22 | October 17 | Wilma | none | N/A |
| 23 | October 22 | Alpha | none | N/A |
| 24 | October 27 | Beta | none | N/A |
| 25 | November 18 | Gamma | none | N/A |
| 26 | November 23 | Delta | none | N/A |
| 27 | November 29 | Epsilon | none | N/A |
| 28 | December 29 | Zeta | none | N/A |
† Hurricane Dennis was later surpassed by Tropical Storm Debby in 2012, which developed on June 23, which was surpassed by Tropical Storm Danielle in 2016.
Season effects
This is a table of all of the storms that formed in the 2005 Atlantic hurricane season. It includes their duration, names, damages, and death totals. Damage and deaths include totals while the storm was extratropical or a wave or low, and all of the damage figures are in 2005 USD.
| Saffir–Simpson hurricane wind scale | ||||||
| TD | TS | C1 | C2 | C3 | C4 | C5 |
| Storm name |
Dates active | Storm category
at peak intensity |
Max 1-min wind mph (km/h) |
Min. press. (mbar) |
Areas affected | Damage (millions USD) |
Deaths | |||
|---|---|---|---|---|---|---|---|---|---|---|
| Arlene | June 8 – June 13 | Tropical storm | 70 (110) | 989 | Cayman Islands, Cuba, United States Gulf Coast (Florida), Central United States | 11.8 | 1 | |||
| Bret | June 28 – June 29 | Tropical storm | 40 (65) | 1002 | Mexico (Veracruz) | 9.3 | 1 | |||
| Cindy | July 3 – July 7 | Category 1 hurricane | 75 (120) | 991 | Yucatan Peninsula, United States Gulf Coast (Louisiana), Eastern United States | 320 | 5 | |||
| Dennis | July 4 – July 13 | Category 4 hurricane | 150 (240) | 930 | Lesser Antilles (Grenada), Greater Antilles (Cuba), United States Gulf Coast (Florida), Central United States | 3,977 | 88 | |||
| Emily | July 10 – July 21 | Category 5 hurricane | 160 (260) | 929 | Windward Islands (Grenada), Jamaica, Yucatan Peninsula, Northeastern Mexico (Tamaulipas), South Texas | 1,014 | 17 | |||
| Franklin | July 21 – July 29 | Tropical storm | 70 (110) | 997 | The Bahamas, Bermuda, Newfoundland | None | 0 | |||
| Gert | July 23 – July 25 | Tropical storm | 45 (75) | 1005 | Mexico (Veracruz) | 6 | 1 | |||
| Harvey | August 2 – August 8 | Tropical storm | 65 (100) | 994 | Bermuda | None | 0 | |||
| Irene | August 4 – August 14 | Category 2 hurricane | 105 (165) | 970 | East Coast of the United States | None | 1 | |||
| Ten | August 13 – August 14 | Tropical depression | 35 (55) | 1008 | None | None | 0 | |||
| Jose | August 22 – August 23 | Tropical storm | 60 (95) | 998 | Mexico (Veracruz) | 45 | 8 | |||
| Katrina | August 23 – August 30 | Category 5 hurricane | 175 (280) | 902 | The Bahamas, Florida, Cuba, United States Gulf Coast (Louisiana, Mississippi), Central United States, New England | 108,000 | 1,836 | |||
| Lee | August 28 – September 2 | Tropical storm | 40 (65) | 1006 | None | None | 0 | |||
| Maria | September 1 – September 10 | Category 3 hurricane | 115 (185) | 962 | New Jersey, Iceland, Scotland, Norway | 3.1 | 4 | |||
| Nate | September 5 – September 10 | Category 1 hurricane | 90 (150) | 979 | Bermuda, New Jersey | None | 1 | |||
| Ophelia | September 6 – September 17 | Category 1 hurricane | 85 (140) | 976 | East Coast of the United States, Atlantic Canada | 70 | 3 | |||
| Philippe | September 17 – September 23 | Category 1 hurricane | 80 (130) | 985 | None | None | 0 | |||
| Rita | September 18 – September 26 | Category 5 hurricane | 180 (285) | 895 | The Bahamas, Florida, Cuba, United States Gulf Coast (Louisiana), Central United States | 12,037 | 125 | |||
| Nineteen | September 30 – October 2 | Tropical depression | 35 (55) | 1006 | None | None | 0 | |||
| Stan | October 1 – October 5 | Category 1 hurricane | 80 (130) | 977 | Mexico (Quintana Roo, Veracruz), Central America | 3,900 | 1,628 | |||
| Unnamed | October 4 – October 5 | Subtropical storm | 50 (85) | 997 | Azores | None | 0 | |||
| Tammy | October 5 – October 6 | Tropical storm | 50 (85) | 1001 | Southeastern United States (Florida) | 30 | 0 | |||
| Twenty-Two | October 8 – October 10 | Subtropical depression | 35 (55) | 1008 | Mid-Atlantic states | None | 0 | |||
| Vince | October 8 – October 11 | Category 1 hurricane | 75 (120) | 988 | Madeira, Spain, Portugal | Minimal | 0 | |||
| Wilma | October 15 – October 26 | Category 5 hurricane | 185 (295) | 882 | Jamaica, Haiti, Honduras, Mexico (Quintana Roo), Cuba, Florida, The Bahamas | 29,401 | 62 | |||
| Alpha | October 22 – October 24 | Tropical storm | 50 (85) | 998 | Hispaniola | N/A | 26 | |||
| Beta | October 26 – October 31 | Category 3 hurricane | 115 (185) | 962 | Panama, San Andrés and Providencia, Nicaragua, Honduras | 15.5 | 9 | |||
| Gamma | November 14 – November 22 | Tropical storm | 50 (85) | 1002 | Lesser Antilles, Honduras, Belize | 18 | 39 | |||
| Delta | November 22 – November 29 | Tropical storm | 70 (110) | 980 | Canary Islands, Morocco, Algeria | 364 | 7 | |||
| Epsilon | November 29 – December 8 | Category 1 hurricane | 85 (140) | 981 | None | None | 0 | |||
| Zeta | December 29 – January 6 | Tropical storm | 65 (100) | 994 | None | None | 0 | |||
| Season Aggregates | ||||||||||
| 31 cyclones | June 8, 2005 – January 6, 2006 | 185 (295) | 882 | 159,221.7 | 3,913 | |||||
Accumulated Cyclone Energy (ACE)
| ACE (104kt²) (Source) — Storm: | |||||
|---|---|---|---|---|---|
| 1 | 38.9 | Wilma | 15 | 5.95 | Philippe |
| 2 | 32.9 | Emily | 16 | 5.39 | Harvey |
| 3 | 25.1 | Rita | 17 | 2.68 | Vince |
| 4 | 20.0 | Katrina | 18 | 2.56 | Arlene |
| 5 | 18.8 | Dennis | 19 | 2.36 | Stan |
| 6 | 15.7 | Ophelia | 20 | 1.52 | Cindy |
| 7 | 14.3 | Maria | 21 | 1.33 | Gamma |
| 8 | 13.4 | Epsilon | 22 | 0.810 | Tammy |
| 9 | 13.1 | Irene | 23 | 0.650 | Alpha |
| 10 | 7.17 | Nate | 24 | 0.528 | Gert |
| 11 | 6.72 | Franklin | 0.528 | Unnamed | |
| 12 | 6.47 | Beta | 26 | 0.448 | Jose |
| 13 | 6.27 | Zeta | 27 | 0.368 | Bret |
| 14 | 6.02 | Delta | 28 | 0.245 | Lee |
| Total: 250 | |||||
The table to the right shows the tropical storms of the 2005 season ranked from highest to lowest Accumulated Cyclone Energy (ACE), given to three significant figures. The total for the season was 248 x 104 kt2 which is the highest seasonal ACE value recorded. It is slightly higher than that for 1950 season which had an ACE of 243 x 104 kt2. ( the final storm of the season, Zeta, lasted into 2006. In calculating the seasonal ACE, the whole ACE of Zeta, including the contribution made in 2006, was used.)
ACE measures a combination of both the strength and duration of a tropical cyclone, so longer-lasting storms may accumulate more ACE than stronger storms with shorter durations. This discrepancy is most obvious in the comparatively high ACE value of Hurricane Emily to Hurricanes Katrina and Rita: Emily was not as strong as either storm, but formed out in the Atlantic and made a long track across the Caribbean Sea before making landfall. Katrina and Rita, however, both developed in the Bahamas, close to the U.S. mainland, and lasted for much shorter periods of time. In addition, Ophelia and Epsilon are high for their intensity because they maintained themselves for a long period of time and were slow to build and dissipate, as neither was ever more intense than a Category 1 storm.
The average ACE per storm in 2005 was actually close to the seasonal average. In comparison with previous seasons with high seasonal ACE values, relatively few strong, long-lasting storms, such as Cape Verde-type hurricanes, formed. Thus, although the number of named storms in 2005 was about 40% greater than that in any season since 1950, the seasonal ACE was only marginally greater than the previous record, set in 1950 itself, when the average ACE per storm was approximately double that of 2005.
Source: Best Track data from the Tropical Cyclone Reports.[12]
Other records
Hurricane Vince developed in an unusual location in the northeastern Atlantic,[13] well away from where tropical cyclones are usually found,[14] though it is neither the most northerly-forming nor the most easterly-forming Atlantic tropical storm.[4] It did, however, develop into a hurricane further east than any known storm, at 18.9° W. The National Hurricane Center declared that Vince was the first tropical cyclone on record to have made landfall on the Iberian Peninsula.[14]
In the spring of 2006, the World Meteorological Organization retired five hurricane names: Dennis, Katrina, Rita, Stan, and Wilma. Their replacements in the 2011 season were Don, Katia, Rina, Sean, and Whitney, respectively.[15] This surpassed the previous record for the number of hurricane names retired after a single season, four (held by the 1955, 1995, and 2004 seasons).[16] The name Emily was not retired at the end of the season, making Hurricane Emily only the fourth Category 5 hurricane since 1953 to not have its name retired (Hurricane Dog of 1950 and Hurricane Easy of 1951 are omitted, as the phonetic alphabet was used from 1950–1952). The others were Hurricane Edith (1971), Hurricane Ethel (1960), and Hurricane Cleo (1958), although the name Cleo was retired in 1964 due to another storm.[16] Due to reanalysis, it was determined that Ethel and Cleo did not peak as category 5 hurricanes, making Emily the second category 5 not to be retired, following Ethel.
Tropical Storm Zeta was one of only two Atlantic systems to exist in two calendar years (the other was Hurricane Alice in 1954-55). It was also one of four to exist in the month of January (the other three being Alice, Hurricane Alex of 2016, and a subtropical storm in 1978).
Notes
- 1 2 NOAA (2006-04-13). "NOAA Reviews Record-Setting 2005 Atlantic Hurricane Season". National Oceanic and Atmospheric Administration. Archived from the original on 23 April 2006. Retrieved 2006-04-26.
- 1 2 3 4 National Climatic Data Center (2006-08-21). "Climate of 2005 Atlantic Hurricane Season". NOAA. Retrieved 2008-08-08.
- ↑ National Hurricane Center (1998-12-26). "The 1995 Atlantic Hurricane Season". NOAA. Retrieved 2008-08-08.
- 1 2 3 4 5 6 7 8 9 10 11 National Hurricane Center; Hurricane Research Division (July 6, 2016). "Atlantic hurricane best track (HURDAT version 2)". United States National Oceanic and Atmospheric Administration. Retrieved December 5, 2016.
- 1 2 3 Knabb, Richard D.; Rhome, Jamie D.; Brown, Daniel P. (2005-12-20). "Tropical Cyclone Report: Hurricane Katrina" (PDF). NOAA. Archived (PDF) from the original on 24 May 2006. Retrieved 2006-05-21.
- 1 2 3 Knabb, Richard D.; Rhome, Jamie D.; Brown, Daniel P. (2006-03-17). "Tropical Cyclone Report: Hurricane Rita" (PDF). NOAA. Archived (PDF) from the original on 24 May 2006. Retrieved 2006-05-21.
- 1 2 3 4 5 6 7 Richard J. Pasch; Eric S. Blake; Hugh D. Cobb III; David P. Roberts (2006-01-12). "Tropical Cyclone Report: Hurricane Wilma" (PDF). NOAA. Archived (PDF) from the original on 24 May 2006. Retrieved 2006-05-21.
- ↑ Joint Typhoon Warning Center. Super Typhoon Forrest. Retrieved on 2007-01-06.
- ↑ National Hurricane Center (2005). "Tropical Cyclone Report: Hurricane Dennis" (PDF). NOAA. Archived (PDF) from the original on 18 February 2006. Retrieved 2006-02-14.
- 1 2 National Hurricane Center (2006). "Tropical Cyclone Report: Hurricane Emily" (PDF). NOAA. Archived (PDF) from the original on 18 March 2006. Retrieved 2006-03-13.
- ↑ National Hurricane Center (2006). "Tropical Cyclone Report: Hurricane Wilma" (PDF). NOAA. Retrieved 2006-02-14.
- ↑ List of Tropical Cyclone Reports for the 2005 AHS
- ↑ Knabb (2005-10-09). "Tropical Storm Vince Advisory Number 1". National Hurricane Center. Archived from the original on 24 September 2008. Retrieved 2008-10-11.
- 1 2 James L. Franklin (2006-02-22). "Tropical Cyclone Report: Hurricane Vince" (PDF). NOAA. Archived (PDF) from the original on 24 May 2006. Retrieved 2006-05-04.
- ↑ NOAA (2006). "Dennis, Katrina, Rita, Stan and Wilma "Retired" From List of Storm Names". Archived from the original on 7 April 2006. Retrieved 2006-04-06.
- 1 2 "Faq : Hurricanes, Typhoons, And Tropical Cyclones". HURDAT. Retrieved 2008-09-25.
References
- NHC/TPC monthly Atlantic storm summaries for 2005
- NHC/TPC storm advisory archives
- NHC/TPC Tropical Cyclone Reports for 2005
- Unisys 2005 Atlantic hurricane season data
- Dr. Gray's forecast verification for 2005 (including storm descriptions through Beta)
- Cory Pesaturo’s 2005 Atlantic Hurricane Season Records