Danish general election, 1966
Danish general election, 1966
|
|
|
|
All 179 seats to the Folketing
90 seats were needed for a majority |
| Turnout |
88.2% |
| |
First party |
Second party |
Third party |
| |
 |
 |
|
| Leader |
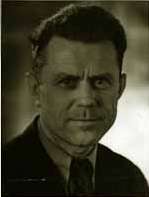
Jens Otto Krag |
Poul Hartling |
Poul Sørensen |
| Party |
Social Democrats |
Venstre |
Conservative People's |
| Last election |
76 seats, 41.9% |
38 seats, 20.8% |
36 seats, 20.1% |
| Seats won |
69 |
35 |
34 |
| Seat change |
 7 7 |
3 |
2 |
| Popular vote |
1,068,911 |
539,027 |
522,028 |
| Percentage |
38.2% |
19.3% |
18.7% |
|
| |
Fourth party |
Fifth party |
Sixth party |
| |
 |
|
|
| Leader |
Aksel Larsen |
Karl Skytte |
Bent Noack |
| Party |
Socialist People's |
Social Liberals |
Liberal Centre |
| Last election |
10 seats, 5.8% |
10 seats, 5.3% |
New |
| Seats won |
20 |
13 |
4 |
| Seat change |
 10 10 |
3 |
4 |
| Popular vote |
304,437 |
203,858 |
69,180 |
| Percentage |
10.9% |
7.3% |
2.5% |
|
|
|
General elections were held in Denmark on 22 November 1966,[1] although in Greenland the elections were held on 6 December 1966. The Social Democratic Party remained the largest in the Folketing, with 69 of the 179 seats. Voter turnout was 88.6% in Denmark proper, 48.8% in the Faroe Islands and 59.0% in Greenland (where only one of the two constituencies was contested as the other had only one candidate who was elected unopposed).[2]
Results
| Denmark |
|---|
| Party |
Votes |
% |
Seats |
+/– |
| Social Democratic Party | 1,068,911 | 38.2 | 69 | –7 |
| Venstre | 539,027 | 19.3 | 35 | –3 |
| Conservative People's Party | 522,028 | 18.7 | 34 | –2 |
| Socialist People's Party | 304,437 | 10.9 | 20 | +10 |
| Danish Social Liberal Party | 203,858 | 7.3 | 13 | +3 |
| Liberal Centre | 69,180 | 2.5 | 4 | New |
| Independent Party | 44,994 | 1.6 | 0 | –5 |
| Communist Party of Denmark | 21,553 | 0.8 | 0 | 0 |
| Justice Party of Denmark | 19,905 | 0.7 | 0 | 0 |
| Independents | 114 | 0.0 | 0 | 0 |
| Invalid/blank votes | 8,297 | – | – | – |
| Total | 2,802,304 | 100 | 175 | 0 |
| Faroe Islands |
| Social Democratic Party | 3,864 | 36.6 | 1 | 0 |
| People's Party | 3,549 | 33.6 | 1 | +1 |
| Union Party | 3,156 | 29.9 | 0 | –1 |
| Invalid/blank votes | 52 | – | – | – |
| Total | 10,621 | 100 | 2 | 0 |
| Greenland |
| Independents | 6,522 | 100 | 2 | 0 |
| Invalid/blank votes | 138 | – | – | – |
| Total | 6,660 | 100 | 2 | 0 |
| Source: Nohlen & Stöver |
| Popular vote |
|---|
|
|
|
|
|
| A |
|
38.26% |
| D |
|
19.29% |
| C |
|
18.68% |
| F |
|
10.90% |
| B |
|
7.30% |
| L |
|
2.48% |
| U |
|
1.61% |
| K |
|
0.77% |
| E |
|
0.71% |
| Others |
|
0.00% |
By constitutency
| Candidate |
Party |
Votes |
% |
Notes |
|---|
| Greenland (Northern Constituency) |
| Knud Hertling | Independent | Uncontested | Elected |
| Greenland (Southern Constituency) |
| Nikolaj Rosing | Independent | 3,677 | 56.3 | Elected |
| Ulrik Rosing | Inuit Party | 1,367 | 20.9 | |
| Erling Høegh | Independent | 1,291 | 19.8 |
| Jørgen Olsen | Independent | 200 | 3.1 |
| Invalid/blank votes | 130 | – |
| Total | 6,665 | 100 |
| Source: Atuagagdliutit[3] |
References
- ↑ Nohlen, D & Stöver, P (2010) Elections in Europe: A data handbook, p524 ISBN 978-3-8329-5609-7
- ↑ Nohlen & Stöver, pp542-543
- ↑ Atuagagdliutit/Grønlandsposten 9 December 1966, p. 3