Danish general election, 1988
Danish general election, 1988

|
|
|
|
|
|
|
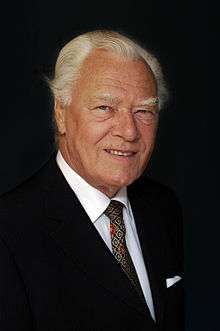
General elections were held in Denmark on 10 May 1988,[1] just seven months after the last elections. Prime Minister Poul Schlüter chose to call for an election after the Conservative People's Party-led government fell short of a majority in a foreign policy issue after they failed to come to an agreement with the Social Democrats. In a parliamentary debate Prime Minister Poul Schlüter accused the leader of the Social Democrats, Svend Auken, of breaking a political deal between the two of them, whilst Auken accused Schlüter of lying to the public.
However, the election did not change the balance of power in the Folketing. Common Course failed to cross the 2% percent threshold and lost their four seats. The Centre Democrats and the Christian People's Party left the government (although they continued to support it) and were replaced by the Danish Social Liberal Party. The reason for doing this was that it gave Schlüter a majority in foreign policy issues, which had caused this election. The Centre Democrats and Christian People's Party continued to support the government though.
Voter turnout was 85.7% in Denmark proper, 70.3% in the Faroe Islands and 57.9% in Greenland.[2]
Results
| Denmark |
|---|
| Party |
Votes |
% |
Seats |
+/– |
| Social Democratic Party | 992,682 | 29.8 | 55 | +1 |
| Conservative People's Party | 642,048 | 19.3 | 35 | –3 |
| Socialist People's Party | 433,261 | 13.0 | 24 | –3 |
| Venstre | 394,190 | 11.8 | 22 | +3 |
| Progress Party | 298,132 | 9.0 | 16 | +7 |
| Danish Social Liberal Party | 185,707 | 5.6 | 10 | –1 |
| Centre Democrats | 155,464 | 4.7 | 9 | 0 |
| Christian People's Party | 68,047 | 2.0 | 4 | 0 |
| Common Course | 63,263 | 1.9 | 0 | –4 |
| De Grønne | 44,960 | 1.4 | 0 | 0 |
| Communist Party of Denmark | 27,439 | 0.8 | 0 | 0 |
| Left Socialists | 20,303 | 0.6 | 0 | 0 |
| Independents | 3,633 | 0.1 | 0 | 0 |
| Invalid/blank votes | 23,522 | – | – | – |
| Total | 3,352,651 | 100 | 175 | 0 |
| Faroe Islands |
| People's Party | 5,655 | 24.7 | 1 | 0 |
| Union Party | 5,597 | 24.4 | 1 | +1 |
| Social Democratic Party | 4,861 | 21.2 | 0 | –1 |
| Republican Party | 4,690 | 20.5 | 0 | 0 |
| Self-Government Party | 897 | 3.9 | 0 | 0 |
| Christian People's Party | 891 | 3.9 | 0 | 0 |
| Progress Party | 321 | 1.4 | 0 | 0 |
| Invalid/blank votes | 100 | – | – | – |
| Total | 23,012 | 100 | 2 | 0 |
| Greenland |
| Siumut | 8,415 | 40.1 | 1 | 0 |
| Solidarity | 8,135 | 38.7 | 1 | 0 |
| Inuit Ataqatigiit | 3,628 | 17.3 | 0 | 0 |
| Polar Party | 821 | 3.9 | 0 | 0 |
| Invalid/blank votes | 1,169 | – | – | – |
| Total | 22,168 | 100 | 2 | 0 |
| Source: Nohlen & Stöver |
| Popular vote |
|---|
|
|
|
|
|
| A |
|
29.82% |
| C |
|
19.29% |
| F |
|
13.01% |
| V |
|
11.84% |
| Z |
|
8.96% |
| B |
|
5.58% |
| D |
|
4.67% |
| Q |
|
2.04% |
| P |
|
1.90% |
| G |
|
1.35% |
| K |
|
0.82% |
| Y |
|
0.61% |
| Others |
|
0.11% |
References
- ↑ Nohlen, D & Stöver, P (2010) Elections in Europe: A data handbook, p. 525 ISBN 978-3-8329-5609-7
- ↑ Nohlen & Stöver, p547
Further reading
- Jespersen, Mary P. S. "A Danish Defence Dilemma: The Election of May 1988," West European Politics (1989) 12#1 pp. 189-195

