List of Chinese prefecture-level cities by GDP
This is a list of direct-controlled municipalities and provincial cities (in Mainland China) by gross domestic product (GDP).
Methodology
Shown here are 2013 GDP figures publicized in provincial-level Statistical Yearbooks or official statistical communiques.
All GDP figures are based on the national currency Chinese yuan (code:CN¥),for an easy comparison they are converted into US dollars according to official average annual exchange rates, purchasing power parity (PPP) according to comparison of IMF WEO figures.
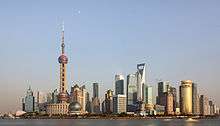
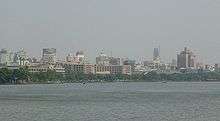
Shanghai is the richest city by GDP in China
.jpg)
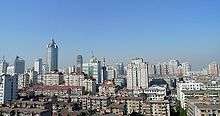
Beijing is the second richest Chinese city in terms of GDP
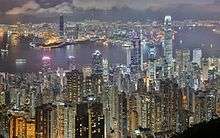
Hong Kong SAR has the third highest GDP of any city in China

Guangzhou, in Guangdong province, is the fourth largest city in China in economic terms
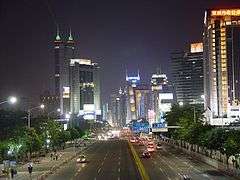
Shenzhen, also in Guangdong province, is the fifth richest Chinese city

Suzhou, in Jiangsu province is the Chinese city with the sixth highest GDP
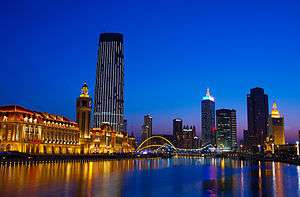
Tianjin is the seventh richest city in China

Chongqing is the eighth city with the highest GDP in China

Wuhan in Hubei province is the ninth richest city in China

Chengdu in Sichuan province is the tenth richest city in Mainland China
Hangzhou in Zhejiang province is the eleventh richest city in Mainland China
Wuxi, is the twelfth richest city by GDP in Mainland China
2013 List
| rank | city | CN¥ | US$ | Intl$. (PPP) | Provinces |
|---|---|---|---|---|---|
| Shanghai | 2,181,815 | 352,292 | 600,571 | Shanghai[1] | |
| Beijing | 1,980,081 | 319,719 | 545,041 | Beijing[1] | |
| 1 | Guangzhou | 1,542,014 | 248,985 | 424,458 | Guangdong[2] |
| 2 | Shenzhen | 1,450,023 | 234,131 | 399,137 | Guangdong[2] |
| Tianjin | 1,444,201 | 233,191 | 397,534 | Tianjin[1] | |
| 3 | Suzhou | 1,301,570 | 210,161 | 358,273 | Jiangsu[3] |
| Chongqing | 1,278,326 | 206,408 | 351,875 | Chongqing[1] | |
| 4 | Chengdu | 910,889 | 147,079 | 250,733 | Sichuan[4] |
| 5 | Wuhan | 905,127 | 146,149 | 249,147 | Hubei[5] |
| 6 | Hangzhou | 834,352 | 134,721 | 229,666 | Zhejiang[6] |
| 7 | Wuxi | 807,018 | 130,307 | 222,142 | Jiangsu[3] |
| 8 | Nanjing | 801,178 | 129,364 | 220,534 | Jiangsu[3] |
| 9 | Qingdao | 800,660 | 129,281 | 220,391 | Shandong[7] |
| 10 | Dalian | 765,079 | 123,535 | 210,597 | Liaoning[8] |
| 11 | Shenyang | 715,857 | 115,588 | 197,048 | Liaoning[8] |
| 12 | Changsha | 715,313 | 115,500 | 196,899 | Hunan[9] |
| 13 | Ningbo | 712,887 | 115,108 | 196,231 | Zhejiang[6] |
| 14 | Foshan | 701,017 | 113,191 | 192,963 | Guangdong[2] |
| 15 | Zhengzhou | 620,190 | 100,140 | 170,715 | Henan[10] |
| 16 | Tangshan | 612,121 | 98,838 | 168,494 | Hebei[11] |
| 17 | Yantai | 561,387 | 90,646 | 154,529 | Shandong[7] |
| 18 | Dongguan | 549,002 | 88,646 | 151,119 | Guangdong[2] |
| 19 | Jinan | 523,019 | 84,451 | 143,967 | Shandong[7] |
| 20 | Quanzhou | 521,800 | 84,254 | 143,632 | Fujian[12] |
| 21 | Nantong | 503,889 | 81,362 | 138,702 | Jiangsu[3] |
| 22 | Harbin | 501,081 | 80,908 | 137,929 | Heilongjiang[13] |
| 23 | Changchun | 500,318 | 80,785 | 137,719 | Jilin[14] |
| 24 | Xi'an | 488,413 | 78,863 | 134,442 | Shaanxi[15] |
| 25 | Shijiazhuang | 486,366 | 78,532 | 133,878 | Hebei[11] |
| 26 | Fuzhou | 467,849 | 75,542 | 128,781 | Fujian[12] |
| 27 | Hefei | 467,291 | 75,452 | 128,628 | Anhui[16] |
| 28 | Xuzhou | 443,582 | 71,624 | 122,101 | Jiangsu[3] |
| 29 | Weifang | 442,070 | 71,380 | 121,685 | Shandong[7] |
| 30 | Changzhou | 436,093 | 70,415 | 120,040 | Jiangsu[3] |
| 31 | Daqing | 418,150 | 67,518 | 115,101 | Heilongjiang[13] |
| 32 | Wenzhou | 400,386 | 64,649 | 110,211 | Zhejiang[6] |
| 33 | Shaoxing | 396,729 | 64,059 | 109,204 | Zhejiang[6] |
| 34 | Ordos | 395,590 | 63,875 | 108,891 | Inner Mongolia[17] |
| 35 | Zibo | 380,124 | 61,378 | 104,634 | Shandong[7] |
| 36 | Jining | 350,154 | 56,538 | 96,384 | Shandong[7] |
| 37 | Yancheng | 347,550 | 56,118 | 95,667 | Jiangsu[3] |
| 38 | Baotou | 342,475 | 55,299 | 94,270 | Inner Mongolia[17] |
| 39 | Kunming | 341,531 | 55,146 | 94,011 | Yunnan[18] |
| 40 | Linyi | 333,681 | 53,879 | 91,850 | Shandong[7] |
| 41 | Nanchang | 333,603 | 53,866 | 91,828 | Jiangxi[19] |
| 42 | Yangzhou | 325,201 | 52,509 | 89,516 | Jiangsu[3] |
| 43 | Dongying | 325,020 | 52,480 | 89,466 | Shandong[7] |
| 44 | Taizhou | 315,334 | 50,916 | 86,800 | Zhejiang[6] |
| 45 | Jiaxing | 314,766 | 50,824 | 86,643 | Zhejiang[6] |
| 46 | Luoyang | 313,614 | 50,638 | 86,326 | Henan[10] |
| 47 | Handan | 306,150 | 49,433 | 84,272 | Hebei[11] |
| 48 | Xiamen | 301,816 | 48,733 | 83,079 | Fujian[12] |
| 49 | Cangzhou | 301,299 | 48,650 | 82,936 | Hebei[11] |
| 50 | Taizhou, Jiangsu | 300,691 | 48,552 | 82,769 | Jiangsu[3] |
| 51 | Jinhua | 295,878 | 47,775 | 81,444 | Zhejiang[6] |
| 52 | Zhenjiang | 292,728 | 47,266 | 80,577 | Jiangsu[3] |
| 53 | Baoding | 290,431 | 46,895 | 79,945 | Hebei[11] |
| 54 | Yulin | 284,675 | 45,966 | 78,360 | Shaanxi[15] |
| 55 | Yichang | 281,807 | 45,503 | 77,571 | Hubei[5] |
| 56 | Xiangyang | 281,402 | 45,437 | 77,459 | Hubei[5] |
| 57 | Tai'an | 279,070 | 45,061 | 76,817 | Shandong[7] |
| 58 | Hohhot | 270,539 | 43,683 | 74,469 | Inner Mongolia[17] |
| 59 | Huizhou | 267,835 | 43,247 | 73,725 | Guangdong[2] |
| 60 | Nanning | 266,197 | 42,982 | 73,274 | Guangxi[20] |
| 61 | Zhongshan | 263,893 | 42,610 | 72,640 | Guangdong[2] |
| 62 | Anshan | 262,325 | 42,357 | 72,208 | Liaoning[8] |
| 63 | Jilin City | 261,741 | 42,263 | 72,047 | Jilin[14] |
| 64 | Weihai | 254,969 | 41,169 | 70,183 | Shandong[7] |
| 65 | Nanyang | 250,000 | 40,367 | 68,816 | Henan[10] |
| 66 | Dezhou | 246,059 | 39,731 | 67,731 | Shandong[7] |
| 67 | Yueyang | 243,551 | 39,326 | 67,040 | Hunan[9] |
| 68 | Taiyuan | 241,287 | 38,960 | 66,417 | Shanxi[21] |
| 69 | Ürümqi | 240,000 | 38,752 | 66,063 | Xinjiang[22] |
| 70 | Liaocheng | 236,587 | 38,201 | 65,123 | Shandong[7] |
| 71 | Changde | 226,494 | 36,571 | 62,345 | Hunan[9] |
| 72 | Zhangzhou | 223,602 | 36,104 | 61,549 | Fujian[12] |
| 73 | Hengyang | 216,944 | 35,029 | 59,716 | Hunan[9] |
| 74 | Maoming | 216,017 | 34,880 | 59,461 | Guangdong[2] |
| 75 | Huaian | 215,586 | 34,810 | 59,343 | Jiangsu[3] |
| 76 | Binzhou | 215,573 | 34,808 | 59,339 | Shandong[7] |
| 77 | Wuhu | 209,953 | 33,901 | 57,792 | Anhui[16] |
| 78 | Guiyang | 208,542 | 33,673 | 57,404 | Guizhou[23] |
| 79 | Zhanjiang | 206,001 | 33,262 | 56,704 | Guangdong[2] |
| 80 | Heze | 205,001 | 33,101 | 56,429 | Shandong[7] |
| 81 | Liuzhou | 201,005 | 32,456 | 55,329 | Guangxi[20] |
| 82 | Jiangmen | 200,018 | 32,296 | 55,057 | Guangdong[2] |
| 83 | Zhuzhou | 194,943 | 31,477 | 53,660 | Hunan[9] |
| 84 | Langfang | 194,313 | 31,375 | 53,487 | Hebei[11] |
| 85 | Xuchang | 190,330 | 30,732 | 52,391 | Henan[10] |
| 86 | Xianyang | 186,039 | 30,039 | 51,210 | Shaanxi[15] |
| 87 | Zaozhuang | 183,063 | 29,559 | 50,390 | Shandong[7] |
| 88 | Huzhou | 180,315 | 29,115 | 49,634 | Zhejiang[6] |
| 89 | Lianyungang | 178,542 | 28,829 | 49,146 | Jiangsu[3] |
| 90 | Tongliao | 178,180 | 28,770 | 49,046 | Inner Mongolia[17] |
| 91 | Lanzhou | 177,628 | 28,681 | 48,894 | Gansu[24] |
| 92 | Xinxiang | 176,600 | 28,515 | 48,611 | Henan[10] |
| 93 | Zhoukou | 175,340 | 28,312 | 48,264 | Henan[10] |
| 94 | Jiaozuo | 170,736 | 27,568 | 46,997 | Henan[10] |
| 95 | Suqian | 170,628 | 27,551 | 46,967 | Jiangsu[3] |
| 96 | Chifeng | 168,615 | 27,226 | 46,413 | Inner Mongolia[17] |
| 97 | Chenzhou | 168,552 | 27,216 | 46,396 | Hunan[9] |
| 98 | Anyang | 168,400 | 27,191 | 46,354 | Henan[10] |
| 99 | Ganzhou | 167,331 | 27,019 | 46,060 | Jiangxi[19] |
| 100 | Zhuhai | 166,238 | 26,842 | 45,759 | Guangdong[2] |
| 101 | Zhaoqing | 166,007 | 26,805 | 45,695 | Guangdong[2] |
| 102 | Guilin | 165,790 | 26,770 | 45,636 | Guangxi[20] |
| 103 | Songyuan | 165,048 | 26,650 | 45,432 | Jilin[14] |
| 104 | Jieyang | 160,535 | 25,921 | 44,189 | Guangdong[2] |
| 105 | Xingtai | 160,458 | 25,909 | 44,168 | Hebei[11] |
| 106 | Jiujiang | 160,173 | 25,863 | 44,090 | Jiangxi[19] |
| 107 | Zunyi | 158,467 | 25,587 | 43,620 | Guizhou[23] |
| 108 | Qujing | 158,394 | 25,575 | 43,600 | Yunnan[18] |
| 109 | Xinyang | 158,116 | 25,531 | 43,523 | Henan[10] |
| 110 | Shantou | 156,590 | 25,284 | 43,103 | Guangdong[2] |
| 111 | Pingdingshan | 155,690 | 25,139 | 42,856 | Henan[10] |
| 112 | Baoji | 154,591 | 24,961 | 42,553 | Shaanxi[15] |
| 113 | Shangqiu | 153,820 | 24,837 | 42,341 | Henan[10] |
| 114 | Yingkou | 151,311 | 24,432 | 41,650 | Liaoning[8] |
| 115 | Rizhao | 150,016 | 24,223 | 41,294 | Shandong[7] |
| 116 | Zhumadian | 149,813 | 24,190 | 41,238 | Henan[10] |
| 117 | Longyan | 147,990 | 23,896 | 40,736 | Fujian[12] |
| 118 | Sanming | 147,759 | 23,858 | 40,672 | Fujian[12] |
| 119 | Mianyang | 145,512 | 23,495 | 40,054 | Sichuan[4] |
| 120 | Xiangtan | 144,306 | 23,301 | 39,722 | Hunan[9] |
| 121 | Hulunbuir | 143,081 | 23,103 | 39,385 | Inner Mongolia[17] |
| 122 | Anqing | 141,824 | 22,900 | 39,039 | Anhui[16] |
| 123 | Shangrao | 140,131 | 22,627 | 38,573 | Jiangxi[19] |
| 124 | Deyang | 139,594 | 22,540 | 38,425 | Sichuan[4] |
| 125 | Yichun | 138,707 | 22,397 | 38,181 | Jiangxi[19] |
| 126 | Yan'an | 135,414 | 21,865 | 37,274 | Shaanxi[15] |
| 127 | Panjin | 135,106 | 21,815 | 37,190 | Liaoning[8] |
| 128 | Weinan | 134,901 | 21,782 | 37,133 | Shaanxi[15] |
| 129 | Jinzhou | 134,493 | 21,716 | 37,021 | Liaoning[8] |
| 130 | Yibin | 134,289 | 21,683 | 36,965 | Sichuan[4] |
| 131 | Putian | 134,286 | 21,683 | 36,964 | Fujian[12] |
| 132 | Fushun | 134,045 | 21,644 | 36,898 | Liaoning[8] |
| 133 | Jingzhou | 133,493 | 21,555 | 36,746 | Hubei[5] |
| 134 | Changzhi | 133,372 | 21,535 | 36,712 | Shanxi[21] |
| 135 | Huanggang | 133,255 | 21,516 | 36,680 | Hubei[5] |
| 136 | Nanchong | 132,855 | 21,452 | 36,570 | Sichuan[4] |
| 137 | Kaifeng | 132,739 | 21,433 | 36,538 | Henan[10] |
| 138 | Zhangjiakou | 131,702 | 21,266 | 36,253 | Hebei[11] |
| 139 | Maanshan | 129,302 | 20,878 | 35,592 | Anhui[16] |
| 140 | Chengde | 127,209 | 20,540 | 35,016 | Hebei[11] |
| 141 | Dazhou | 124,541 | 20,109 | 34,281 | Sichuan[4] |
| 142 | Xiaogan | 123,893 | 20,005 | 34,103 | Hubei[5] |
| 143 | Ningde | 123,872 | 20,001 | 34,097 | Fujian[12] |
Historical Data
2011 List
| rank | city | CN¥ | US$ | Intl$. (PPP) | Provinces |
|---|---|---|---|---|---|
| Shanghai | 1,919,569 | 297,202 | 466,708 | Shanghai | |
| Beijing | 1,625,193 | 251,625 | 395,136 | Beijing | |
| 1 | Guangzhou | 1,242,344 | 192,349 | 302,053 | Guangdong[25] |
| 2 | Shenzhen | 1,150,553 | 178,137 | 279,736 | Guangdong[25] |
| Tianjin | 1,130,728 | 175,068 | 274,916 | Tianjin | |
| 3 | Suzhou | 1,071,699 | 165,929 | 260,564 | Jiangsu[26] |
| Chongqing | 1,001,137 | 155,004 | 243,408 | Chongqing | |
| 4 | Hangzhou | 701,906 | 108,674 | 170,655 | Zhejiang[27] |
| 5 | Chengdu | 695,058 | 107,614 | 168,991 | Sichuan[28] |
| 6 | Wuxi | 688,015 | 106,524 | 167,278 | Jiangsu[26] |
| 7 | Wuhan | 676,220 | 104,697 | 164,410 | Hubei[29] |
| 8 | Qingdao | 661,560 | 102,428 | 160,846 | Shandong[30] |
| 9 | Foshan | 621,023 | 96,151 | 150,990 | Guangdong[25] |
| 10 | Dalian | 615,063 | 95,229 | 149,541 | Liaoning[31] |
| 11 | Nanjing | 614,552 | 95,150 | 149,417 | Jiangsu[26] |
| 12 | Ningbo | 605,924 | 93,814 | 147,319 | Zhejiang[27] |
| 13 | Shenyang | 591,571 | 91,591 | 143,830 | Liaoning[31] |
| 14 | Changsha | 561,933 | 87,003 | 136,624 | Hunan[32] |
| 15 | Tangshan | 544,245 | 84,264 | 132,323 | Hebei[33] |
| 16 | Zhengzhou | 497,985 | 77,102 | 121,076 | Henan[34] |
| 17 | Yantai | 490,683 | 75,971 | 119,301 | Shandong[30] |
| 18 | Dongguan | 473,539 | 73,317 | 115,132 | Guangdong[25] |
| 19 | Jinan | 440,629 | 68,221 | 107,131 | Shandong[30] |
| 20 | Quanzhou | 427,089 | 66,125 | 103,839 | Fujian[35] |
| 21 | Harbin | 424,219 | 65,681 | 103,141 | Heilongjiang[36] |
| 22 | Shijiazhuang | 408,268 | 63,211 | 99,263 | Hebei[33] |
| 23 | Nantong | 408,022 | 63,173 | 99,203 | Jiangsu[26] |
| 24 | Changchun | 400,308 | 61,979 | 97,327 | Jilin[37] |
| 25 | Xi'an | 386,258 | 59,803 | 93,912 | Shaanxi[38] |
| 26 | Daqing | 374,154 | 57,929 | 90,969 | Heilongjiang[36] |
| 27 | Fuzhou | 373,638 | 57,849 | 90,843 | Fujian[35] |
| 28 | Hefei | 363,662 | 56,305 | 88,418 | Anhui[39] |
| 29 | Changzhou | 358,099 | 55,444 | 87,065 | Jiangsu[26] |
| 30 | Xuzhou | 355,165 | 54,989 | 86,352 | Jiangsu[26] |
| 31 | Weifang | 354,184 | 54,837 | 86,113 | Shandong[30] |
| 32 | Wenzhou | 341,853 | 52,928 | 83,115 | Zhejiang[27] |
| 33 | Shaoxing | 333,200 | 51,589 | 81,011 | Zhejiang[27] |
| 34 | Zibo | 328,023 | 50,787 | 79,753 | Shandong[30] |
| 35 | Ordos | 321,854 | 49,832 | 78,253 | Inner Mongolia[40] |
| 36 | Baotou | 300,540 | 46,532 | 73,071 | Inner Mongolia[40] |
| 37 | Jining | 289,669 | 44,849 | 70,428 | Shandong[30] |
| 38 | Taizhou | 279,491 | 43,273 | 67,953 | Zhejiang[27] |
| 39 | Handan | 278,903 | 43,182 | 67,810 | Hebei[33] |
| 40 | Yancheng | 277,133 | 42,908 | 67,380 | Jiangsu[26] |
| 41 | Linyi | 277,045 | 42,894 | 67,358 | Shandong[30] |
| 42 | Luoyang | 270,276 | 41,846 | 65,713 | Henan[34] |
| 43 | Nanchang | 268,887 | 41,631 | 65,375 | Jiangxi[41] |
| 44 | Jiaxing | 267,709 | 41,449 | 65,088 | Zhejiang[27] |
| 45 | Dongying | 267,635 | 41,437 | 65,071 | Shandong[30] |
| 46 | Yangzhou | 263,030 | 40,724 | 63,951 | Jiangsu[26] |
| 47 | Cangzhou | 258,520 | 40,026 | 62,854 | Hebei[33] |
| 48 | Xiamen | 253,931 | 39,316 | 61,739 | Fujian[35] |
| 49 | Kunming | 250,985 | 38,859 | 61,022 | Yunnan[42] |
| 50 | Jinhua | 245,807 | 38,058 | 59,763 | Zhejiang[27] |
| 51 | Baoding | 244,990 | 37,931 | 59,565 | Hebei[33] |
| 52 | Taizhou, Jiangsu | 242,261 | 37,509 | 58,901 | Jiangsu[26] |
| 53 | Anshan | 239,876 | 37,139 | 58,321 | Liaoning[31] |
| 54 | Zhenjiang | 231,145 | 35,788 | 56,199 | Jiangsu[26] |
| 55 | Tai'an | 230,431 | 35,677 | 56,025 | Shandong[30] |
| 56 | Yulin | 229,225 | 35,490 | 55,732 | Shaanxi[38] |
| 57 | Nanning | 221,144 | 34,239 | 53,767 | Guangxi[43] |
| 58 | Jilin City | 220,805 | 34,187 | 53,685 | Jilin[37] |
| 59 | Nanyang | 220,231 | 34,098 | 53,545 | Henan[34] |
| 60 | Zhongshan | 219,320 | 33,957 | 53,324 | Guangdong[25] |
| 61 | Hohhot | 217,727 | 33,710 | 52,936 | Inner Mongolia[40] |
| 62 | Yichang | 214,070 | 33,144 | 52,047 | Hubei[29] |
| 63 | Xiangyang | 213,222 | 33,013 | 51,841 | Hubei[29] |
| 64 | Weihai | 211,095 | 32,683 | 51,324 | Shandong[30] |
| 65 | Huizhou | 209,308 | 32,407 | 50,889 | Guangdong[25] |
| 66 | Taiyuan | 208,012 | 32,206 | 50,574 | Shanxi[44] |
| 67 | Dezhou | 195,071 | 30,202 | 47,428 | Shandong[30] |
| 68 | Liaocheng | 191,942 | 29,718 | 46,667 | Shandong[30] |
| 69 | Yueyang | 189,949 | 29,409 | 46,183 | Hunan[32] |
| 70 | Jiangmen | 183,064 | 28,343 | 44,509 | Guangdong[25] |
| 71 | Binzhou | 181,758 | 28,141 | 44,191 | Shandong[30] |
| 72 | Changde | 181,119 | 28,042 | 44,036 | Hunan[32] |
| 73 | Zhangzhou | 176,820 | 27,377 | 42,991 | Fujian[35] |
| 74 | Maoming | 174,531 | 27,022 | 42,434 | Guangdong[25] |
| 75 | Hengyang | 173,430 | 26,852 | 42,166 | Hunan[32] |
| 76 | Zhanjiang | 170,023 | 26,324 | 41,338 | Guangdong[25] |
| 77 | Urümqi | 169,003 | 26,166 | 41,090 | Xinjiang[45] |
| 78 | Huaian | 169,000 | 26,166 | 41,089 | Jiangsu[26] |
| 79 | Wuhu | 165,824 | 25,674 | 40,317 | Anhui[39] |
| 80 | Langfang | 161,142 | 24,949 | 39,179 | Hebei[33] |
| 81 | Xuchang | 158,874 | 24,598 | 38,627 | Henan[34] |
| 82 | Liuzhou | 157,972 | 24,458 | 38,408 | Guangxi[43] |
| 83 | Zhuzhou | 156,427 | 24,219 | 38,032 | Hunan[32] |
| 84 | Zaozhuang | 156,168 | 24,179 | 37,969 | Shandong[30] |
| 85 | Heze | 155,652 | 24,099 | 37,844 | Shandong[30] |
| 86 | Huzhou | 152,006 | 23,535 | 36,957 | Zhejiang[27] |
| 87 | Xinxiang | 148,941 | 23,060 | 36,212 | Henan[34] |
| 88 | Anyang | 148,661 | 23,017 | 36,144 | Henan[34] |
| 89 | Pingdingshan | 148,461 | 22,986 | 36,096 | Henan[34] |
| 90 | Tongliao | 144,882 | 22,432 | 35,225 | Inner Mongolia[40] |
| 91 | Jiaozuo | 144,262 | 22,336 | 35,075 | Henan[34] |
| 92 | Xingtai | 142,892 | 22,124 | 34,742 | Hebei[33] |
| 93 | Lianyungang | 141,052 | 21,839 | 34,294 | Jiangsu[26] |
| 94 | Zhoukou | 140,749 | 21,792 | 34,221 | Henan[34] |
| 95 | Zhuhai | 140,493 | 21,752 | 34,158 | Guangdong[25] |
| 96 | Guiyang | 138,307 | 21,414 | 33,627 | Guizhou[46] |
| 97 | Xianyang | 136,132 | 21,077 | 33,098 | Shaanxi[38] |
| 98 | Songyuan | 136,097 | 21,072 | 33,089 | Jilin[37] |
| 99 | Lanzhou | 136,003 | 21,057 | 33,067 | Gansu[47] |
| 100 | Chifeng | 134,719 | 20,858 | 32,754 | Inner Mongolia[40] |
| 101 | Chenzhou | 134,638 | 20,846 | 32,735 | Hunan[32] |
| 102 | Ganzhou | 133,600 | 20,685 | 32,482 | Jiangxi[41] |
| 103 | Guilin | 132,757 | 20,554 | 32,277 | Guangxi[43] |
| 104 | Zhaoqing | 132,441 | 20,506 | 32,201 | Guangdong[25] |
| 105 | Suqian | 132,083 | 20,450 | 32,114 | Jiangsu[26] |
| 106 | Shangqiu | 130,837 | 20,257 | 31,811 | Henan[34] |
| 107 | Shantou | 127,574 | 19,752 | 31,017 | Guangdong[25] |
| 108 | Xinyang | 125,768 | 19,472 | 30,578 | Henan[34] |
| 109 | Jiujiang | 125,641 | 19,453 | 30,547 | Jiangxi[41] |
| 110 | Zhumadian | 124,477 | 19,272 | 30,264 | Henan[34] |
| 111 | Longyan | 124,215 | 19,232 | 30,201 | Fujian[35] |
| 112 | Jieyang | 122,586 | 18,980 | 29,805 | Guangdong[25] |
| 113 | Yingkou | 122,465 | 18,961 | 29,775 | Liaoning[31] |
| 114 | Changzhi | 121,860 | 18,867 | 29,628 | Shanxi[44] |
| 115 | Anqing | 121,574 | 18,823 | 29,558 | Anhui[39] |
| 116 | Rizhao | 121,407 | 18,797 | 29,518 | Shandong[30] |
| 117 | Sanming | 121,181 | 18,762 | 29,463 | Fujian[35] |
| 118 | Qujing | 120,993 | 18,733 | 29,417 | Yunnan[42] |
| 119 | Mianyang | 118,911 | 18,411 | 28,911 | Sichuan[28] |
| 120 | Baoji | 117,575 | 18,204 | 28,586 | Shaanxi[38] |
| 121 | Hulunbuir | 114,531 | 17,733 | 27,846 | Inner Mongolia[40] |
| 122 | Maanshan | 114,430 | 17,717 | 27,822 | Anhui[39] |
| 123 | Deyang | 113,745 | 17,611 | 27,655 | Sichuan[28] |
| 124 | Linfen | 113,606 | 17,589 | 27,621 | Shanxi[44] |
| 125 | Lüliang | 113,071 | 17,507 | 27,491 | Shanxi[44] |
| 126 | Xiangtan | 112,414 | 17,405 | 27,331 | Hunan[32] |
| 127 | Zunyi | 112,146 | 17,363 | 27,266 | Guizhou[46] |
| 128 | Panjin | 111,992 | 17,339 | 27,229 | Liaoning[31] |
| 129 | Zhangjiakou | 111,861 | 17,319 | 27,197 | Hebei[33] |
| 130 | Jinzhou | 111,693 | 17,293 | 27,156 | Liaoning[31] |
| 131 | Fushun | 111,337 | 17,238 | 27,070 | Liaoning[31] |
| 132 | Yan'an | 111,335 | 17,238 | 27,069 | Shaanxi[38] |
| 133 | Shangrao | 111,058 | 17,195 | 27,002 | Jiangxi[41] |
| 134 | Chengde | 110,420 | 17,096 | 26,847 | Hebei[33] |
| 135 | Yibin | 109,118 | 16,894 | 26,530 | Sichuan[28] |
| 136 | Yichun | 107,798 | 16,690 | 26,209 | Jiangxi[41] |
| 137 | Kaifeng | 107,242 | 16,604 | 26,074 | Henan[34] |
| 138 | Qinhuangdao | 107,008 | 16,568 | 26,017 | Hebei[33] |
| 139 | Qiqihar | 106,567 | 16,500 | 25,910 | Heilongjiang[36] |
| 140 | Putian | 105,062 | 16,266 | 25,544 | Fujian[35] |
| 141 | Huanggang | 104,511 | 16,181 | 25,410 | Hubei[29] |
| 142 | Benxi | 104,459 | 16,173 | 25,397 | Liaoning[31] |
| 143 | Jingzhou | 104,312 | 16,150 | 25,362 | Hubei[29] |
| 144 | Sanmenxia | 103,045 | 15,954 | 25,053 | Henan[34] |
| 145 | Nanchong | 102,948 | 15,939 | 25,030 | Sichuan[28] |
| 146 | Weinan | 102,897 | 15,931 | 25,018 | Shaanxi[38] |
| 147 | Yulin, Guangxi | 101,994 | 15,791 | 24,798 | Guangxi[43] |
| 148 | Yuncheng | 101,682 | 15,743 | 24,722 | Shanxi[44] |
| 149 | Dazhou | 101,183 | 15,666 | 24,601 | Sichuan[28] |
| 150 | Qingyuan | 100,303 | 15,530 | 24,387 | Guangdong[25] |
| Liangshan Prefecture | 100,013 | 15,485 | 24,316 | Sichuan[28] |
2010 List
| rank | city | Provinces | CN¥ | US$ | Intl$. (PPP) |
|---|---|---|---|---|---|
| 1 | Shanghai | Shanghai[48] | 1,716,598 | 253,578 | 435,022 |
| Hong Kong | Hong Kong[49] | 1,519,423 | 224,458 | 324,966 | |
| 2 | Beijing | Beijing[48] | 1,411,358 | 208,488 | 357,668 |
| 3 | Guangzhou | Guangdong[50] | 1,074,828 | 158,775 | 272,384 |
| 4 | Shenzhen | Guangdong[50] | 958,151 | 141,539 | 242,816 |
| 5 | Suzhou | Jiangsu[51] | 922,891 | 136,331 | 233,880 |
| 6 | Tianjin | Tianjin[48] | 922,446 | 136,265 | 233,767 |
| 7 | Chongqing | Chongqing[48] | 792,558 | 117,078 | 200,851 |
| 8 | Hangzhou | Zhejiang[52] | 594,917 | 87,882 | 150,765 |
| 9 | Wuxi | Jiangsu[51] | 579,330 | 85,579 | 146,814 |
| 10 | Qingdao | Shandong[53] | 566,619 | 83,702 | 143,593 |
| 11 | Foshan | Guangdong[50] | 565,152 | 83,485 | 143,221 |
| 12 | Wuhan | Hubei[54] | 556,593 | 82,221 | 141,052 |
| 13 | Chengdu | Sichuan[55] | 555,133 | 82,005 | 140,682 |
| 14 | Ningbo | Zhejiang[52] | 516,300 | 76,269 | 130,841 |
| 15 | Dalian | Liaoning[56] | 515,816 | 76,197 | 130,719 |
| 16 | Nanjing | Jiangsu[51] | 513,065 | 75,791 | 130,022 |
| 17 | Shenyang | Liaoning[56] | 501,754 | 74,120 | 127,155 |
| 18 | Changsha | Hunan[57] | 454,706 | 67,170 | 115,232 |
| 19 | Tangshan | Hebei[58] | 446,916 | 66,019 | 113,258 |
| 20 | Yantai | Shandong[53] | 435,846 | 64,384 | 110,453 |
| 21 | Dongguan | Guangdong[50] | 424,645 | 62,729 | 107,614 |
| 22 | Zhengzhou | Henan[59] | 404,089 | 59,693 | 102,405 |
| 23 | Ji'nan | Shandong[53] | 391,053 | 57,767 | 99,101 |
| 24 | Harbin | Heilongjiang[60] | 366,485 | 54,138 | 92,875 |
| 25 | Quanzhou | Fujian[61] | 356,497 | 52,662 | 90,344 |
| 26 | Nantong | Jiangsu[51] | 346,567 | 51,195 | 87,827 |
| 27 | Shijiazhuang | Hebei[58] | 340,102 | 50,240 | 86,189 |
| 28 | Changchun | Jilin[62] | 332,903 | 49,177 | 84,365 |
| 29 | Xi'an | Shaanxi[63] | 324,169 | 47,887 | 82,151 |
| 30 | Fuzhou | Fujian[61] | 312,341 | 46,139 | 79,154 |
| 31 | Weifang | Shandong[53] | 309,092 | 45,660 | 78,330 |
| 32 | Changzhou | Jiangsu[51] | 304,489 | 44,980 | 77,164 |
| 33 | Xuzhou | Jiangsu[51] | 294,214 | 43,462 | 74,560 |
| 34 | Wenzhou | Zhejiang[52] | 292,504 | 43,209 | 74,127 |
| 35 | Daqing | Heilongjiang[60] | 290,006 | 42,840 | 73,494 |
| 36 | Zibo | Shandong[53] | 286,675 | 42,348 | 72,650 |
| 37 | Shaoxing | Zhejiang[52] | 279,520 | 41,291 | 70,836 |
| 38 | Hefei | Anhui[64] | 270,161 | 39,909 | 68,465 |
| 39 | Ordos | Inner Mongolia[65] | 264,323 | 39,046 | 66,985 |
| 40 | Jining | Shandong[53] | 254,281 | 37,563 | 64,440 |
| 41 | Baotou | Inner Mongolia[65] | 246,080 | 36,351 | 62,362 |
| 42 | Taizhou | Zhejiang[52] | 242,645 | 35,844 | 61,491 |
| 43 | Linyi | Shandong[53] | 239,999 | 35,453 | 60,821 |
| 44 | Handan | Hebei[58] | 236,156 | 34,885 | 59,847 |
| 45 | Dongying | Shandong[53] | 235,994 | 34,861 | 59,806 |
| 46 | Yancheng | Jiangsu[51] | 233,276 | 34,460 | 59,117 |
| 47 | Luoyang | Henan[59] | 232,025 | 34,275 | 58,800 |
| 48 | Jiaxing | Zhejiang[52] | 230,020 | 33,979 | 58,292 |
| 49 | Yangzhou | Jiangsu[51] | 222,949 | 32,934 | 56,500 |
| 50 | Nanchang | Jiangxi[66] | 220,711 | 32,604 | 55,933 |
| 51 | Cangzhou | Hebei[58] | 220,312 | 32,545 | 55,832 |
| 52 | Anshan | Liaoning[56] | 212,501 | 31,391 | 53,852 |
| 53 | Kunming | Yunnan[67] | 212,030 | 31,321 | 53,733 |
| 54 | Jinhua | Zhejiang[52] | 211,004 | 31,170 | 53,473 |
| 55 | Xiamen | Fujian[61] | 206,007 | 30,432 | 52,207 |
| 56 | Tai'an | Shandong[53] | 205,168 | 30,308 | 51,994 |
| 57 | Baoding | Hebei[58] | 205,030 | 30,287 | 51,959 |
| 58 | Taizhou | Jiangsu[51] | 204,872 | 30,264 | 51,919 |
| 59 | Zhenjiang | Jiangsu[51] | 198,764 | 29,362 | 50,371 |
| 60 | Nanyang | Henan[59] | 195,336 | 28,855 | 49,502 |
| 61 | Weihai | Shandong[53] | 194,470 | 28,727 | 49,283 |
| 62 | Hohhot | Inner Mongolia[65] | 186,571 | 27,561 | 47,281 |
| 63 | Zhongshan | Guangdong[50] | 185,065 | 27,338 | 46,899 |
| 64 | Jilin | Jilin[62] | 180,064 | 26,599 | 45,632 |
| 65 | Nanning | Guangxi[68] | 180,026 | 26,594 | 45,622 |
| 66 | Taiyuan | Shanxi[69] | 177,805 | 26,266 | 45,060 |
| 67 | Yulin | Shaanxi[63] | 175,667 | 25,950 | 44,518 |
| 68 | Huizhou | Guangdong[50] | 172,995 | 25,555 | 43,841 |
| 69 | Dezhou | Shandong[53] | 165,782 | 24,490 | 42,013 |
| 70 | Liaocheng | Shandong[53] | 162,238 | 23,966 | 41,115 |
| 71 | Jiangmen | Guangdong[50] | 157,042 | 23,198 | 39,798 |
| 72 | Yibin | Shandong[53] | 155,152 | 22,919 | 39,319 |
| 73 | Yichang | Hubei[54] | 154,732 | 22,857 | 39,212 |
| 74 | Yueyang | Hunan[57] | 153,936 | 22,740 | 39,011 |
| 75 | Xiangyang | Hubei[54] | 153,830 | 22,724 | 38,984 |
| 76 | Maoming | Guangdong[50] | 149,209 | 22,041 | 37,813 |
| 77 | Changde | Hunan[57] | 149,157 | 22,034 | 37,800 |
| 78 | Zhangzhou | Fujian[61] | 143,071 | 21,135 | 36,257 |
| 79 | Hengyang | Hunan[57] | 142,034 | 20,981 | 35,994 |
| 80 | Zhanjiang | Guangdong[50] | 140,506 | 20,756 | 35,607 |
| 81 | Huai'an | Jiangsu[51] | 138,807 | 20,505 | 35,177 |
| 82 | Zaozhuang | Shandong[53] | 136,204 | 20,120 | 34,517 |
| 83 | Langfang | Hebei[58] | 135,110 | 19,959 | 34,240 |
| 84 | Ürümqi | Xinjiang[70] | 133,852 | 19,773 | 33,921 |
| 85 | Xuchang | Henan[59] | 131,649 | 19,447 | 33,363 |
| 86 | Anyang | Henan[59] | 131,559 | 19,434 | 33,340 |
| 87 | Liuzhou | Guangxi[68] | 131,531 | 19,430 | 33,333 |
| 88 | Pingdingshan | Henan[59] | 131,084 | 19,364 | 33,219 |
| 89 | Huzhou | Zhejiang[52] | 130,173 | 19,229 | 32,989 |
| 90 | Zhuzhou | Hunan[57] | 127,548 | 18,842 | 32,323 |
| 91 | Jiaozuo | Henan[59] | 124,593 | 18,405 | 31,575 |
| 92 | Zhoukou | Henan[59] | 122,830 | 18,145 | 31,128 |
| 93 | Heze | Shandong[53] | 122,709 | 18,127 | 31,097 |
| 94 | Xingtai | Hebei[58] | 121,209 | 17,905 | 30,717 |
| 95 | Shantou | Guangdong[50] | 120,897 | 17,859 | 30,638 |
| 96 | Zhuhai | Guangdong[50] | 120,860 | 17,854 | 30,628 |
| 97 | Lianyungang | Jiangsu[51] | 119,331 | 17,628 | 30,241 |
| 98 | Xinxiang | Henan[59] | 118,994 | 17,578 | 30,156 |
| 99 | Tongliao | Inner Mongolia[65] | 117,662 | 17,381 | 29,818 |
| 100 | Shangqiu | Henan[59] | 114,379 | 16,896 | 28,986 |
| 101 | Guiyang | Guizhou[71] | 112,182 | 16,572 | 28,429 |
| 102 | Ganzhou | Jiangxi[66] | 111,974 | 16,541 | 28,377 |
| 103 | Wuhu | Anhui[64] | 110,863 | 16,377 | 28,095 |
| 104 | Guilin | Guangxi[68] | 110,356 | 16,302 | 27,967 |
| 105 | Songyuan | Jilin[62] | 110,285 | 16,291 | 27,948 |
| 106 | Lanzhou | Gansu[72] | 110,039 | 16,255 | 27,886 |
| 107 | Xianyang | Shaanxi[63] | 109,868 | 16,230 | 27,843 |
| 108 | Xinyang | Henan[59] | 109,183 | 16,129 | 27,669 |
| 109 | Qingyuan | Guangdong[50] | 108,818 | 16,075 | 27,577 |
| 110 | Chifeng | Inner Mongolia[65] | 108,623 | 16,046 | 27,527 |
| 111 | Zhaoqing | Guangdong[50] | 108,587 | 16,041 | 27,518 |
| 112 | Chenzhou | Hunan[57] | 108,176 | 15,980 | 27,414 |
| 113 | Suqian | Jiangsu[51] | 106,409 | 15,719 | 26,966 |
| 114 | Zhumadian | Henan[59] | 105,371 | 15,566 | 26,703 |
| 115 | Jiujiang | Jiangxi[66] | 103,206 | 15,246 | 26,155 |
| 116 | Rizhao | Shandong[53] | 102,508 | 15,143 | 25,978 |
| 117 | Jieyang | Guangdong[50] | 100,951 | 14,913 | 25,583 |
| 118 | Qujing | Yunnan[67] | 100,560 | 14,855 | 25,484 |
| 119 | Yingkou | Liaoning[56] | 100,245 | 14,808 | 25,404 |
See also
Notes
- ^ The annual average exchange rate of CNY to HKD: CNY 0.8713 per HKD in 2010.
- ^ The annual average exchange rate is CNY (Renminbi) 6.7695 per USD; 7.7692 Hong Kong dollar (HKD) per United States dollar in 2010. also see List of Historical Chinese yuan exchange rates.
- ^ All the GDP figures are recent statistical revisions from statistical yearbooks of provinces pubulished in later 2011.
- ^ According to IMF WEO data, the PPP is CNY 3.9460 per international currency in 2010. Hong Kong GDP PPP is from IMF WEO data (September 2011).
References
- 1 2 3 4 5 the 2013 GDP figures of Shanghai, Beijing, Tianjin and Chongqing are revisons based on China Economic Census 2013, see China NBS: National Data - Regional - annual by province; Nominal GDP is based on the official annual average exchange rate at CN¥ 6.1932 per US dollar; PPP GDP is based on IMF WEO Data October 2014, the average exchange rate is CN¥ 3.6329 per International dollar.
- 1 2 3 4 5 6 7 8 9 10 11 12 13 GDP 2013 figure of Guangdong divisions is from Guangdong statistical Yearbook 2014
- 1 2 3 4 5 6 7 8 9 10 11 12 13 GDP 2013 figure of Jiangsu divisions is from Jiangsu statistical Yearbook 2014(Chinese)
- 1 2 3 4 5 6 GDP 2013 figure of Sichuan divisions is from Sichuan statistical Yearbook 2014(Chinese/English)
- 1 2 3 4 5 6 GDP 2013 figure of Hubei divisions is from Hubei statistical Yearbook 2014(Chinese/English)
- 1 2 3 4 5 6 7 8 GDP 2013 figure of Zhejiang divisions is from Zhejiang statistical Yearbook 2014(Chinese)
- 1 2 3 4 5 6 7 8 9 10 11 12 13 14 15 16 GDP 2013 figure of Shandong divisions is from Shandong statistical Yearbook 2014(Chinese)
- 1 2 3 4 5 6 7 GDP 2013 figure of Liaoning divisions is from Liaoning statistical Yearbook 2014(Chinese)
- 1 2 3 4 5 6 7 GDP 2013 figure of Hunan divisions is from Hunan statistical Yearbook 2014(Chinese/English)
- 1 2 3 4 5 6 7 8 9 10 11 12 13 GDP 2013 figure of Henan divisions is from Henan statistical Yearbook 2014(Chinese/English)
- 1 2 3 4 5 6 7 8 9 see local Statistical Communiqué 2013 of Hebei cities: Shijiazhuang, Handan, Cangzhou, Baoding, Langfang, Xingtai, Zhangjiakou, Chengde, Chengde (Chinese/中文)
- 1 2 3 4 5 6 7 8 GDP 2013 figure of Fujian divisions is from Fujian statistical Yearbook 2014(Chinese)
- 1 2 see local Statistical Communiqué 2013 of Heilongjiang cities: Daqing, Harbin (Chinese/中文)
- 1 2 3 see local Statistical Communiqué 2013 of Jilin cities: Jilin city, Changchun, Songyuan (Chinese/中文)
- 1 2 3 4 5 6 GDP 2013 figure of Shaanxi divisions is from Shaanxi statistical Yearbook 2014(Chinese/English)
- 1 2 3 4 GDP 2013 figure of Anhui divisions is from Anhui statistical Yearbook 2014(Chinese/English)
- 1 2 3 4 5 6 see local Statistical Communiqué 2013 of Inner Mongolian cities: Baotou, Hohhot, Tongliao, Chifeng, Hulunbuir, (Chinese/中文)
- 1 2 see local Statistical Communiqué 2013 of Yunnan cities: Kunming, Qujing (Chinese/中文)
- 1 2 3 4 5 GDP 2013 figure of Jiangxi divisions is from Jiangxi statistical Yearbook 2014(Chinese/English)
- 1 2 3 GDP 2013 figure of Guangxi divisions is from Guangxi statistical Yearbook 2014(Chinese)
- 1 2 see local Statistical Communiqué 2013 of Shanxi cities: Taiyuan, Changzhi (Chinese/中文)
- ↑ GDP 2013 figure of Xinjiang divisions is from Xinjiang statistical Yearbook 2014(Chinese)
- 1 2 see local Statistical Communiqué 2013 of Guizhou cities: Guiyang, Zunyi (Chinese/中文)
- ↑ see local Statistical Communiqué 2013 of Lanzhou city, Gansu: Lanzhou (Chinese/中文)
- 1 2 3 4 5 6 7 8 9 10 11 12 13 14 GDP 2011 figure of Guangdong divisions is from Guangdong Statistical Yearbook 2012( ISBN 978-7-89468-203-1/F.403 )
- 1 2 3 4 5 6 7 8 9 10 11 12 13 GDP 2011 figure of Jiangsu divisions is from Jiangsu statistical Yearbook 2012( ISBN 978-7-5037-6591-9 )
- 1 2 3 4 5 6 7 8 GDP 2011 figure of Zhejiang divisions is from Zhejiang statistical Yearbook 2012(ISBN 9787503766008 )
- 1 2 3 4 5 6 7 GDP 2011 figure of Sichuan divisions is from Sichuan Statistical Yearbook 2012 (ISBN 978-7-89468-249-9. /F·44 )
- 1 2 3 4 5 GDP 2011 figure of Hubei divisions is from Hubei Statistical Yearbook 2012(ISBN 978-7-5037-6633-6 )
- 1 2 3 4 5 6 7 8 9 10 11 12 13 14 15 16 GDP 2011 figure of Shandong divisions is from Shandong statistical Yearbook 2012( ISBN 9787503765841 )
- 1 2 3 4 5 6 7 8 GDP 2011 figure of Liaoning divisions is from Liaoning Statistical Yearbook 2012( ISBN 978-7-89468-271-0/F.471 )
- 1 2 3 4 5 6 7 GDP 2011 figure of Hunan divisions is from Hunan statistical Yearbook 2012( ISBN 978-7-89468-292-5/F·492 )
- 1 2 3 4 5 6 7 8 9 10 GDP 2011 figure of Hebei divisions is from Hebei Statistical Yearbook 2012( ISBN 9787503766930 )
- 1 2 3 4 5 6 7 8 9 10 11 12 13 14 GDP 2011 figure of Henan divisions is from Henan Statistical Yearbook 2012( ISBN 7503766700 )
- 1 2 3 4 5 6 7 GDP 2011 figure of Fujian divisions is from Fujian Statistical Yearbook 2012( ISBN 978-7-5037-6614-5 )
- 1 2 3 GDP 2011 figure of Helongjiang divisions is from Heilongjiang statistical Yearbook 2012( ISBN 9787503766329 )
- 1 2 3 GDP 2011 figure of Jilin divisions is from Jilin statistical Yearbook 2012( ISBN 9787503766732 )
- 1 2 3 4 5 6 GDP 2011 figure of Shaanxi divisions is from Shaanxi Statistical Yearbook 2012(ISBN 9787503765933 )
- 1 2 3 4 GDP 2011 figure of Anhui divisions is from Anhui statistical Yearbook 2012( ISBN 9787503765810 )
- 1 2 3 4 5 6 GDP 2011 figure of Inner Mongolian divisions is from Inner Mongolian statistical Yearbook 2012(ISBN 978-7-89468-268-0/F.468)
- 1 2 3 4 5 GDP 2011 figure of Jiangxi divisions is from Jiangxi statistical Yearbook 2012(ISBN 978-7-5037-6648-0 )
- 1 2 GDP 2011 figure of Yunnan divisions is from Yunnan statistical Yearbook 2012( ISBN 9787541665929 )
- 1 2 3 4 GDP 2011 figure of Guangxi divisions is from Guangxi Statistical Yearbook 2012( ISBN 978-7-89468-261-1 )
- 1 2 3 4 5 GDP 2011 figure of Shanxi divisions is from Shanxi Statistical Yearbook 2012( ISBN 978-7-89468-255-0 )
- ↑ GDP 2011 figure of Xinjiang divisions is from Heilongjiang statistical Yearbook 2012( ISBN 7503766875 )
- 1 2 GDP 2011 figure of Guizhou divisions is from Guizhou statistical Yearbook 2012( ISBN 9787503766800 )
- ↑ GDP 2011 figure of Gansu divisions is from Gansu statistical Yearbook 2012( ISBN 978-7-89468-257-4/F.457 )
- 1 2 3 4 GDP figure of Shangshai, Beijing, Tianjin and Chongqing 4 municipalities is according to China Statistical Yearbook 2011(ISBN 978-7-89468-215-4/F.415)
- ↑ Original GDP figure of Hong Kong SAR is HK$ 1,743,858 mil. (revision, instead of the former 1,748,090 mil.) from Hong Kong Census and Statistics Department, It is converted into CN¥ 1,519,423 mil. ( CN¥ 0.8713 per HK$) or US$ 224,458 mil. (HK$ 7.7692 per US$).
- 1 2 3 4 5 6 7 8 9 10 11 12 13 14 GDP figure of Guangdong cities is from Guangdong Statistical Yearbook 2011(ISBN 978-7-89468-203-1/F.403)
- 1 2 3 4 5 6 7 8 9 10 11 12 13 GDP figure of Jiangsu cities is from Jiangsu Statistical Yearbook 2011(ISBN 978-7-89468-190-4/F.390)
- 1 2 3 4 5 6 7 8 GDP figure of Zhejiang cities is from Zhejiang Statistical Yearbook 2011(ISBN 978-7-5037-6257-4)
- 1 2 3 4 5 6 7 8 9 10 11 12 13 14 15 16 GDP figure of Shandong cities is from Shandong Statistical Yearbook 2011(ISBN 978-7-89468-199-7/F.399)
- 1 2 3 GDP figure of Hubei cities is from Hubei Statistical Yearbook 2011(ISBN 978-7-89468-213-0/F.413)
- ↑ GDP figure of Chengdu is from Sichuan Statistical Yearbook 2011(ISBN 978-7-5037-6298-7)
- 1 2 3 4 GDP figure of Liaoning cities is from Liaoning Statistical Yearbook 2011(ISBN 978-7-89468-219-2/F.419)
- 1 2 3 4 5 6 GDP figure of Hunan cities is from Hunan Statistical Yearbook 2011(ISBN 978-7-89468-208-6/F.408)
- 1 2 3 4 5 6 7 GDP figure of Hebei cities is from Hebei Statistical Yearbook 2011(ISBN 978-7-89468-232-1/F.432)
- 1 2 3 4 5 6 7 8 9 10 11 12 GDP figure of Henan cities is from Henan Statistical Yearbook 2011(ISBN 978-7-89468-218-5/F.418)
- 1 2 GDP figure of Heilongjiang cities is from Heilongjiang Statistical Yearbook 2011(ISBN 978 7 5037-6326-7)
- 1 2 3 4 GDP figure of Fujian cities is from Fujian Statistical Yearbook 2011(ISBN 978-7-5037-6288-8)
- 1 2 3 GDP figure of Jilin cities is from Jilin Statistical Yearbook 2011(ISBN 978-7-5037-6320-5)
- 1 2 3 GDP figure of Shaanxi cities is from Shaanxi Statistical Yearbook 2011(ISBN 978-7-89468-194-2/F.394)
- 1 2 GDP figure of Anhui cities is from Anhui Statistical Yearbook 2011(ISBN 978-7-89468-206-2/F.406)
- 1 2 3 4 5 GDP figure of Inner Mongolian cities is from Inner Mongolian Statistical Yearbook 2011 (ISBN 978-7-5037-6335-9. /F.413)
- 1 2 3 GDP figure of Jiangxi cities is from Jiangxi Statistical Yearbook 2011(ISBN 978-7-89468-202-4/F.402)
- 1 2 GDP figure of Yunnan cities is from Yunnan Statistical Yearbook 2011(ISBN 978-7-5037-6302-1)
- 1 2 3 GDP figure of Guangxi cities is from Guangxi Statistical Yearbook 2011(ISBN 978-7-89468-217-8/F.417)
- ↑ GDP figure of Taiyuan is from Shanxi Statistical Yearbook 2011(ISBN 978-7-89468-193-5)
- ↑ GDP figure of Ürümqi is from Xinjiang Statistical Yearbook 2011(ISBN 978-7-89468-210-9/F.410)
- ↑ GDP figure of Guiyang is from Guizhou Statistical Yearbook 2011
- ↑ GDP figure of Lanzhou is from Gansu Development Yearbook 2011(ISBN 978-7-89468-224-6/F·424)
This article is issued from Wikipedia - version of the 11/29/2016. The text is available under the Creative Commons Attribution/Share Alike but additional terms may apply for the media files.