Phoenix metropolitan area
| Phoenix Metropolitan Area Valley of the Sun | |||||||||
|---|---|---|---|---|---|---|---|---|---|
| Metropolitan Statistical Area | |||||||||
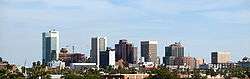
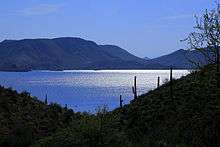
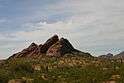
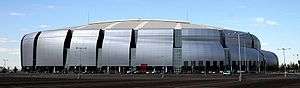
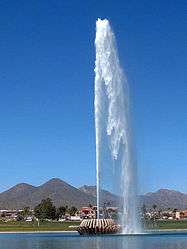
Left-right from top: Downtown Phoenix skyline, Lake Pleasant in Peoria, the Papago Buttes at Papago Park, University of Phoenix Stadium in Glendale, Chase Tower, the tallest building in Arizona, the Fountain of Fountain Hills, Tempe Town Lake with high-rises at night. | |||||||||
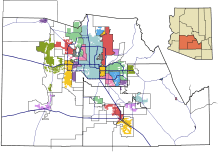
.svg.png) The Phoenix Metropolitan Area highlighted in a map of Arizona. | |||||||||
| Country |
| ||||||||
| State |
| ||||||||
| Largest city | Phoenix | ||||||||
| Other Major Cities |
• Maricopa County - Mesa - Chandler - Glendale - Scottsdale - Gilbert - Tempe - Peoria - Surprise • Pinal County - San Tan Valley - Casa Grande - Maricopa | ||||||||
| Area[1] | |||||||||
| • Metropolitan Statistical Area | 14,598.63 sq mi (23,494.22 km2) | ||||||||
| • Land | 14,565.76 sq mi (23,441.32 km2) | ||||||||
| • Water | 32.87 sq mi (52.9 km2) | ||||||||
| • Urban | 1,146.6 sq mi (2,969.6 km2) | ||||||||
| Highest elevation | 2,704 ft (824.18 m) | ||||||||
| Lowest elevation | 735 ft (224.03 m) | ||||||||
| Population (Census 2010)[2] | |||||||||
| • Metropolitan Statistical Area | 4,192,887 | ||||||||
| • Estimate (2015) | 4,574,531 (12th) | ||||||||
| • Density | 308.2/sq mi (192.6/km2) | ||||||||
| • Urban | 3,629,114 | ||||||||
| • Urban density | 3,165.2/sq mi (1,222.1/km2) | ||||||||
| Time zone | MST (UTC-7) | ||||||||
| ZIP codes | 850xx to 853xx, 856xx [3] | ||||||||
| Area code(s) | 623, 602, 480, 520, 928 | ||||||||
.jpg)
.jpg)
The Phoenix Metropolitan Area – often referred to as the Valley of the Sun, the Salt River Valley or Metro Phoenix – is a metropolitan area, centered on the city of Phoenix, that includes much of the central part of the U.S. State of Arizona. The United States Census Bureau designates the area as the Phoenix-Mesa-Chandler Metropolitan Statistical Area (MSA), defining it as Maricopa and Pinal counties. As of the Census Bureau's 2015 population estimates, the Valley had 4,574,351 residents, making it the 12th largest Metropolitan Area in the nation by population. The gross domestic product of the Phoenix Metropolitan Area was $215 billion in 2014, 15th largest amongst metro areas in the United States.
It is also one of the fastest growing major metropolitan areas, gaining nearly 400,000 residents from 2010 to 2015, and more than 1.3 million since 2000. The population of the Phoenix Metropolitan Area increased by 45.3% from 1990 through 2000, compared to the average United States rate of 13.2%, helping to make Arizona the second fastest growing state in the nation in the 1990s (the fastest was Nevada).[4] The 2000 Census reported the population of the metropolitan area to be 3,251,876.
As for the 2010 Census, the two-county metropolitan area was reported to have a population of 4,192,887. Metro Phoenix grew by 941,011 people from April 2000 to April 2010, making it one of the fastest growing metro areas in the country. This also contributed to the entire state's exceptional growth, as the area is home to just over two-thirds of Arizona's population.
Demographics
| Historical population | |||
|---|---|---|---|
| Census | Pop. | %± | |
| 1950 | 374,961 | — | |
| 1960 | 726,183 | 93.7% | |
| 1970 | 1,039,807 | 43.2% | |
| 1980 | 1,599,970 | 53.9% | |
| 1990 | 2,238,480 | 39.9% | |
| 2000 | 3,251,876 | 45.3% | |
| 2010 | 4,192,887 | 28.9% | |
| Est. 2015 | 4,574,531 | 9.1% | |
| U.S. Decennial Census | |||
As of the 2010 census, there were 4,192,887 people, 1,537,137 households, and 1,024,971 families residing within the MSA. The racial makeup of the MSA was 73.0% White (58.7% White Non-Hispanic), 5.0% Black, 3.3% Asian, 2.4% Native American or Alaska Native (virtually all Native American) and 16.2% of other or mixed race. 29.5% were Hispanic of any race.[5]
In 2010 the median income for a household in the MSA was $50,385 and the median income for a family was $58,497. The per capita income was $24,809.[6]
Communities in the Phoenix metropolitan area
What follows is a list of places in the Phoenix Metropolitan Area (populations as of 2014). The Office of Management and Budget defines a metropolitan area as the core city plus its county and any nearby counties that are economically dependent on the core city. However, Arizona has relatively large counties and a harsh, rugged desert landscape. For these reasons, much of the land that is part of the Metropolitan Statistical Area is rural or completely uninhabited. The core part of the Phoenix Metropolitan Area is the Phoenix–Mesa, Arizona Urban Area, which is far smaller than the Metropolitan Statistical Area.[7]
Places that fall completely or partially within the boundaries of the Phoenix-Mesa, AZ UA are in bold below.[7]
Cities and suburbs
Principal city
- Phoenix pop. 1,537,058
Places with 250,000+ inhabitants
Places with 150,000–249,999 inhabitants
- Gilbert pop. 239,277
- Glendale pop. 237,517
- Scottsdale pop. 230,512
- Tempe pop. 172,816
- Peoria pop. 166,934
Places with 75,000 to 149,999 inhabitants
Places with 30,000 to 74,999 inhabitants
- Buckeye pop. 59,470
- Casa Grande pop. 51,478
- Maricopa pop. 48,602
- Apache Junction pop. 38,131
- El Mirage pop. 33,532
- Queen Creek pop. 32,236
Places with 10,000–29,999 inhabitants
- Coolidge pop. 12,209
- Florence pop. 26,912
- Fountain Hills pop. 23,573
- Eloy pop. 16,738
- Paradise Valley pop. 13,663
Fewer than 10,000 inhabitants
- Carefree
- Cave Creek
- Gila Bend
- Guadalupe
- Kearny
- Litchfield Park
- Mammoth
- Superior
- Tolleson
- Wickenburg
- Youngtown
Unincorporated communities
Over 10,000 inhabitants
Under 10,000 inhabitants
- Aguila
- Ak-Chin Village
- Arizona City
- Arlington
- Bapchule
- Chuichu
- Circle City
- Eleven Mile Corner
- Komatke
- La Palma
- Liberty
- Morristown
- Olberg
- Palo Verde
- Queen Valley
- Rio Verde
- Sacaton
- Stanfield
- Tonopah
- Tortilla Flat
- Valley Farms
- Waddell
- Wintersburg
- Wittmann
Geography
As of 2010, the Phoenix Metropolitan area consists of Maricopa and Pinal counties, comprising a total area of about 14,600 square miles. Because of the size of counties in Arizona, even though Maricopa and Pinal counties together contain nearly 4.5 million people, most of the area is uninhabited, which gives the MSA an extremely low density compared to other major MSAs in the nation.
The average elevation is about 2,000 feet (610 m), with the highest point being 2,704 feet (824 m).
Climate
The Phoenix Metropolitan area is notable for its warm, desert climate. On average, the area receives about 9 inches of rain annually, with less than 1 inch of snow every decade. In total, the region will see about 32 days of measurable precipitation each year. The MSA is one of the sunniest major metropolitan areas, receiving 295 days of sunshine, compared to the national average of 205. The average July high is about 104 °F (40 °C), with the average January low being about 37 °F (3 °C), still above freezing. Bestplaces gives the Phoenix Metropolitan Area a comfort index[lower-alpha 1] of 44/100, which is also the national average.[8]
Below is a chart showing climate data collected from Sky Harbor Airport. Note that due to the vast area covered by the MSA, climates may differ depending on where in the valley you are located.
| Climate data for Phoenix Int'l, Arizona (1981–2010 normals,[lower-alpha 2] extremes 1895–present)[lower-alpha 3] | |||||||||||||
|---|---|---|---|---|---|---|---|---|---|---|---|---|---|
| Month | Jan | Feb | Mar | Apr | May | Jun | Jul | Aug | Sep | Oct | Nov | Dec | Year |
| Record high °F (°C) | 88 (31) |
92 (33) |
100 (38) |
105 (41) |
114 (46) |
122 (50) |
121 (49) |
117 (47) |
116 (47) |
107 (42) |
96 (36) |
87 (31) |
122 (50) |
| Mean maximum °F (°C) | 78.7 (25.9) |
82.8 (28.2) |
90.0 (32.2) |
98.6 (37) |
105.9 (41.1) |
112.5 (44.7) |
114.4 (45.8) |
112.5 (44.7) |
108.6 (42.6) |
100.1 (37.8) |
88.1 (31.2) |
77.1 (25.1) |
115.2 (46.2) |
| Average high °F (°C) | 67.2 (19.6) |
70.7 (21.5) |
76.9 (24.9) |
85.2 (29.6) |
94.8 (34.9) |
103.9 (39.9) |
106.1 (41.2) |
104.4 (40.2) |
99.8 (37.7) |
88.5 (31.4) |
75.5 (24.2) |
66.0 (18.9) |
86.6 (30.3) |
| Average low °F (°C) | 45.6 (7.6) |
48.7 (9.3) |
53.5 (11.9) |
60.2 (15.7) |
69.4 (20.8) |
77.7 (25.4) |
83.5 (28.6) |
82.7 (28.2) |
76.9 (24.9) |
64.8 (18.2) |
52.7 (11.5) |
44.8 (7.1) |
63.4 (17.4) |
| Mean minimum °F (°C) | 36.2 (2.3) |
39.4 (4.1) |
43.2 (6.2) |
49.5 (9.7) |
58.0 (14.4) |
68.4 (20.2) |
73.7 (23.2) |
73.7 (23.2) |
67.1 (19.5) |
53.6 (12) |
40.8 (4.9) |
34.6 (1.4) |
33.5 (0.8) |
| Record low °F (°C) | 16 (−9) |
24 (−4) |
25 (−4) |
35 (2) |
39 (4) |
49 (9) |
63 (17) |
58 (14) |
47 (8) |
34 (1) |
27 (−3) |
22 (−6) |
16 (−9) |
| Average precipitation inches (mm) | 0.91 (23.1) |
0.92 (23.4) |
0.99 (25.1) |
0.28 (7.1) |
0.11 (2.8) |
0.02 (0.5) |
1.05 (26.7) |
1.00 (25.4) |
0.64 (16.3) |
0.58 (14.7) |
0.65 (16.5) |
0.88 (22.4) |
8.03 (204) |
| Average precipitation days (≥ 0.01 in) | 4.1 | 4.4 | 3.9 | 1.7 | 1.0 | 0.5 | 4.2 | 5.0 | 2.8 | 2.5 | 2.6 | 3.9 | 36.6 |
| Average relative humidity (%) | 50.9 | 44.4 | 39.3 | 27.8 | 21.9 | 19.4 | 31.6 | 36.2 | 35.6 | 36.9 | 43.8 | 51.8 | 36.6 |
| Mean monthly sunshine hours | 256.0 | 257.2 | 318.4 | 353.6 | 401.0 | 407.8 | 378.5 | 360.8 | 328.6 | 308.9 | 256.0 | 244.8 | 3,871.6 |
| Percent possible sunshine | 81 | 84 | 86 | 90 | 93 | 95 | 86 | 87 | 89 | 88 | 82 | 79 | 87 |
| Source: NOAA (relative humidity and sun 1961–1990)[9][10][11], Weather.com[12] | |||||||||||||
Economy
The Phoenix Metropolitan area has historically been the center of the state's economy. As with the state of Arizona, the area relied on the 5 C's (copper, cattle, climate, citrus, and cotton) for its economic growth and expansion. However, after World War II, the area entered the manufacturing industry, which spurred the growth of what would eventually be one of the largest urban areas in the nation. Currently, the two largest industries are manufacturing and tourism. About 10 million people visit from other States and Canada each year, due to the area's mild winters and long, sunny days. The technology and service industries currently account for almost 77% of total employment in the region.[13] As well as a strong tourism industry, the Phoenix area has a significant business sector. Several Fortune 500 and Fortune 1000 companies have their international headquarters in the area, including Avnet, PetSmart, Insight Technologies, Apollo Education Group, and Sprouts Farmers Market. Other Fortune 500 companies with significant presence include Banner Health, the state's largest private employer, American Airlines, which merged with Tempe-based US Airways, and Intel, which has a large regional campus in Chandler.[14]
The Metropolitan Area ranks 5th in the nation in economic growth, which is a major comeback from the recession.[15] The unemployment rate of the area is 5.3%, lower than the national rate of 6.3%. It also has slightly higher recent job growth (1.99% compared to 1.18%) and higher projected job growth (38.7% compared to 36.1%). Although the area has significantly higher sales tax rates compared with the nation as a whole (8.3% to 6%), income tax rates are lower than the national average (3.36% to 4.72%). The largest occupation by population is in the office/administrative sector, comprising more than a quarter of all jobs in the region.[16]
Infrastructure
Transportation
Freeways and expressways
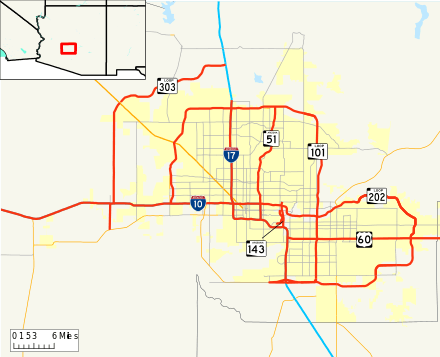
The Phoenix Metropolitan Area is served by several controlled-access freeways, including:
.svg.png) I-10 (Papago Freeway, Maricopa Freeway)
I-10 (Papago Freeway, Maricopa Freeway).svg.png) I-17 (Black Canyon Freeway, Maricopa Freeway)
I-17 (Black Canyon Freeway, Maricopa Freeway) US 60 (Maricopa Freeway, Superstition Freeway)
 SR 51 (Piestewa Freeway)
 Loop 101 (Agua Fria, Pima, Price Freeway)
 SR 143 (Hohokam Expressway)
 Loop 202 (Red Mountain, Santan Freeway)
 Loop 303 (Bob Stump Memorial Parkway)
Many new freeways are planned to be built in the future, either through upgrades of existing roads such as SR 74, SR 85, and Northern Parkway; or through the construction of new freeways where no road existed before such as SR 24, SR 30, I-11, and the South Mountain Freeway portion of Loop 202.
Arterial roads
Most of the arterial roads in the Phoenix metropolitan area are laid out on a regular grid, following the section lines established in the Public Land Survey System. As a result, arterial roads in cities that had once been geographically separate may have been given different names while occupying the same section line. When these roads were extended to accommodate the growth in the area they eventually merged into a single road while the previous segments retained their existing names. This results in several cases of a road abruptly changing names; for example, Dunlap Avenue in Phoenix becomes Olive Avenue west of 43rd Avenue, in Glendale.
Another quirk of a grid system based upon the Public Land Survey System is due to the occasional corrections in the grid caused by the curvature of the earth. This results in arterial roadways deviating slightly from a straight line, as can be seen in many locations where roads abruptly curve either just north or just south of Baseline Road to follow a new section line.
The majority of the cities in the metropolitan area, as well as unincorporated areas in Maricopa County, observe the addressing system employed by the City of Phoenix. A number of cities, however, retain their own addressing systems with differing reference points, creating the potential for multiple instances of a house number being found on the same named road.
In terms of numbering systems, some roads that continue through multiple cities will switch numbering conventions several times. A drive eastward along Broadway Road, for example, will pass through Goodyear, Avondale, Phoenix, Tempe, Mesa, and Apache Junction, each with their own reference point for address numbering. Though the street does not curve, the direction changes from west to east in each city and back again when moving from one city to the next, causing considerable overlap in numbers.
Street numbering systems
[17][18] Most communities in Maricopa County use the Phoenix-County numbering system, with the point of origin at Central Avenue and Washington Street. In the Phoenix-County system, north-south numbered roads labeled "avenue", "drive", and "lane" are located West of Central Avenue, while those labeled "street", "place" and "way" are located east of Central Avenue. Starting with 579th Avenue[19] in the west near Tonopah the avenues count down with approximately 8 numbers per mile to 19th Avenue and count up again to from 16th Street to 228th Street[20] near Queen Creek in the east. They go, in order from west to east (although not all necessarily exist):
- 2nd Avenue – 1st Dale – 1st Glen – 1st Lane – 1st Drive – 1st Avenue
- Central Avenue
- 1st Street – 1st Place – 1st Way – 1st Terrace – 1st Run – 2nd Street
This has been a source of confusion for some newcomers, who might end up, for example, at 91st Avenue and Thunderbird Road, when in fact they intended to go to 91st Street and Thunderbird Road, between 30 minutes and an hour away from one another depending on traffic.
One beneficial quality of this arrangement for unfamiliar travelers is that the major north-south arterial roads are rarely similarly named; the "avenue" arterials in the West Valley are all odd-numbered and the "street" arterials in the East Valley are even-numbered, with the exception of 7th Ave. & 7th St., both being major roadways running parallel and each one-half mile from Central Ave.
Communities in Maricopa County that have their own street numbering systems include:
| Community | Point of Origin |
|---|---|
| Apache Junction | Idaho Road & Junction Drive |
| Avondale (historic downtown only) | Central Avenue & Western Avenue |
| Buckeye (historic downtown only) | Monroe Avenue & 1st Street |
| Chandler (historic downtown only) | Commonwealth Place & Arizona Avenue |
| Gilbert | Gilbert Road & Elliot Road |
| Litchfield Park | Old Litchfield Road & Wigwam Boulevard |
| Mesa (historic downtown only) | Center Street & Main Street |
| Goodyear (historic district only) | Western Avenue & Litchfield Road |
| Tempe | Mill Avenue & the Salt River |
| Wickenburg | Center Street & Frontier Street |
| Wittmann (core area only) | Center Street & Grand Avenue |
Additional confusion can be encountered in Mesa in its urban core, with east-west numbered avenues and drives counting down from 11th Avenue north towards Main Street),[21] and numbered streets and places counting down from 11th Place south towards Main Street.[22] Then, in the eastern part of the city, north-south streets and places count up from 22nd St east of Gilbert Rd,[23] to 112th Street on the Apache Junction border.[24] Also, numerous trailer parks inside the city limits run their own contradictory variations of the numbered street system.[25]
Most communities in Pinal County use the Pinal County street numbering system, whose point of origin is at SR 287 and 11 Mile Corner Road (the intersection of which is known as "11 Mile Corner"). Exceptions include:
| Community | Point of origin |
|---|---|
| Apache Junction | Idaho Road & Junction Drive |
| Casa Grande | Ash Avenue & Center Street |
| Coolidge | Central Avenue & railroad tracks |
| Eloy | Alsdorf Road & Main Street |
| Florence | Butte Avenue & Main Street |
| Queen Creek | (follows Phoenix-County) |
| Stanfield | SR 84 & Stanfield Road |
Note that Apache Junction continues Mesa's convention of numbered street names by having the north-south sequence continue up from 112th St while simultaneously having east-west numbered avenues south of Apache Trail and east-west numbered streets north of Apache Trail.[26]
Rail
A light rail system (dubbed the "METRO Light Rail," or "Worm") runs more than 20 miles from suburban Mesa, through Tempe and into Phoenix, traveling through the downtown area, offering access to Phoenix Sky Harbor International Airport and linking two of the four metro area campuses of Arizona State University. The light rail began public operation on December 27, 2008, and it was projected to initially accommodate 26,000 boardings a day, or more than 8 million boardings in its first year. The Valley Metro Rail boardings has experienced constant growth since the beginning. In the year 2012, the light rail boarded just over 14 million people.
Many expansions to the METRO system are currently in the early planning stages, and two are under construction. The Central Mesa extension project, which extends the Main Street line 2½ miles from its current terminus at Sycamore to Mesa Drive in Downtown Mesa, has finished construction and opened on August 22, 2015.[27] The Northwest rail project opened March 2016. The project extended the 19th Avenue track from its former terminus at Montebello Ave to Dunlap Avenue, 3 miles north.[28] Many more extensions are funded, with further projects being studied for feasibility.
Aviation
In 2010, Phoenix Sky Harbor International Airport was the 24th busiest passenger facility in the world and the 10th busiest in the United States, with more than 38 million passengers using the facility. With three terminal buildings encompassing 120 gates, more than 20 airlines offer daily non-stop flights to destinations throughout the world.
The Phoenix-Mesa Gateway Airport started commercial passenger flights in 2004. The airport currently provides service to 39 destinations.
There are several municipal and regional airports in the metropolitan area, however none of them are currently used by commercial airlines for passenger flights. They include, but are not limited to, Glendale Airport, Phoenix Deer Valley Airport, Phoenix Goodyear Airport, Scottsdale Airport, Falcon Field, Chandler Airport, Buckeye Airport, Phoenix Regional Airport, Pleasant Valley Airport, Estrella Sailport, Stellar Airpark, Skyranch at Carefree, Gila River Memorial Airport, Pegasus Airpark.
Housing
Changes in house prices for the area are publicly tracked on a regular basis using the Case–Shiller index; the statistic is published by Standard & Poor's and is also a component of S&P's 20-city composite index of the value of the U.S. residential real estate market.
See also
Notes
- ↑ The Comfort Index uses a combination of afternoon summer temperature and humidity to closely predict the effect that the humidity will have on people. Higher values indicate a more comfortable climate.
- ↑ Mean monthly maxima and minima (i.e. the highest and lowest temperature readings during an entire month or year) calculated based on data at said location from 1981 to 2010.
- ↑ Official records for Phoenix kept at downtown August 1895 to September 1953, and at Sky Harbor Int'l since October 1953. For more information see ThreadEx.
References
- ↑ http://www.bestplaces.net/people/metro/arizona/phoenix-mesa-scottsdale
- ↑ http://factfinder.census.gov/faces/tableservices/jsf/pages/productview.xhtml?src=bkmk
- ↑ http://www.bestplaces.net/find/zip.aspx?msa=38060&st=AZ
- ↑ "Census 2000 PHC-T-3. Ranking Tables for Metropolitan Areas: 1990 and 2000, United States Census Bureau, April 2, 2001, retrieved July 8, 2006
- ↑ DP-1 Profile of General Population and Housing Characteristics: 2010 – 2010 Demographic Profile Data, U.S. Census Bureau horizontal tab character in
|title=at position 5 (help) - ↑ DP03, SELECTED ECONOMIC CHARACTERISTICS – 2010 American Community Survey 1-Year Estimates, U.S. Census Bureau
- 1 2 URBANIZED AREA OUTLINE MAP (CENSUS 2000): Phoenix--Mesa, AZ (PDF), U.S. DEPARTMENT OF COMMERCE, Economics and Statistics Administration, U.S. Census Bureau
- ↑ http://www.bestplaces.net/climate/metro/arizona/phoenix-mesa-scottsdale
- ↑ "NowData - NOAA Online Weather Data". National Oceanic and Atmospheric Administration. Retrieved 12 April 2016.
- ↑ "Station Name: AZ Phoenix Sky Harbor INTL AP". National Oceanic and Atmospheric Administration. Retrieved 2 June 2015.
- ↑ "WMO Climate Normals for PHOENIX/SKY HARBOR INTL, AZ 1961–1990". National Oceanic and Atmospheric Administration. Retrieved 2 June 2015.
- ↑ "Monthly Averages for Phoenix, AZ – Temperature and Precipitation". The Weather Channel. Retrieved 2009-05-07.
- ↑ http://www.city-data.com/us-cities/The-West/Phoenix-Economy.html
- ↑ http://www.azcentral.com/story/money/business/2015/04/19/arizona-republic-100-largest-employers/25462291/
- ↑ http://www.bizjournals.com/phoenix/news/2012/06/27/the-top-10-us-metros-for-economic.html
- ↑ http://www.bestplaces.net/economy/metro/arizona/phoenix-mesa-scottsdale
- ↑ Phoenix Metropolitan Street Atlas (2006 ed.). Wide World of Maps. 2006.
- ↑ Google Maps
- ↑ "Google Maps". Google. January 1, 1970. Retrieved October 31, 2011.
- ↑ "Google Maps". Google. January 1, 1970. Retrieved October 31, 2011.
- ↑ "Google Maps". Google. January 1, 1970. Retrieved October 31, 2011.
- ↑ "Google Maps". Google. January 1, 1970. Retrieved October 31, 2011.
- ↑ "Google Maps". Google. January 1, 1970. Retrieved October 31, 2011.
- ↑ 56 S 111th Pl (January 1, 1970). "56 S 111 pl, Mesa, Maricopa, Arizona 85208 – Google Maps". Google. Retrieved October 31, 2011.
- ↑ 56 S 111th Pl (January 1, 1970). "56 S 111 pl, Mesa, Maricopa, Arizona 85208 – Google Maps". Google. Retrieved October 31, 2011.
- ↑ 56 S 111th Pl (January 1, 1970). "56 S 111 pl, Mesa, Maricopa, Arizona 85208 – Google Maps". Google. Retrieved October 31, 2011.
- ↑ http://www.valleymetro.org/projects_and_planning/project_detail/central_mesa
- ↑ http://www.valleymetro.org/projects_and_planning/project_detail/northwest_phase_i
External links
- "Phoenix metro population growth figures". Greater Phoenix Economic Council. Archived from the original on July 17, 2007.
- Phoenix.org

Coordinates: 33°10′N 112°02′W / 33.17°N 112.04°W